Автор: Dune
Компиляция: Felix, PANews
Недавно Dune совместно с Steakhouse Financial представили набор данных о стейблкоинах. Этот набор данных охватывает состав держателей, направления потоков средств, классификацию поведения в блокчейне и скорость обращения, что может служить основой для институционального анализа, исследовательских отчетов, мониторинга соответствия требованиям и принятия решений на высоком уровне. Проанализировав данные, Dune опубликовали статью, раскрывающую некоторые реальные аспекты рынка стейблкоинов. Далее подробности.
Все ссылаются на данные об объеме предложения стейблкоинов. Они повсюду: в каждом отчете, каждом телефонном разговоре о финансовых результатах, каждом слушании по вопросам политики. Но что мы действительно знаем о стейблкоинах, кроме цифры «более 3000 миллиардов долларов в обращении»?
Кто их держит? Насколько высока концентрация владения? Какова скорость их обращения? На каких блокчейнах они работают? Каково их фактическое использование? Это ликвидность в DeFi, платежи или просто бездействующий капитал?
Поскольку Meta объявила о планах интеграции платежей сторонними стейблкоинами на своей платформе; Bridge получил разрешение от Управления контролера денежного обращения США (OCC) на создание национального трастового банка; Payoneer открыла функционал стейблкоинов для 2 миллионов продавцов; Anchorage Digital запустила услуги по обеспечению соответствия стейблкоинов для неамериканских банков. Институты и регуляторы активно выходят на рынок, и им нужны ответы, гораздо более глубокие, чем просто цифра объема предложения.
Мы используем новый набор данных о стейблкоинах, выпущенный Dune, чтобы ответить на эти вопросы. Вот что показывают данные:
Обзор предложения
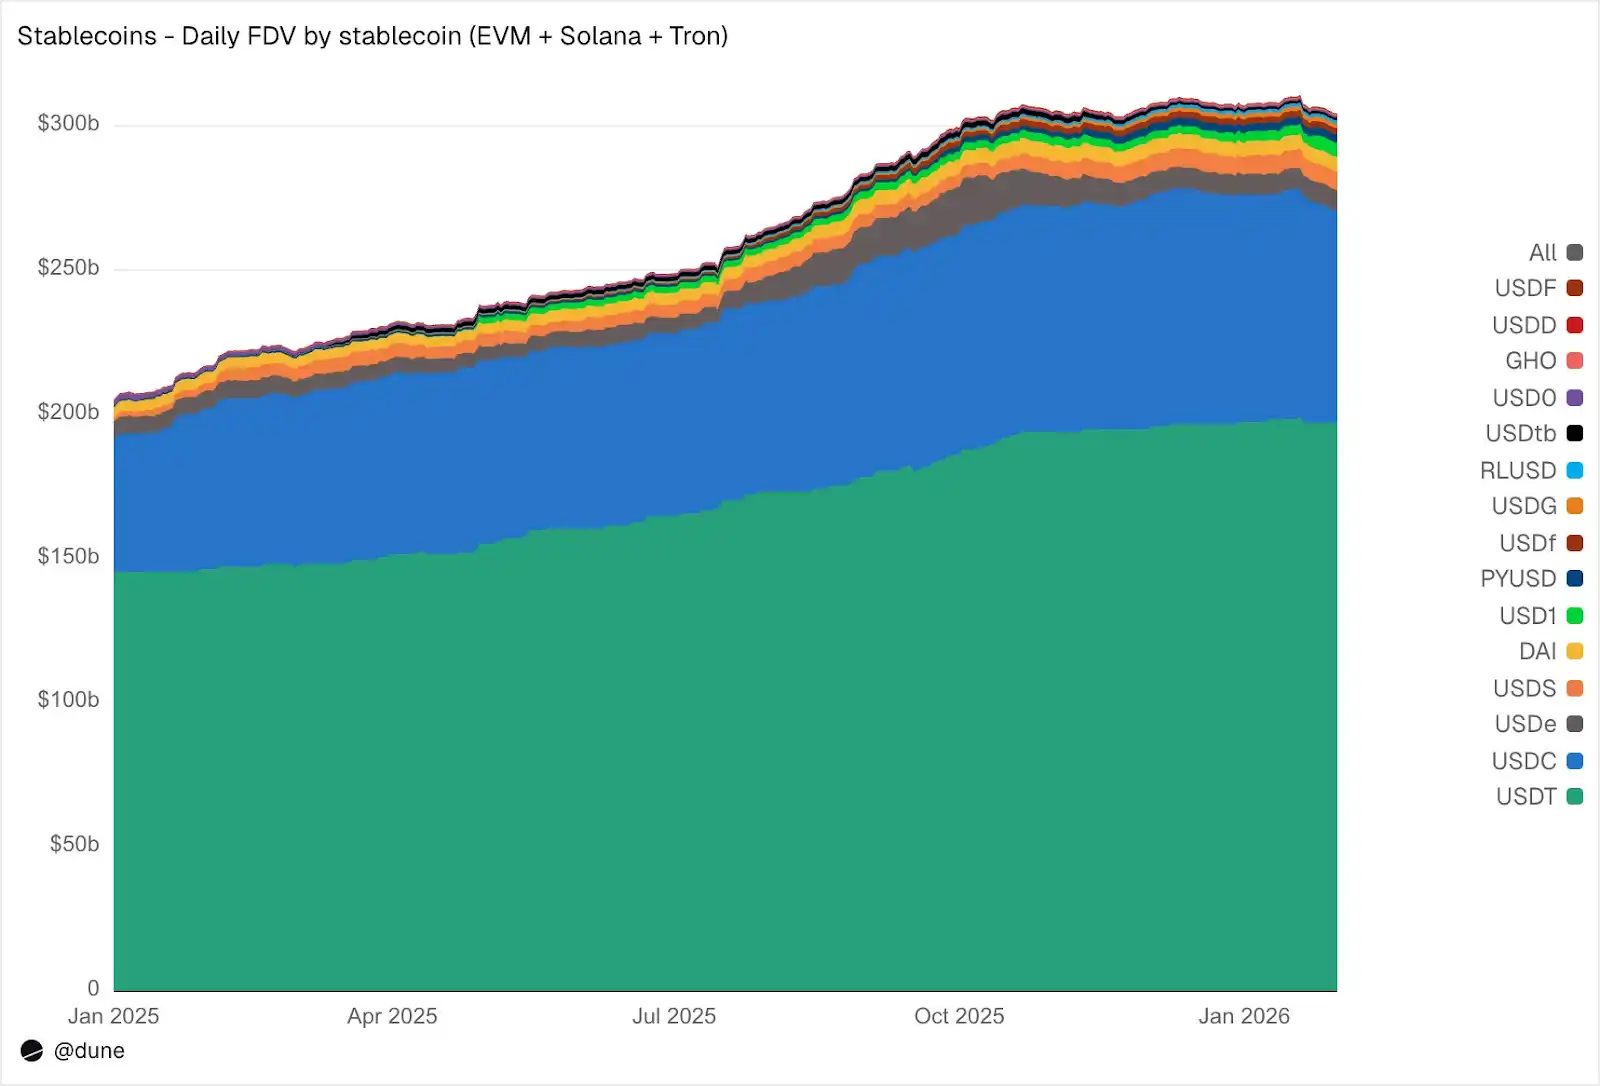
По состоянию на январь 2026 года, полностью разводненный объем предложения 15 крупнейших стейблкоинов в EVM-совместимых блокчейнах, Solana и Tron достиг 3040 миллиардов долларов, что на 49% больше, чем годом ранее. USDT от Tether (1970 миллиардов долларов) и USDC от Circle (730 миллиардов долларов) по-прежнему занимают 89% рыночной доли.
По блокчейнам: Ethereum — 1760 миллиардов долларов (58%); Tron — 840 миллиардов долларов (28%); Solana — 150 миллиардов долларов (5%); BNB Chain — 130 миллиардов долларов (4%). Несмотря на то, что общий объем предложения почти удвоился, распределение предложения по блокчейнам за последний год практически не изменилось.
Источник: Dune
Но помимо двух основных стейблкоинов, 2025 год стал «годом претендентов». Рыночная капитализация USDS (Sky Ecosystem) выросла на 376%, достигнув 6,3 миллиарда долларов. Рыночная капитализация PYUSD (PayPal) выросла на 753%, достигнув 2,8 миллиарда долларов. Рыночная капитализация RLUSD (Ripple) взлетела с 58 миллионов долларов до 1,1 миллиарда долларов, увеличившись на 1803%. Рыночная капитализация USDG выросла в 52 раза. А рыночная капитализация USD1 подскочила с нуля до 5,1 миллиарда долларов.
Но не все претенденты показали рост. USD0 упал на 66%, а USDe от Ethena, достигнув пика в октябре (почти утроившись), завершил год с ростом на 23%. Тем не менее, группа конкурентов под USDT и USDC значительно расширилась.
Кто держит стейблкоины
Большинство наборов данных о стейблкоинах могут рассказать вам только об общем объеме предложения. Поскольку наш набор данных отслеживает балансы на уровне кошельков, а также метки адресов, он может рассказать, кто держит эти стейблкоины.
Источник: Dune
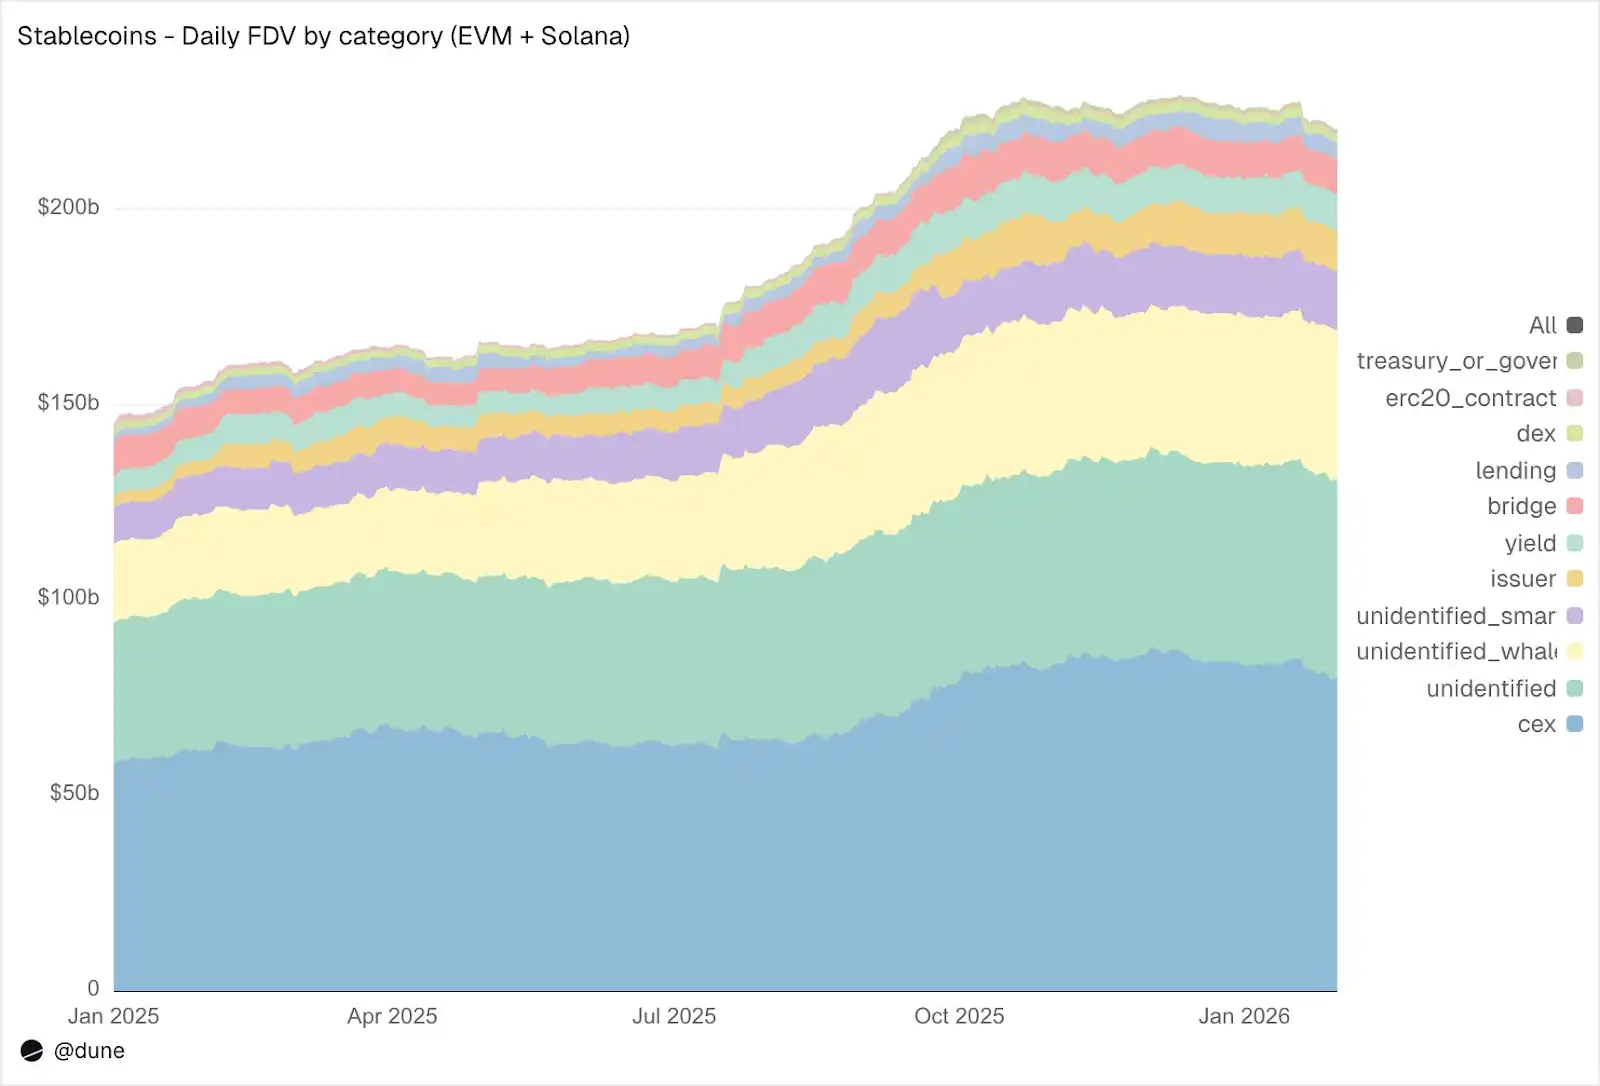
В EVM и Solana CEX являются крупнейшей известной категорией держателей, объемом 800 миллиардов долларов (в прошлом году — 580 миллиардов долларов). Основная функция стейблкоинов по-прежнему заключается в обеспечении инфраструктуры для торговли и расчетов на биржах. Кит-кошельки держат 390 миллиардов долларов. Объем в протоколах получения дохода почти удвоился, достигнув 9,3 миллиарда долларов, что отражает рост стратегий получения дохода в ончейне. Адреса эмитентов (казначейства и контракты на выпуск/сжигание) подскочили в 4,6 раза с 2,2 миллиарда долларов до 10,2 миллиарда долларов, что напрямую отражает масштабы поступления нового предложения на рынок.
О качестве меток: только 23% объема предложения находится на полностью неидентифицированных адресах. Для ончейн-данных это чрезвычайно высокий уровень идентификации. И это крайне важно для понимания реальных источников риска стейблкоинов.
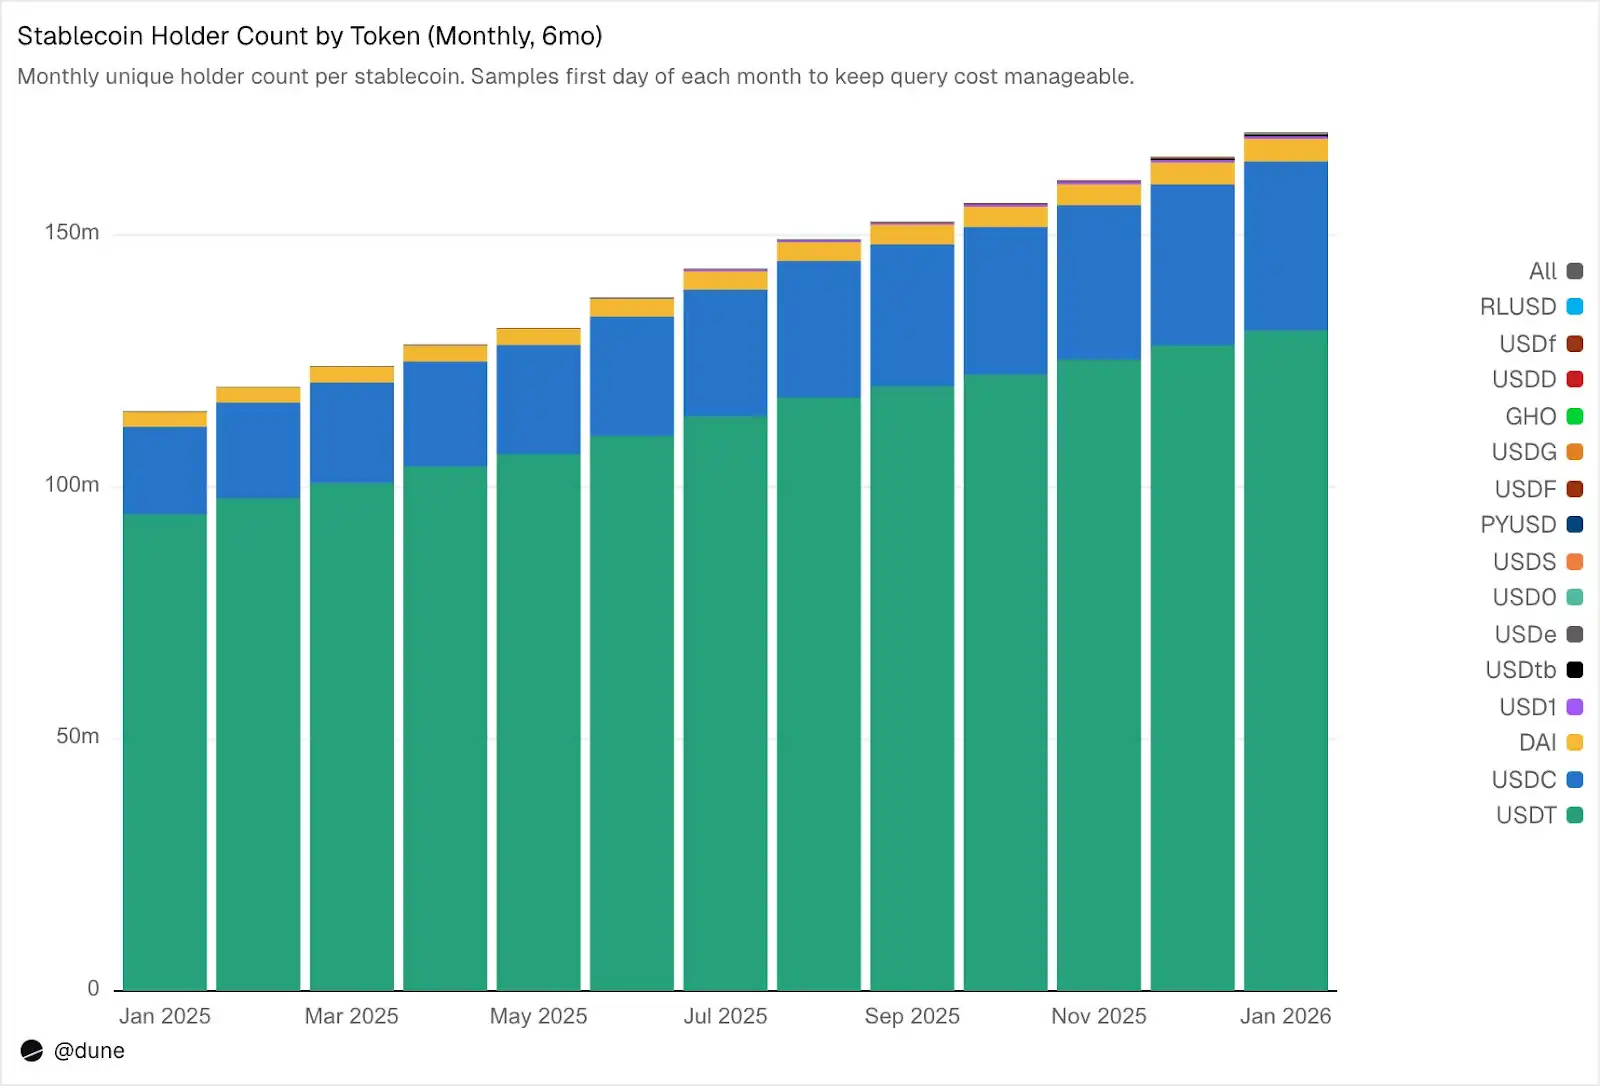
Количество держателей достигло 172 миллионов, но концентрация крайне высока
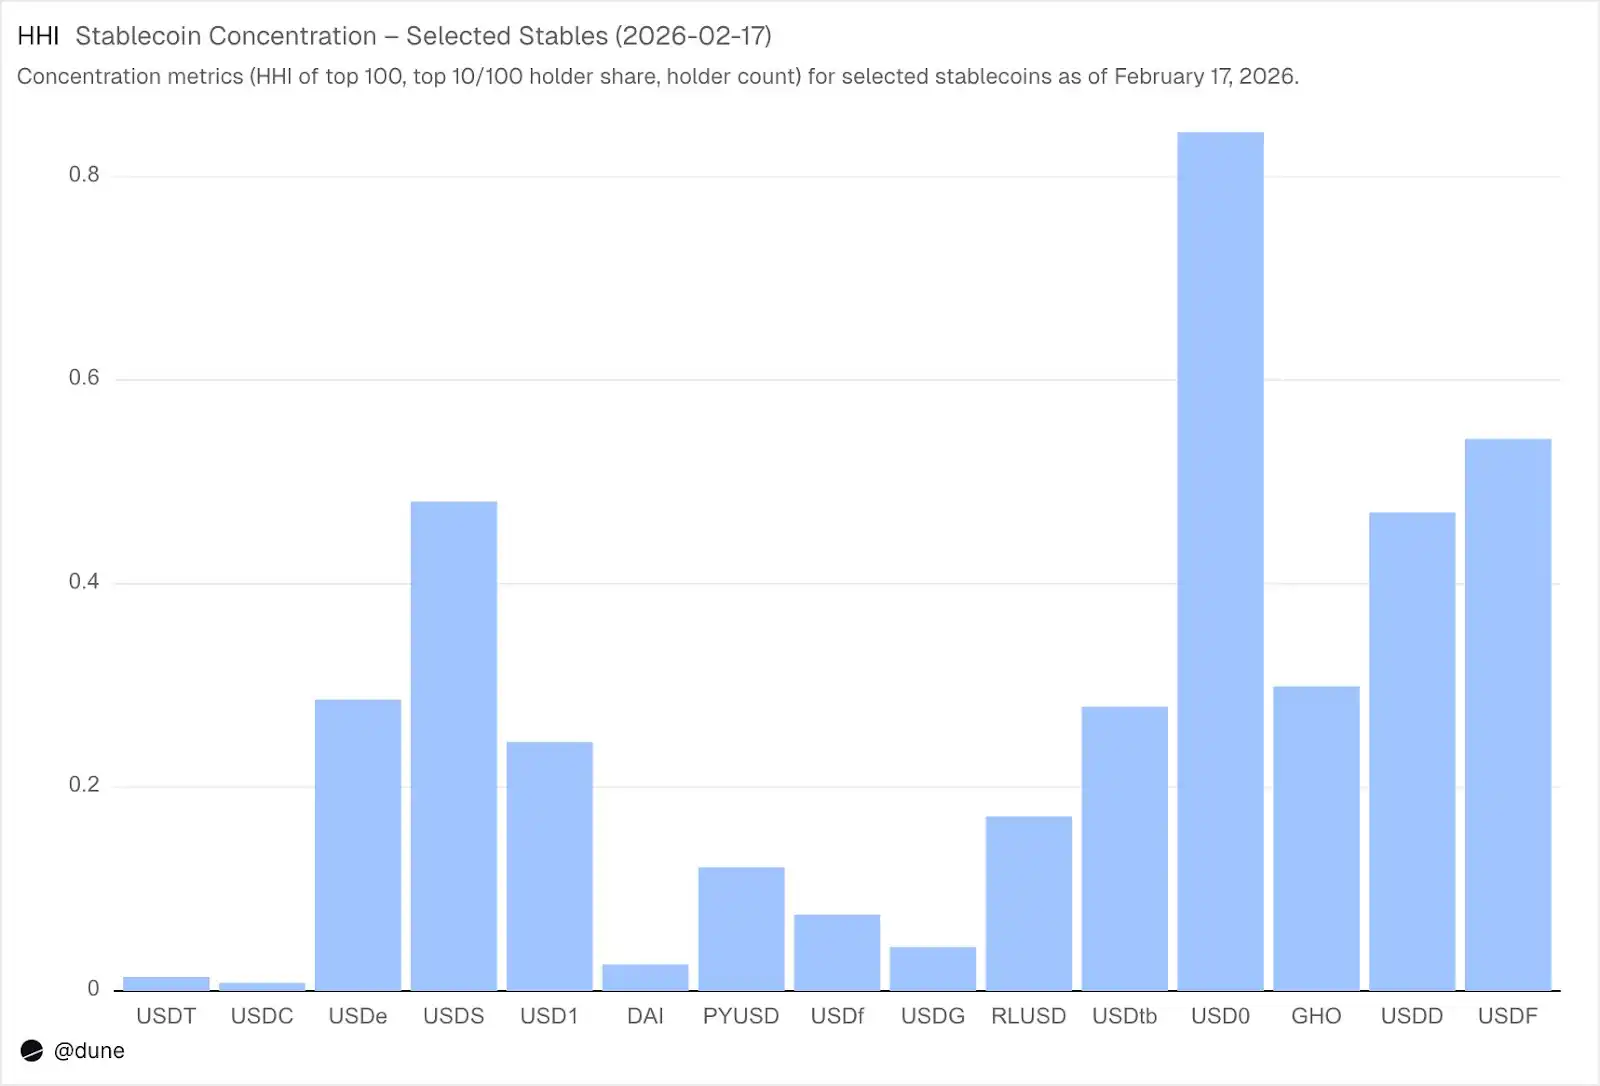
По состоянию на февраль 2026 года насчитывается 172 миллиона уникальных адресов, которые держат по крайней мере один из этих 15 стейблкоинов. Из них USDT — 136 миллионов, USDC — 36 миллионов, DAI — 4,7 миллиона. Распределение этих трех стейблкоинов очень широкое: их топ-10 кошельков держат только 23-26% объема предложения, HHI (Индекс Херфиндаля-Хиршмана, стандартный показатель экономической концентрации, где 0 означает полную децентрализацию, а 1,0 — одного держателя) ниже 0,03.
Источник: Dune
Однако с другими стейблкоинами ситуация совершенно иная. Топ-10 кошельков держат 60-99% объема предложения. USDS, несмотря на объем обращения в 6,9 миллиарда долларов, на 90% сконцентрирован в 10 кошельках (HHI 0,48); USDF на 99% сконцентрирован в топ-10 (HHI 0,54); USD0 самый экстремальный — 99% сконцентрирован в топ-10 (HHI 0,84), что означает, что даже среди этих крупных держателей предложение контролируется одним или двумя кошельками.
Источник: Dune
Это не означает, что с этими стейблкоинами что-то не так, некоторые из них новее, некоторые предназначены для институционального использования. Но это означает, что их данные об объеме предложения следует рассматривать иначе, чем данные USDT или USDC. Концентрация влияет на риск отвязки от курса, глубину ликвидности и на то, отражает ли объем предложения естественный спрос или спрос нескольких крупных участников. Такой анализ возможен только при наличии балансов всех держателей, а не только агрегированных данных о событиях выпуска/сжигания.
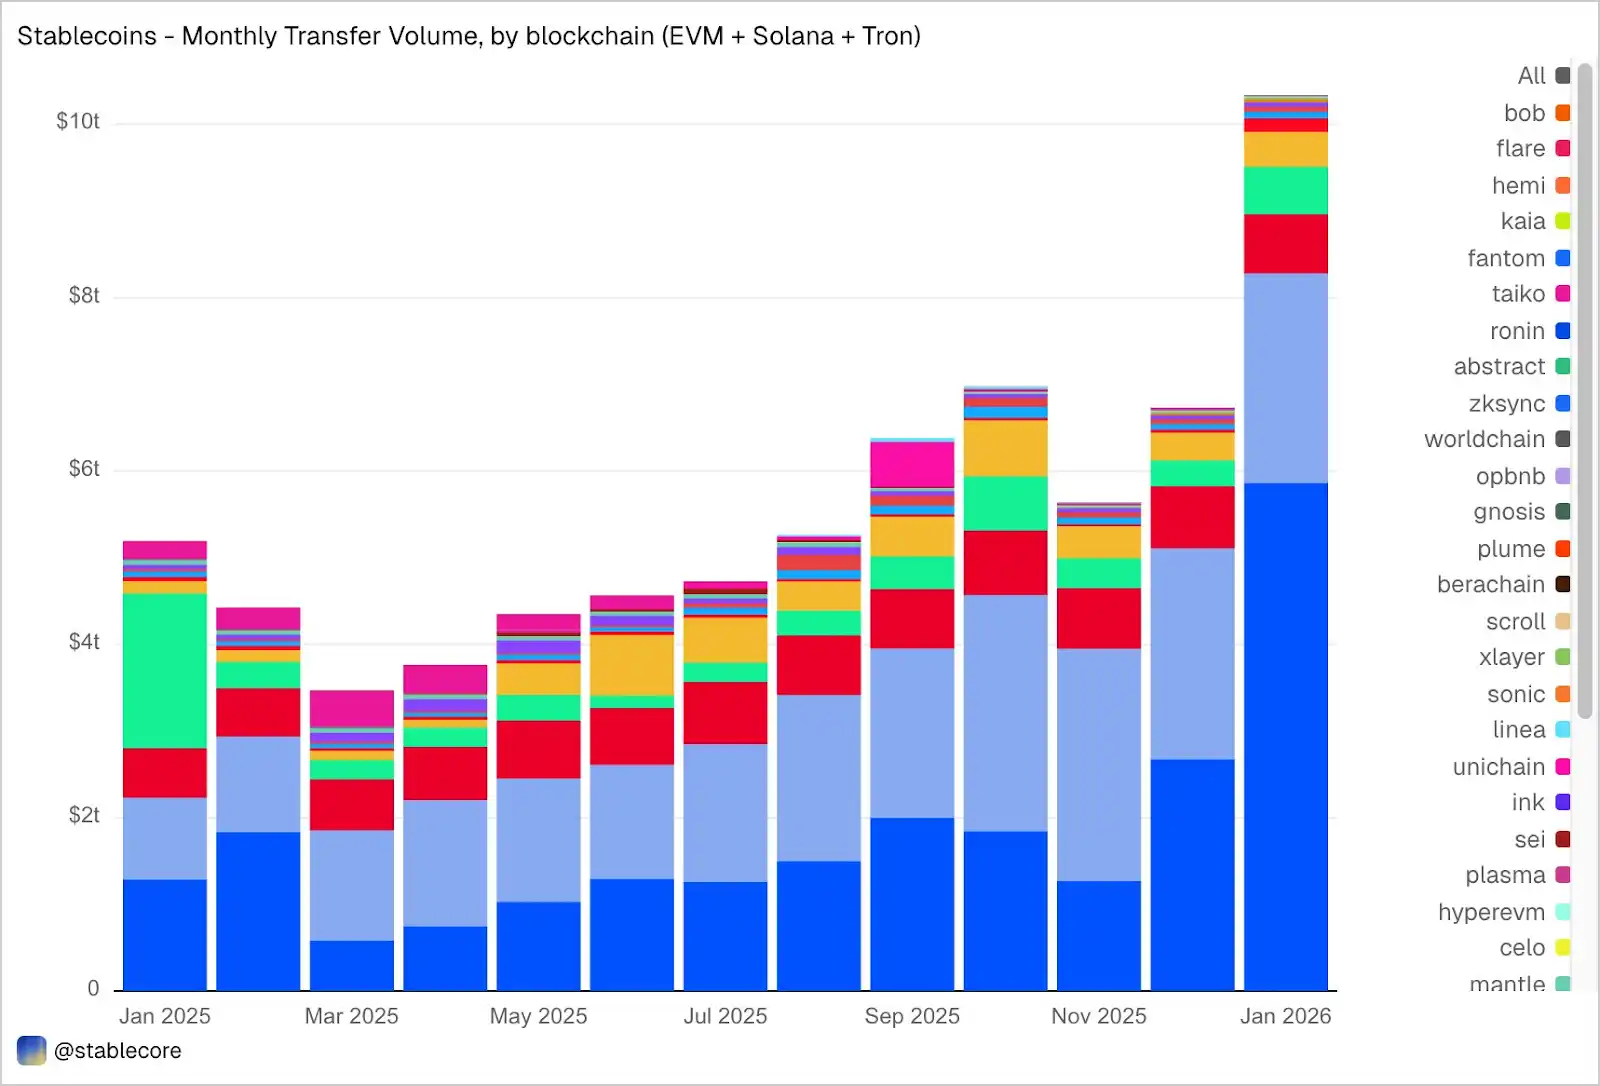
Объем переводов в январе достиг 10,3 триллиона долларов
Объем транзакций со стейблкоинами в EVM, Solana и Tron в январе достиг 10,3 триллиона долларов, что более чем в два раза превышает показатель января 2025 года. Распределение объема транзакций по блокчейнам показательно и сильно отличается от доли в предложении: Base с объемом предложения всего 4,4 миллиарда долларов лидирует с объемом транзакций 5,9 триллиона долларов; Ethereum — 2,4 триллиона долларов; Tron — 682 миллиарда долларов; Solana — 544 миллиарда долларов; BNB Chain — 406 миллиардов долларов.
Источник: Dune
По токенам доминирует USDC с 8,3 триллиона долларов, что почти в 5 раз больше, чем у USDT (1,7 триллиона долларов), несмотря на то, что его предложение в 2,7 раза меньше, чем у USDT. Скорость и частота переводов USDC явно намного выше, чем у USDT. Объем транзакций DAI составляет 138 миллиардов долларов, USDS — 92 миллиарда долларов, USD1 — 43 миллиарда долларов.
Важно, что эти данные объективны и нейтральны. Набор данных не предварительно фильтрует переводы на основе фиксированной интерпретации «реальной» экономической активности, поэтому общий объем может включать потоки, связанные с арбитражем, ботами, внутренней маршрутизацией или другой автоматизированной деятельностью. Наша цель — представить объективную полную картину активности в блокчейне, предоставив пользователям гибкость в применении своих собственных критериев фильтрации. Например, удаление объема транзакций, driven ботами, выделение естественного использования или определение более реалистичных мер транзакционной активности.
Что на самом деле делают стейблкоины?
Переводы в этом наборе данных не только помечены как «объем транзакций», но и классифицированы по конкретной активности в блокчейне:
Детализация за январь:
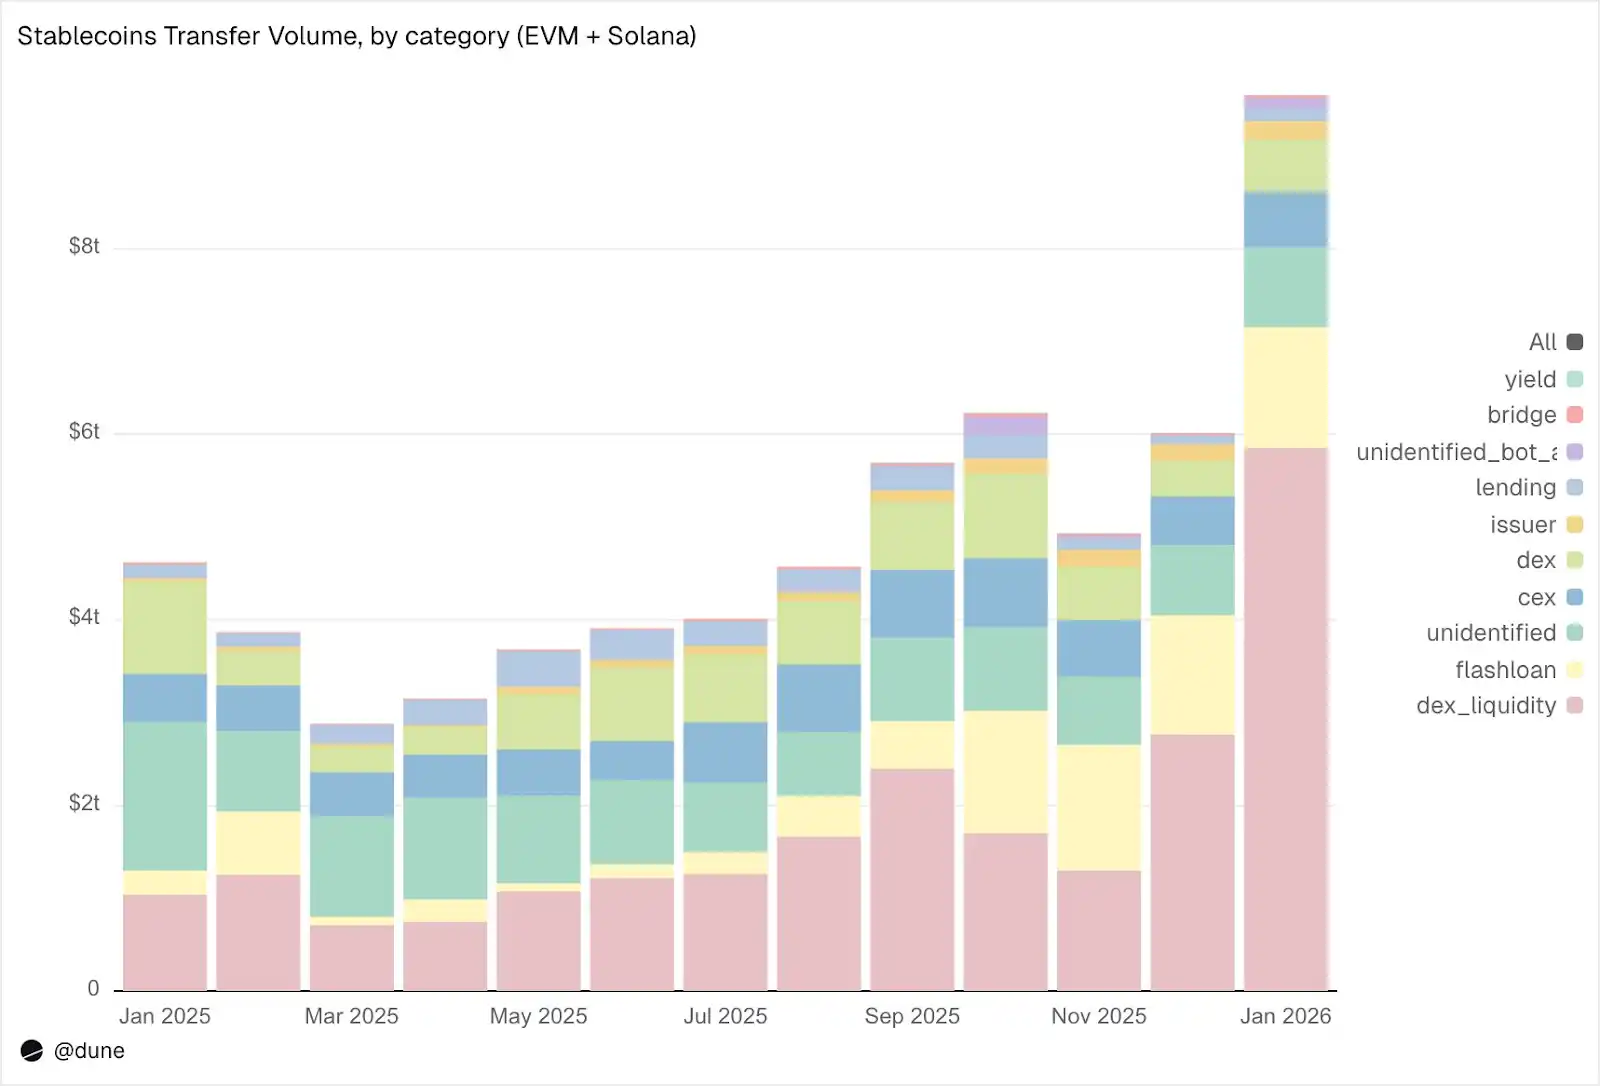
1. Рыночная инфраструктура (торговля на DEX и ликвидность):
Предоставление и изъятие ликвидности на DEX: 5,9 триллиона долларов. Это крупнейший вариант использования, отражающий роль стейблкоинов как базового актора для ончейн-маркетмейкинга.
Обмен на DEX (свопы): 376 миллиардов долларов. Прямая торговая активность через автоматизированные маркетмейкеры.
Вместе эти две категории данных показывают, что стейблкоины в основном функционируют как торговая обеспечение и инфраструктура ликвидности. Примечательно, что объем транзакций сосредоточен на активности, driven стимулами (такими как фарминг доходности и активная оптимизация капитала), а не на чистой торговой потребности.
2. Кредитное плечо и эффективность капитала (кредитование + флеш-кредиты)
Флеш-кредиты (заимствование и погашение): 1,3 триллиона долларов. Автоматизированные циклы арбитража и ликвидации.
Кредитная активность: предоставление, заимствование, погашение, снятие, 137 миллиардов долларов. Представляет собой краткосрочную эффективность капитала и структурированный кредит в ончейне.
3. Каналы доступа (CEX и мосты)
Потоки CEX: пополнение (224 миллиарда долларов), вывод (224 миллиарда долларов), внутренние переводы (151 миллиард долларов), итого 599 миллиардов долларов.
Пополнение и вывод через кросc-чейн мосты: 28 миллиардов долларов. Эти потоки указывают на важную роль стейблкоинов в расчетах между CEX и при кросc-чейн операциях.
4. Эмиссионный уровень (денежные операции)
Операции эмитентов: выпуск (28 миллиардов долларов), сжигание (20 миллиардов долларов), регулирование отвязки (23 миллиарда долларов), прочая активность, итого 106 миллиардов долларов. Почти в 5 раз больше, чем 42 миллиарда долларов за аналогичный период прошлого года.
5. Протоколы получения дохода
Активность в протоколах получения дохода: 2,7 миллиарда долларов. Это меньшая, но структурно важная часть, тесно связанная со структурированными стратегиями и ончейн-управлением активами.
В целом, 90% объема переводов проходят через идентифицированные категории активности, что позволяет детально понять, как стейблкоины перемещаются на каждом уровне ончейн-стека.
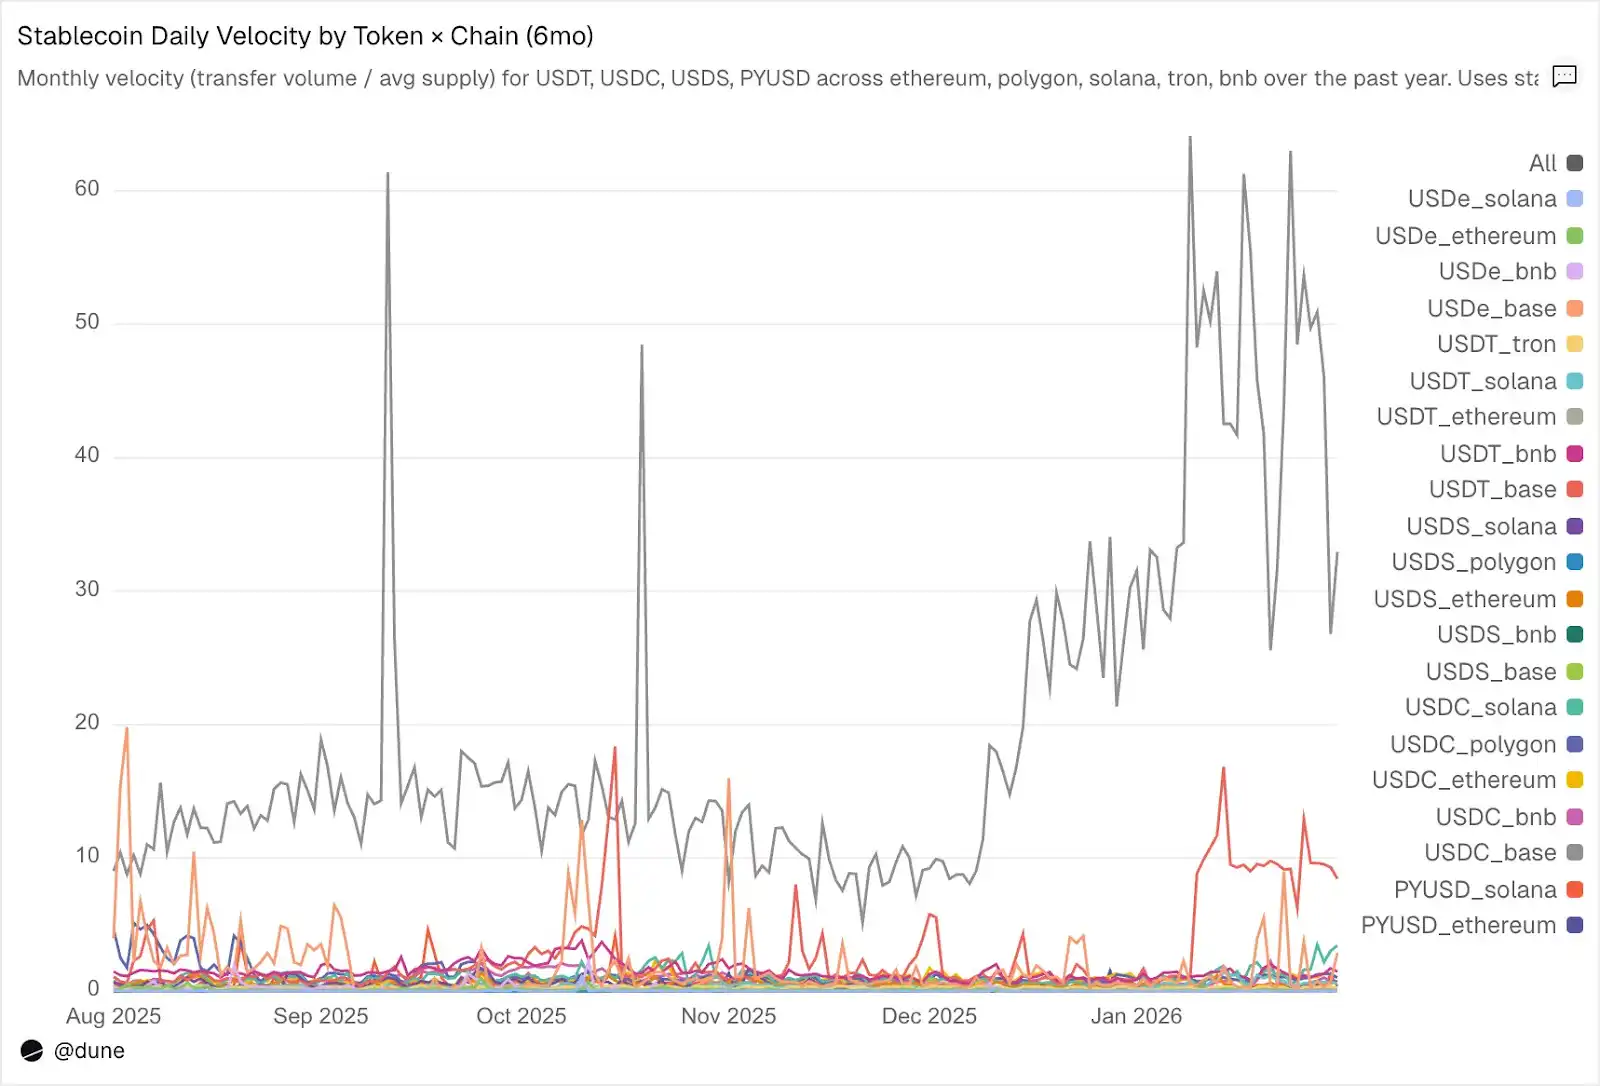
Скорость обращения: один токен, разные миры
Коэффициент ежедневного оборота (объем переводов, деленный на объем предложения), возможно, самый недооцененный показатель в анализе стейблкоинов. Он отражает, насколько активен стейблкоин как средство обмена, а не просто как актив для хранения.
Среди проанализированных нами токенов снова выделяются USDC и USDT, хотя между ними есть различия.
Источник: Dune
USDC на L2 и Solana имеет самую высокую скорость обращения. На Base ежедневная скорость обращения USDC достигает 14 раз, что в основном обусловлено высокочастотной торговой активностью в DeFi. На Solana и Polygon она составляет около 1 раза; на Ethereum также достигает 0,9 раза, то есть почти весь его объем предложения торгуется ежедневно.
USDT быстрее всего на BNB и Tron. Ежедневная скорость обращения на BNB Chain составляет 1,4 раза, что отражает его активную торговую деятельность; на Tron ежедневная скорость обращения составляет 0,3 раза, объем транзакций ниже, но необычно стабилен, что соответствует его роли основного канала для кросс-граничных платежей. А на Ethereum ежедневная скорость обращения USDT составляет всего 0,2 раза, и более 1000 миллиардов долларов предложения в основном находятся в бездействии.
USDe и USDS имеют более низкую скорость транзакций, и это сделано намеренно. Ежедневная скорость обращения USDe на Ethereum составляет всего 0,09 раза, а у USDS — 0,5 раза. Оба разработаны как стейблкоины для получения дохода: USDe обычно стейкуется в sUSDe для получения доходности от дельта-нейтральной стратегии Ethena; а USDS депозитируется в Sky Savings Rate для получения доходности, финансируемой протоколом. Таким образом, значительная часть предложения остается бездействующей в сберегательных контрактах, кредитных рынках, таких как Aave, или структурированных циклах получения дохода. Низкая скорость обращения — это не недостаток, а преимущество: эти активы предназначены для накопления дохода, а не для обращения.
Блокчейн важнее токена. Ежедневная скорость обращения PYUSD на Solana составляет 0,6 раза, что в четыре раза выше скорости обращения на Ethereum (0,1 раза). Один и тот же токен в разных экосистемах имеет совершенно разные модели использования.
Объем предложения и объем транзакций рассказывают лишь часть истории. Скорость обращения связывает их вместе, измеряя одним показателем, функционирует ли стейблкоин в конкретном блокчейне как активная инфраструктура или существует как бездействующий капитал.
За пределами доллара
Данный анализ был сосредоточен на 15 долларовых стейблкоинах, но полный набор данных охватывает больше. Он отслеживает более 200 стейблкоинов, представляющих более 20 валют: евро (17 токенов, объем предложения 990 миллионов долларов), бразильский реал (141 миллион долларов), иена (13 миллионов долларов), а также токены, номинированные в нигерийской найре, кенийском шиллинге, южноафриканском ранде, турецкой лире, индонезийской рупии, сингапурском долларе и других.
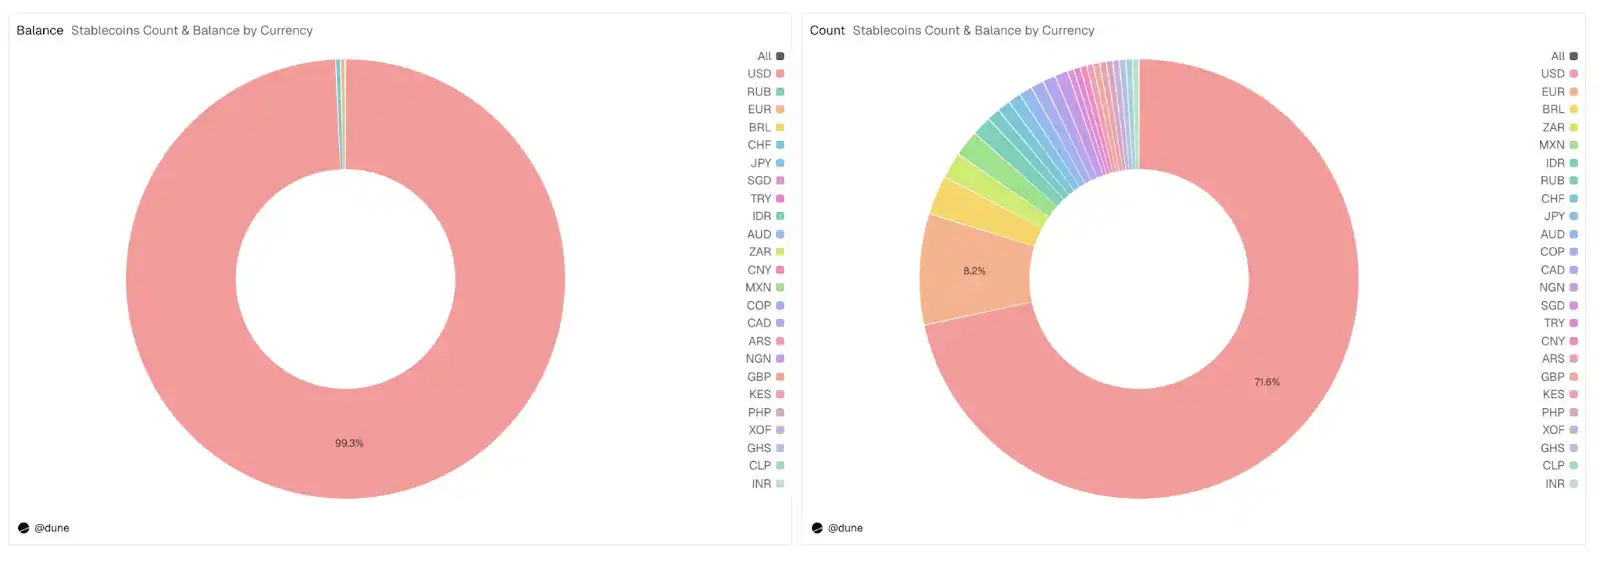
Источник: Dune
Объем предложения недолларовых стейблкоинов в настоящее время составляет всего 1,2 миллиарда долларов, но уже 59 токенов распространены по шести континентам, что составляет почти 30% от общего количества токенов в наборе данных. Инфраструктура для локальных стейблкоинов строится в ончейне, и данные для отслеживания их развития уже готовы.
Читайте по теме: Скрытая война behind стейблкоинов: кто станет «крупнейшим победителем» — эмитенты, приложения или пользователи?