BTC Thrice Rejected at $80,000 Threshold, HYPE Reaches New Highs Signaling Opportunity | Guest Analysis

marsbitОпубликовано 2026-05-26Обновлено 2026-05-26

Введение

**Bitcoin (BTC) Struggles at $80k; HYPE Reaches New Highs | Key Analysis & Strategy** Bitcoin faces continued resistance in the $78.5k - $79.5k zone after failing to sustain a break above its daily chart rising channel. It has retreated to the channel's midline. A failure to hold here could see a test of the $73.5k - $75k support area. The 4-hour chart shows a complex corrective structure. The strategy is neutral for mid-term positions. For short-term trading, two scenarios are outlined: **A)** Selling on a failed rally into the $78.5k-$79.5k resistance, and **B)** Selling on a confirmed breakdown below the $73.5k-$75k support, both with tight risk management. Meanwhile, **HYPE** has posted consecutive highs. The 4-hour chart indicates its current uptrend may be weakening near $65, with models showing potential bearish divergence. The view is that a short-term top could be forming. The strategy advises against chasing the rally and instead looking for a potential long entry on a pullback to the $47.5 - $50 support zone, provided clear reversal signals appear. Last week, a disciplined short BTC trade based on model signals yielded a 2.78% profit. The article emphasizes that all analysis is for informational purposes only and not investment advice, highlighting the importance of strict stop-loss discipline and dynamic position management in a volatile market. *(Note: The text references proprietary models like the "Price Difference Trading Model" and "Momentum Quantificatio...

Continuing our consistent structured analysis framework this week, we focus on two key assets, Bitcoin and HYPE, dissecting the current price action across multiple timeframes. We will examine the ongoing battle between bulls and bears at critical resistance and support zones and formulate specific, actionable operational plans accordingly.

Last week's short position successfully realized a gain of 2.78%, once again validating the trading logic of "signal-driven, disciplined execution." However, a single profitable trade never implies the market direction is definitively correct—the market always retains the potential to move beyond expectations.

The core variable for this week remains the struggle between the resistance zone of $78,500~$79,500 and the support zone of $73,500~$75,000. The outcome will be left for the market to decide.

Summary of This Week's Core Trading Views:

• Analysis of BTC's Multi-Timeframe Price Structure. (Detailed in Part 1)

• BTC Market Forecast and Medium-/Short-Term Trading Strategies for This Week. (Detailed in Part 2)

• Analysis of HYPE's Hourly Chart Price Structure. (Detailed in Part 3)

• HYPE Market Forecast and Short-Term Trading Strategy for This Week. (Detailed in Part 4)

Verification of Last Week's Trading Strategy and Core Views:

• BTC Short-Term Trade Performance: Bitcoin executed one short-term short trade last week (1x leverage), successfully achieving a return of approximately 2.78%. (Detailed in Table 1)

• Market Verification of BTC Trend Forecast: In last week's article, we stated: If the price effectively breaks below the support zone of $78,500~$79,500, it will test the support strength near $75,000. The current market movement has verified our previous forecast.

1. Analysis of Bitcoin's Multi-Timeframe Price Structure

1.1 BTC Daily Chart Structure Analysis

Bitcoin _ Daily Chart:
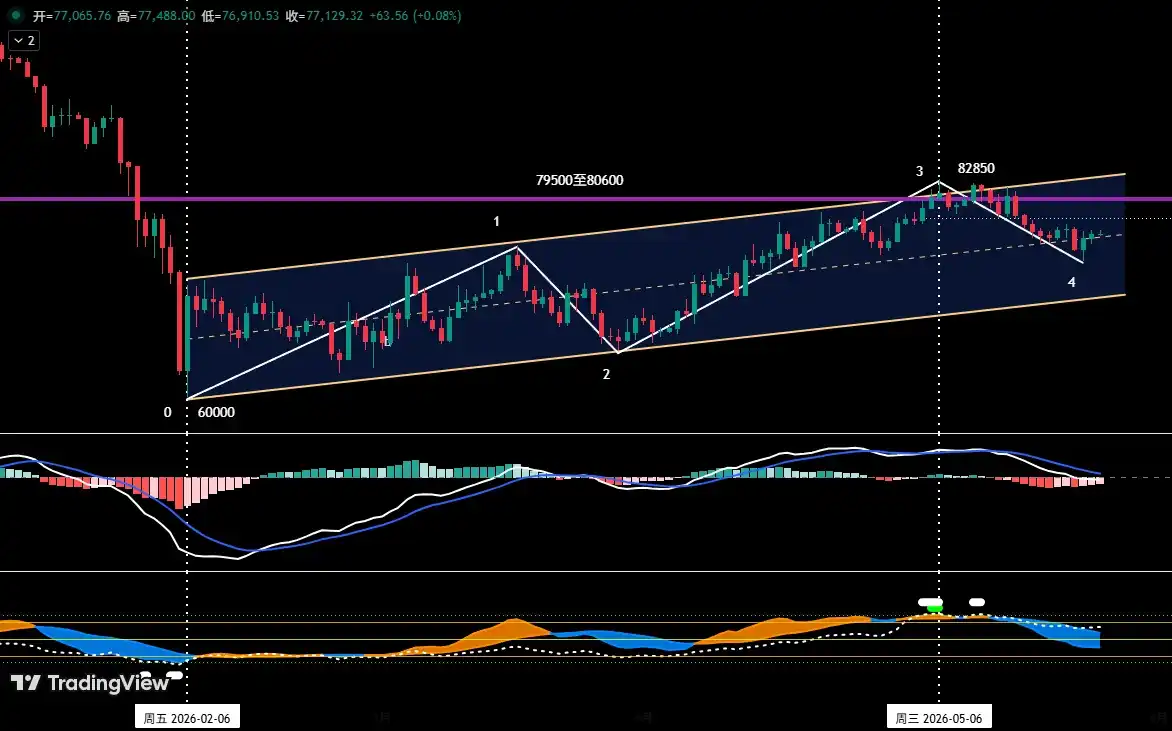
Figure 1

• As shown in (Figure 1), since establishing a significant low near $60,000 on February 6, 2026, Bitcoin's daily chart has constructed and maintained a clearly defined ascending channel: its lower boundary is formed by connecting the lows of February 6 and March 29, while the upper boundary is drawn parallel to the lower boundary through the high of March 17.

• In our weekly review on April 27, we pointed out: "The current price is facing dual resistance from the channel's upper boundary and the $79,500 to $80,600 resistance zone. A breakout is expected to be difficult." Subsequent market action validated this view. After nearly 20 days of struggle between bulls and bears, although a new rebound high of $82,850 was reached on May 6, the price failed to decisively break above this resistance area and subsequently began a corrective pullback.

From the current structure, the price has retraced from near the channel's upper boundary to the mid-channel area. If the price fails to find effective support near the mid-channel and resume its uptrend, the probability of it seeking support at the channel's lower boundary increases.

1.2 In-Depth Analysis of BTC's Hourly Chart Structure

Bitcoin _ 4-Hour Chart
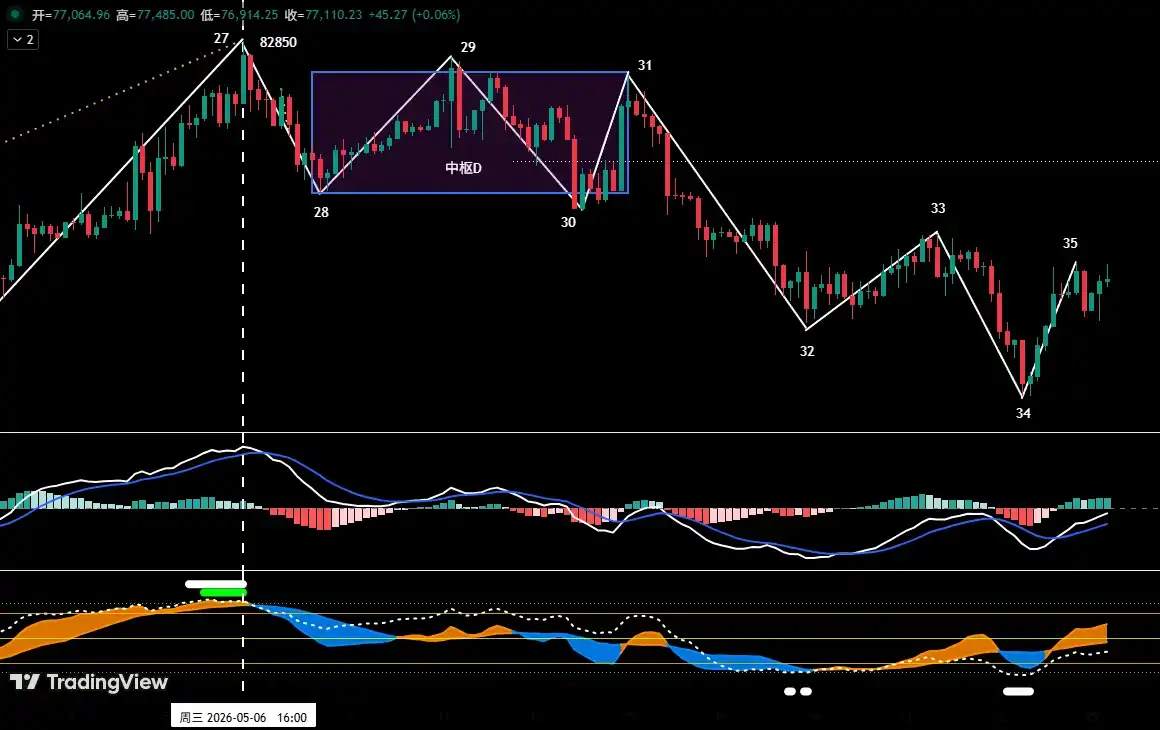
Figure 2

As shown in (Figure 2), from the high of $82,850 on May 6 to the present correction:

• The 4-hour chart shows it can be subdivided into an 8-segment corrective structure: "segment 27-28" to "segment 34-35". Center D: Segments 28-29, 29-30, and 30-31 overlap, constituting Center D.

• From the 4-hour price structure, segment 34-35 is about to rebound to the $78,500~$79,500 zone. If the rebound faces rejection upon reaching this area and fails to form a decisive breakout, the market is likely to continue its current corrective consolidation pattern and test the core support band of $73,500~$75,000 again.

2. Bitcoin Market Forecast and Trading Strategy for This Week

2.1 BTC Market Trend Forecast for This Week:

This week's core view: Focus on the outcome of the battle between bulls and bears over the $78,500~$79,500 resistance zone and the $73,500~$75,000 support zone.

2.2 Core Resistance Levels:

• Primary Resistance Zone: $78,500~$79,500 area (near the boundaries of two centers)

• Secondary Resistance Zone: $83,500~$84,500 area (previous high-volume trading congestion zone)

2.3 Core Support Levels:

• Primary Support Zone: $73,500~$75,000 area (previous significant support level)

• Secondary Support Zone: $69,500~$70,500 area (previous significant support level)

2.4 Trading Strategy for This Week (Excluding Impact of Sudden News)

1. Medium-Term Strategy:

Bitcoin _ Daily Chart: (Position Monitoring Model)
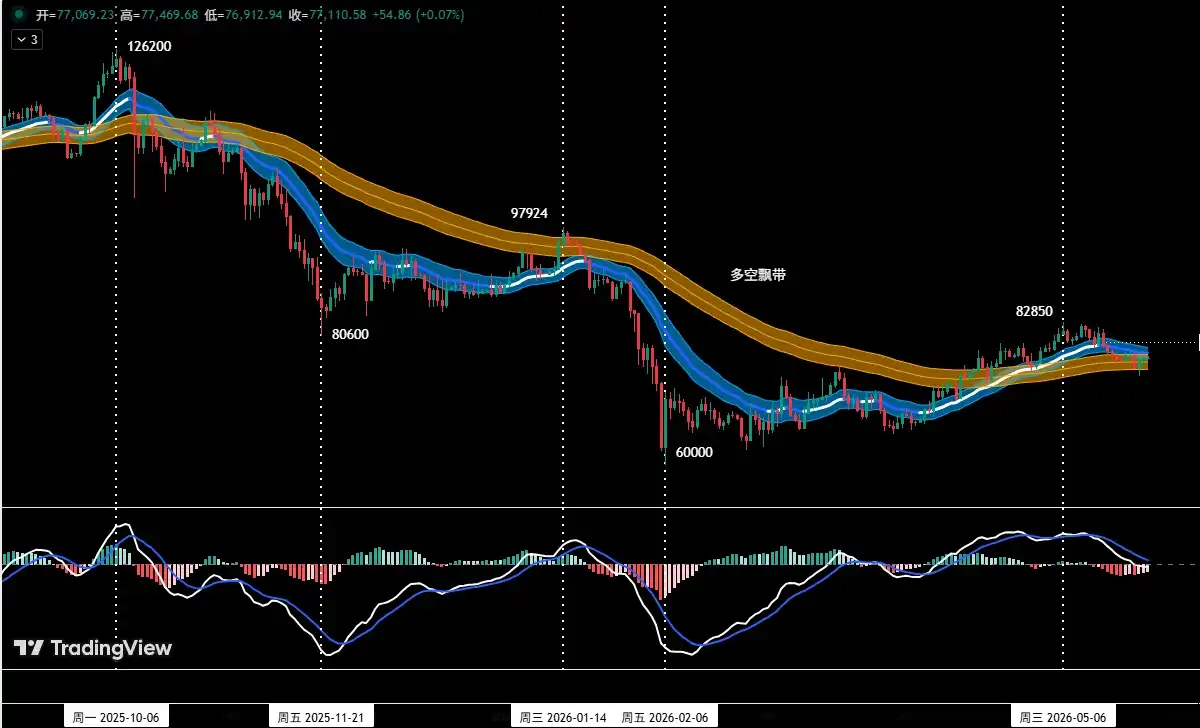
Figure 3

Position Monitoring Model: As shown in (Figure 3), based on trading rules, the medium-term market direction is not yet clear. Maintain a neutral/观望 stance for medium-term positions this week.

2. Short-Term Strategy: Utilize 30% of capital, set stop-losses, and look for "spread" trading opportunities based on support and resistance levels. (Using 30-minute/60-minute charts as the operational timeframe).

3. For short-term operations, to dynamically adapt to the market's complex evolution, we have pre-formulated two specific operational plans: A/B.

Plan A: Rebound Faces Resistance, Sell High.

• Entry: When the price rebounds to the $78,500~$79,500 zone and encounters resistance, combined with a top signal from the quantitative model, a short position of less than 30% can be established.

• Risk Control: Initial stop-loss set above $80,600.

• Exit: When the correction approaches important support levels combined with model signals, gradually close the position to take profits.

Plan B: Support Breached Effectively, Follow the Trend Short.

• Entry: When the price effectively breaks below the $73,500~$75,000 support zone combined with a model top signal, a short position of less than 30% can be established.

• Risk Control: Initial stop-loss set above $76,500.

• Exit: When the decline reaches important support levels combined with model signals, gradually close the position to take profits.

3. Analysis of HYPE's Price Structure

HYPE_4-Hour Chart
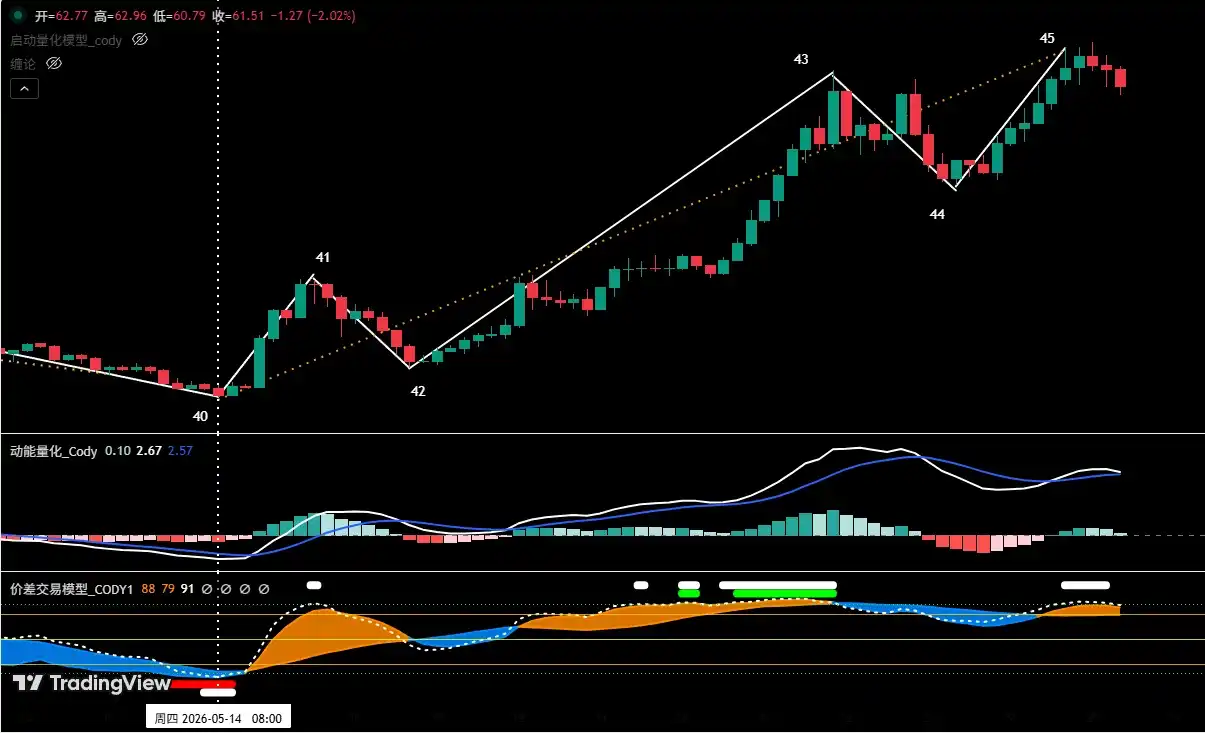
Figure 4

1. As shown in (Figure 4), the rally in HYPE from the low of $38.14 on May 14, on the 4-hour chart, can be divided into a five-segment structure: 40-41, 41-42, 42-43, 43-44, 44-45.

2. Our proprietary "Spread Trading Model" shows that near endpoint 45, a top warning signal (white dot) has been triggered.

3. From the perspective of the "Momentum Quantitative Model," the rising segment (44-45) near $65 has shown signs of waning upward momentum.

4. If a bearish momentum divergence forms at the "endpoint 45" position, overlapping with the top warning signal from the "Spread Trading Model," creating a共振 (resonance), the probability of the price forming a short-term high here increases significantly.

4. HYPE Market Forecast and Short-Term Trading Strategy for This Week

4.1 HYPE Market Trend Forecast for This Week:

This week's core HYPE view:

• Observe whether "endpoint 45" can form a short-term high since the rally began on May 14.

• If a short-term high forms, subsequently look for short-term long opportunities after the price pulls back to a key support area (e.g., $47.5 to $50) and shows clear signs of stabilization.

4.2 HYPE Short-Term Trading Strategy for This Week: (Buy on Support)

Currently, adhere to the strategy of "avoid盲目追涨 (blindly chasing rallies), buy on dips." If the price corrects to the $47.5 to $50 zone, finds support, and shows stabilization signals, combined with bottom signals triggered by both models, consider a light long position. Position size must be controlled below 30%, with strict stop-loss discipline.

5. Trade Review

5.1 Short-Term Trade Review:(See Table 1)

Strictly following the operational plan, based on trading signals from our proprietary "Spread Trading Model" and "Momentum Quantitative Model," we completed one short-term (short) trade last week, achieving a profit of 2.78%.

5.1 Bitcoin Short-Term Trade Details Summary: (Leverage*1x)
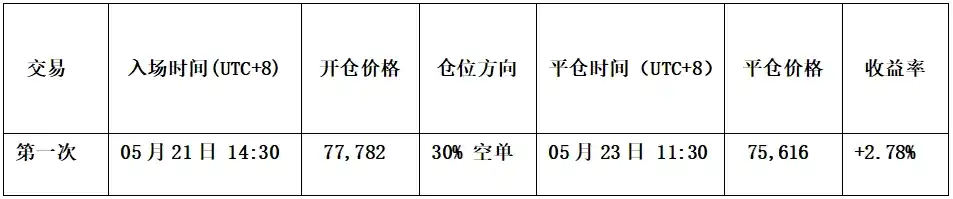
Table 1

5.2 Short-Term Trade Review: (See Figure 5)

• Entry Strategy:

a. When the price rebounded to near $78,500, encountered resistance, and showed bearish pressure signals, with the candlestick forming a "top reversal" bearish signal;

b. The "Spread Trading Model" triggered a top warning signal (white dot), and the "Momentum Quantitative Model" formed a bearish momentum divergence signal.

Therefore, we established a 30% short position at $77,782.

• Exit Strategy:

a. When the price fell to near $75,000 and found support, with the candlestick forming a "bottom reversal" signal;

b. The "Spread Trading Model" triggered a strong bottom warning signal (red dot + white dot), forming a bottom共振 (resonance) signal with the "Momentum Quantitative Model."

Therefore, we closed the entire position near $75,616.

• Summary: This trade successfully realized a profit of approximately 2.78%.

BTC_30 Minute Chart: (Momentum Quantitative Model + Spread Trading Model)
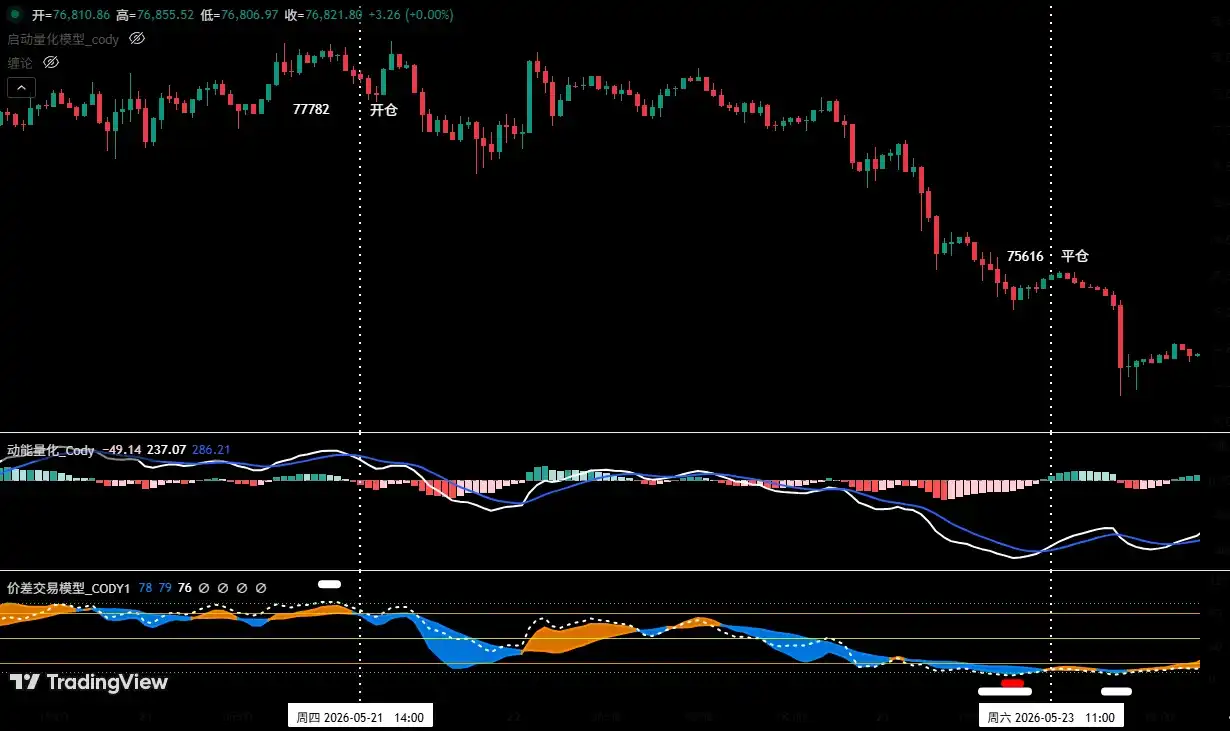
Figure 5 (Short-Term Trade Illustration)

6. Special Reminders:

1. Upon Entry: Immediately set the initial stop-loss.

2. When Profit Reaches 1%: Move the stop-loss to the entry price (breakeven point) to ensure principal safety.

3. When Profit Reaches 2%: Move the stop-loss to the 1% profit level.

4. Continuous Tracking: Thereafter, for every additional 1% profit, move the stop-loss up by 1%, dynamically protecting and locking in profits.

Financial markets are瞬息万变 (constantly changing). All market analysis and trading strategies require dynamic adjustment. All views, analytical models, and operational strategies mentioned in this article are derived from personal technical analysis, intended solely for personal trading journal purposes. They do not constitute any investment advice or operational basis. The market involves risks; invest with caution. Do not make decisions based solely on this content.


Трендовые криптовалюты

Связанные с этим вопросы

QWhat is the core resistance zone that Bitcoin (BTC) is struggling to break through according to the article?

AAccording to the article, Bitcoin (BTC) is struggling to break through the core resistance zone of $78,500 to $79,500. This area has acted as a key barrier, with BTC facing it three times already.

QWhat are the two specific short-term operation plans outlined for Bitcoin in the article?

AThe article outlines two short-term operation plans for Bitcoin (BTC): Plan A: 'Rebound meets resistance, sell high' - open a short position if the price rebounds to the $78,500-$79,500 resistance zone and shows signs of pressure. Plan B: 'Effectively breaks support, follow the trend to sell short' - open a short position if the price effectively breaks below the $73,500-$75,000 support zone.

QWhat is the key support area to watch for HYPE according to the analysis?

AThe key support area to watch for HYPE, as per the article, is the $47.5 to $50 region. The strategy suggests looking for short-term buying opportunities if the price falls back to this zone, shows signs of stabilization, and is accompanied by bottom signals from their trading models.

QWhat trading models does the article mention were used for the successful short-term BTC trade last week?

AThe article mentions that last week's successful short-term BTC trade was executed based on signals from two proprietary models: the 'Price Difference Trading Model' and the 'Dynamic Energy Quantification Model'.

QWhat is the overall stance for Bitcoin's medium-term strategy this week according to the 'Position Monitoring Model'?

AAccording to the 'Position Monitoring Model' shown in the article, the medium-term strategy for Bitcoin (BTC) this week is to maintain an empty position and adopt a wait-and-see approach, as the medium-term market direction is not yet clear.

Похожее

Альткоин был взломан, что привело к резкому падению его цены! Он также котируется на крупных биржах!

Стоимость токена NES резко упала на 40% из-за подозрительной активности в сети. Было обнаружено, что один кошелёк добыл токены NES на сумму около 55 млн долларов и начал их распродажу на децентрализованных биржах, создав давление на рынок. На этом адресе всё ещё остаются токены на сумму приблизительно 18 млн долларов, что указывает на возможность продолжения продаж. Команда NESA подтвердила, что была выявлена вредоносная активность, использовавшая уязвимость в сети первого уровня, исходящую от Cosmos EVM. Они работают над локализацией инцидента, внедрением исправлений и мерами по обеспечению безопасности сети перед возобновлением работы сервисов. Все криптобиржи были уведомлены о ситуации.

cryptonews.ru38 мин. назад

Альткоин был взломан, что привело к резкому падению его цены! Он также котируется на крупных биржах!

cryptonews.ru38 мин. назад

Deel и Mesh запустили безопасные выплаты зарплат в стейблкоинах

Компании Deel и Mesh объявили о партнерстве для организации безопасных международных выплат заработной платы в стейблкоинах. Deel, будучи глобальной HR-платформой, интегрируется с платежной инфраструктурой Mesh для цифровых активов. Это позволит упростить и обезопасить процесс расчетов с сотрудниками по всему миру, которые выбирают получение зарплаты в криптовалюте. Ключевым преимуществом интеграции является снижение рисков ошибок при переводе средств, таких как отправка на неверный адрес кошелька или через неподходящую блокчейн-сеть. Mesh обеспечивает проверку принадлежности счетов в более чем 300 криптокошельках и на биржах, что позволяет Deel осуществлять выплаты напрямую на подтвержденные счета без ручного ввода данных. Партнерство соответствует растущему спросу на выплаты в цифровых активах и является частью стратегии Mesh по развитию платежной инфраструктуры. Компания также анонсировала программу Mesh Alliance для совместимости корпоративных платежных систем, кошелек Mesh для операций со стейблкоинами с ИИ-агентами, а также сотрудничество с Paxos Global Dollar Network, AMINA Bank и Rain.

cryptonews.ru1 ч. назад

Deel и Mesh запустили безопасные выплаты зарплат в стейблкоинах

cryptonews.ru1 ч. назад

AIF и Digital Asset запустят пилотную программу RISE на Canton

Американский фонд идей (AIF) и компания Digital Asset объявили о партнерстве для запуска пилотной программы RISE (Ресурсы для независимости, стабильности и занятости) в ряде штатов США. Программа направлена на упрощение получения государственных пособий, объединяя различные виды социальной помощи в единую систему с гибкими выплатами, размер которых может автоматически корректироваться в зависимости от дохода семьи. Технологической основой проекта станет блокчейн-сеть Canton от Digital Asset, которая обеспечит инфраструктуру для операций, управления доступом, настройки условий и контроля распределения средств. Система также будет включать проверку личности, защиту от мошенничества и мобильный доступ. В ходе пилотных проектов будет оцениваться влияние RISE на ключевые показатели благосостояния семей, такие как занятость, доходы и стабильность жилья. Результаты позволят определить дальнейшие пути развития и масштабирования программы.

cryptonews.ru1 ч. назад

AIF и Digital Asset запустят пилотную программу RISE на Canton

cryptonews.ru1 ч. назад

PeaqOS и World ID внедряют доказательства ZK в автономных роботах

Интеграция PeaqOS и World ID позволяет автономным машинам, таким как роботы-доставщики и общие устройства, проверять, что они взаимодействуют с реальным уникальным человеком, не собирая личных данных. Система использует доказательства с нулевым разглашением (ZK): пользователь подтверждает свою человечность через World ID, а устройство через PeaqOS получает криптографическое доказательство этого факта, не раскрывая идентифицирующей информации. Это решает проблему проверки подлинности пользователей без PIN-кодов, паролей или документов. Например, при доставке лекарств пациент верифицируется через приложение, фармацевт подтверждает загрузку, а робот при выдаче удостоверяется, что получатель — тот же человек. Система также поддерживает проверку уникальности для правил вроде «один товар на человека». Интеграция уже доступна для устройств на PeaqOS через robotic.sh, позволяя роботам безопасно взаимодействовать с людьми при минимальном сборе данных.

cryptonews.ru1 ч. назад

PeaqOS и World ID внедряют доказательства ZK в автономных роботах

cryptonews.ru1 ч. назад

Bitmine 14 месяцев подряд сохраняет темп покупок эфира после его роста выше $2500 тыс.

Компания Bitmine Immersion Technologies продолжает свою стратегию накопления эфира (ETH) уже 14 месяцев подряд, начиная с июня 2025 года. На прошлой неделе она приобрела ещё 32 447 ETH, доведя общий объём своих активов до 5,85 млн ETH, что составляет около 4,8% от циркулирующего предложения Ethereum. Компания почти достигла своей цели — владеть 5% предложения ETH, и около 87% своих активов (5,07 млн ETH) разместила в стейкинге. Покупки Bitmine совпали с резким ростом рынка, вызванным заявлением Министерства финансов США об увеличении ежемесячных закупок долгосрочных казначейских облигаций. С момента этого объявления цена ETH выросла более чем на 32%, превысив уровень в $2 500 впервые с января. Это восстановление существенно сократило нереализованные убытки компании от более ранних покупок во время спада — с более чем $8,4 млрд до менее чем $5 млрд. Акции Bitmine на NYSE выросли примерно на 8,7% в начале недели.

cryptonews.ru1 ч. назад

Bitmine 14 месяцев подряд сохраняет темп покупок эфира после его роста выше $2500 тыс.

cryptonews.ru1 ч. назад

Торговля

Спот

Популярные статьи

Как купить HYPE

Добро пожаловать на HTX.com! Мы сделали приобретение Hyperliquid (HYPE) простым и удобным. Следуйте нашему пошаговому руководству и отправляйтесь в свое крипто-путешествие.Шаг 1: Создайте аккаунт на HTXИспользуйте свой адрес электронной почты или номер телефона, чтобы зарегистрироваться и бесплатно создать аккаунт на HTX. Пройдите удобную регистрацию и откройте для себя весь функционал.Создать аккаунтШаг 2: Перейдите в Купить криптовалюту и выберите свой способ оплатыКредитная/Дебетовая Карта: Используйте свою карту Visa или Mastercard для мгновенной покупки Hyperliquid (HYPE).Баланс: Используйте средства с баланса вашего аккаунта HTX для простой торговли.Третьи Лица: Мы добавили популярные способы оплаты, такие как Google Pay и Apple Pay, для повышения удобства.P2P: Торгуйте напрямую с другими пользователями на HTX.Внебиржевая Торговля (OTC): Мы предлагаем индивидуальные услуги и конкурентоспособные обменные курсы для трейдеров.Шаг 3: Хранение Hyperliquid (HYPE)После приобретения вами Hyperliquid (HYPE) храните их в своем аккаунте на HTX. В качестве альтернативы вы можете отправить их куда-либо с помощью перевода в блокчейне или использовать для торговли с другими криптовалютами.Шаг 4: Торговля Hyperliquid (HYPE)С легкостью торгуйте Hyperliquid (HYPE) на спотовом рынке HTX. Просто зайдите в свой аккаунт, выберите торговую пару, совершайте сделки и следите за ними в режиме реального времени. Мы предлагаем удобный интерфейс как для начинающих, так и для опытных трейдеров.

820 просмотров всегоОпубликовано 2024.12.11Обновлено 2026.06.02

Как купить HYPE

Обсуждения

Добро пожаловать в Сообщество HTX. Здесь вы сможете быть в курсе последних новостей о развитии платформы и получить доступ к профессиональной аналитической информации о рынке. Мнения пользователей о цене на HYPE (HYPE) представлены ниже.

活动图片