Кризис в Западной Азии привел к росту цен на нефть и опасениям усиления инфляции. Это означало, что институциональные трейдеры хеджировались от дальнейшего снижения, что видно по возросшему спросу на пут-опционы (медвежьи ставки).
Дальнейшее снижение было возможным. Краткосрочные держатели стремились защитить свою прибыль или попытаться выйти с рынка в безубыток, ограничивая потенциал любого роста.
Тем не менее, ценовое действие на старших таймфреймах находилось в интересном месте, где отскок цены нельзя было полностью исключить.
Объяснение ожиданий тренда Биткоина
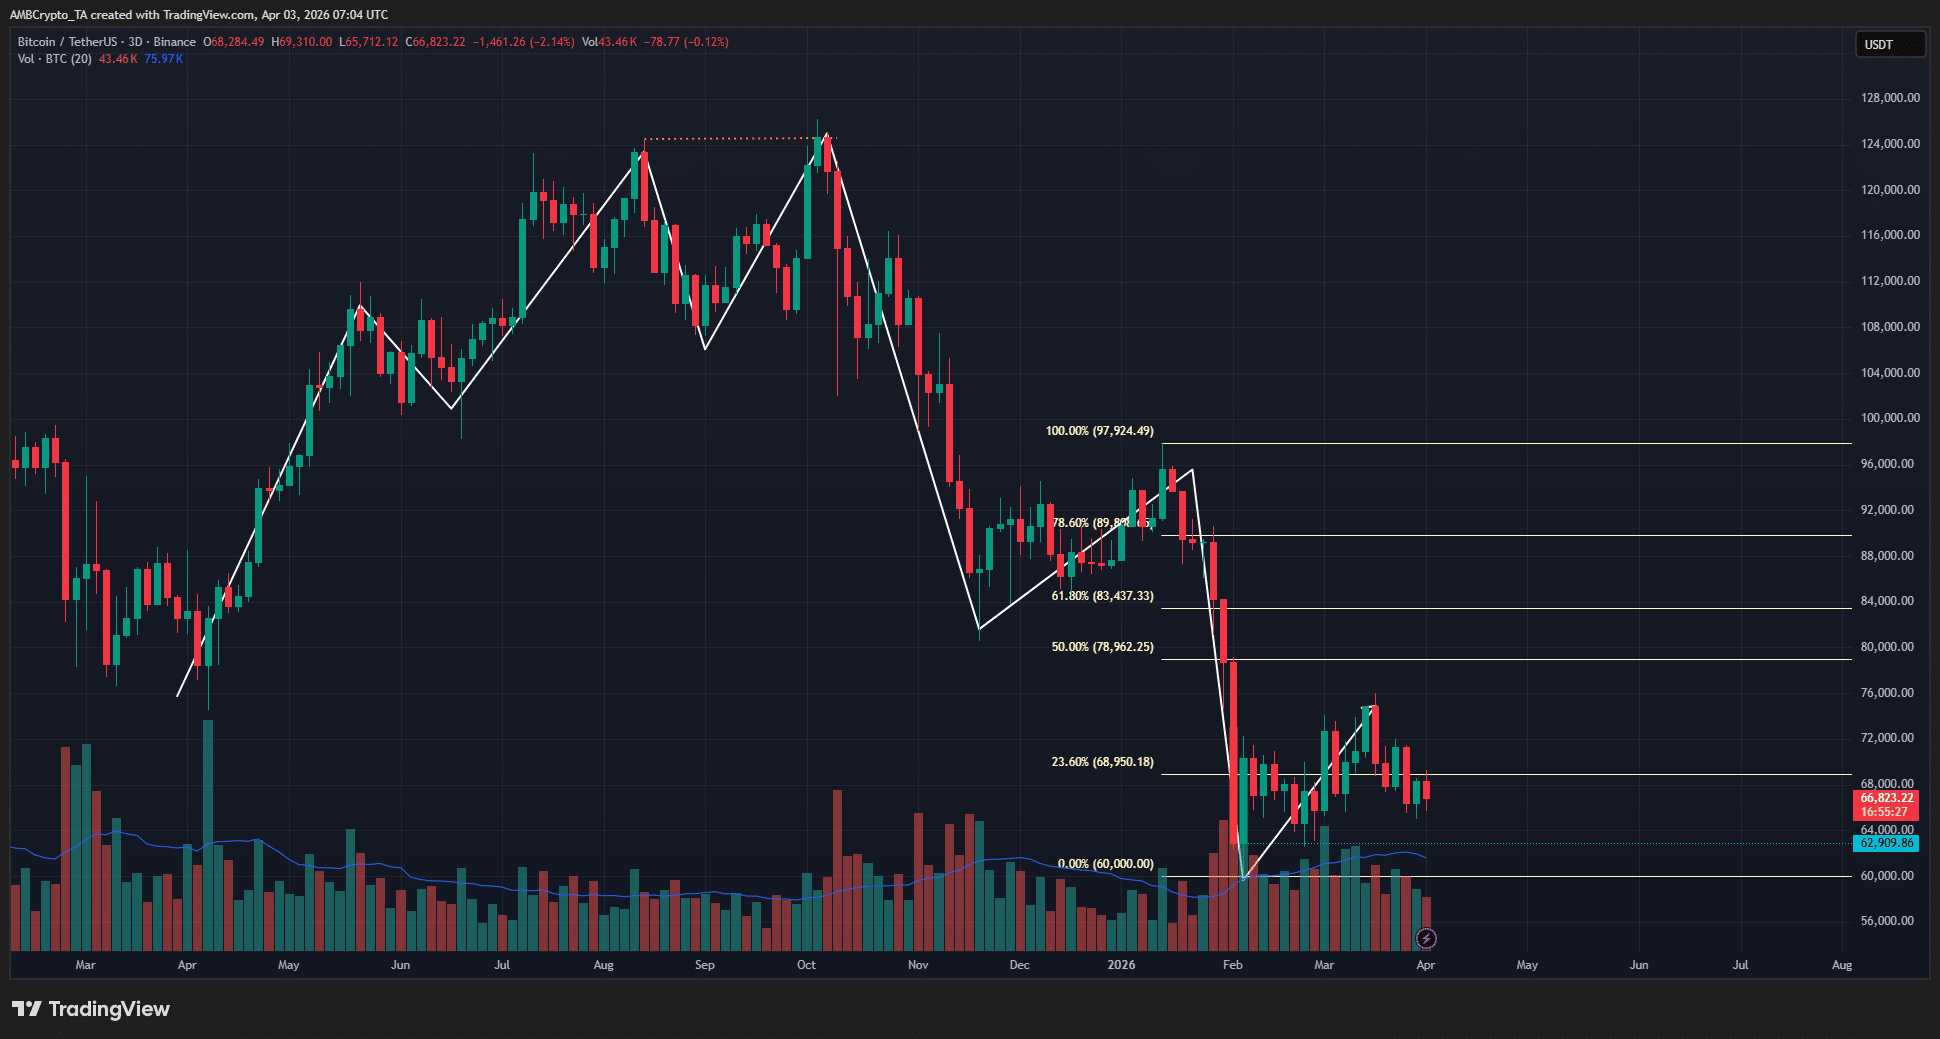

Свинг-движения на 3-дневном таймфрейме выделены белым. Последний отскок на фоне нисходящего тренда произошел в феврале и был незавершенным. Есть причина, по которой он считается незавершенным.
В октябре 2025 года, когда свинг-структура была бычьей, Биткоин сформировал двойную вершину на отметке $124,4 тыс. Эта неспособность продолжить восходящий тренд была ранним признаком слабости быков.
Впоследствии свинг-структура сменилась на медвежью после пробития минимума $107,2 тыс. в начале ноября.
Рассмотрим ценовое действие с февраля. Свинговый минимум на $60 тыс. привел к отскоку, который не поднялся выше уровня 50% отката.
Многие аналитики считают область выше 50% отката «премиальной», и движение в эту область с большей вероятностью приведет к следующему медвежьему свинговому движению.
Порог находился на уровне $78,9 тыс., а последний отскок достиг только $76 тыс. После этого отскока Биткоин еще не опустился ниже свингового минимума в $60 тыс.
Ожидания следующего движения Биткоина

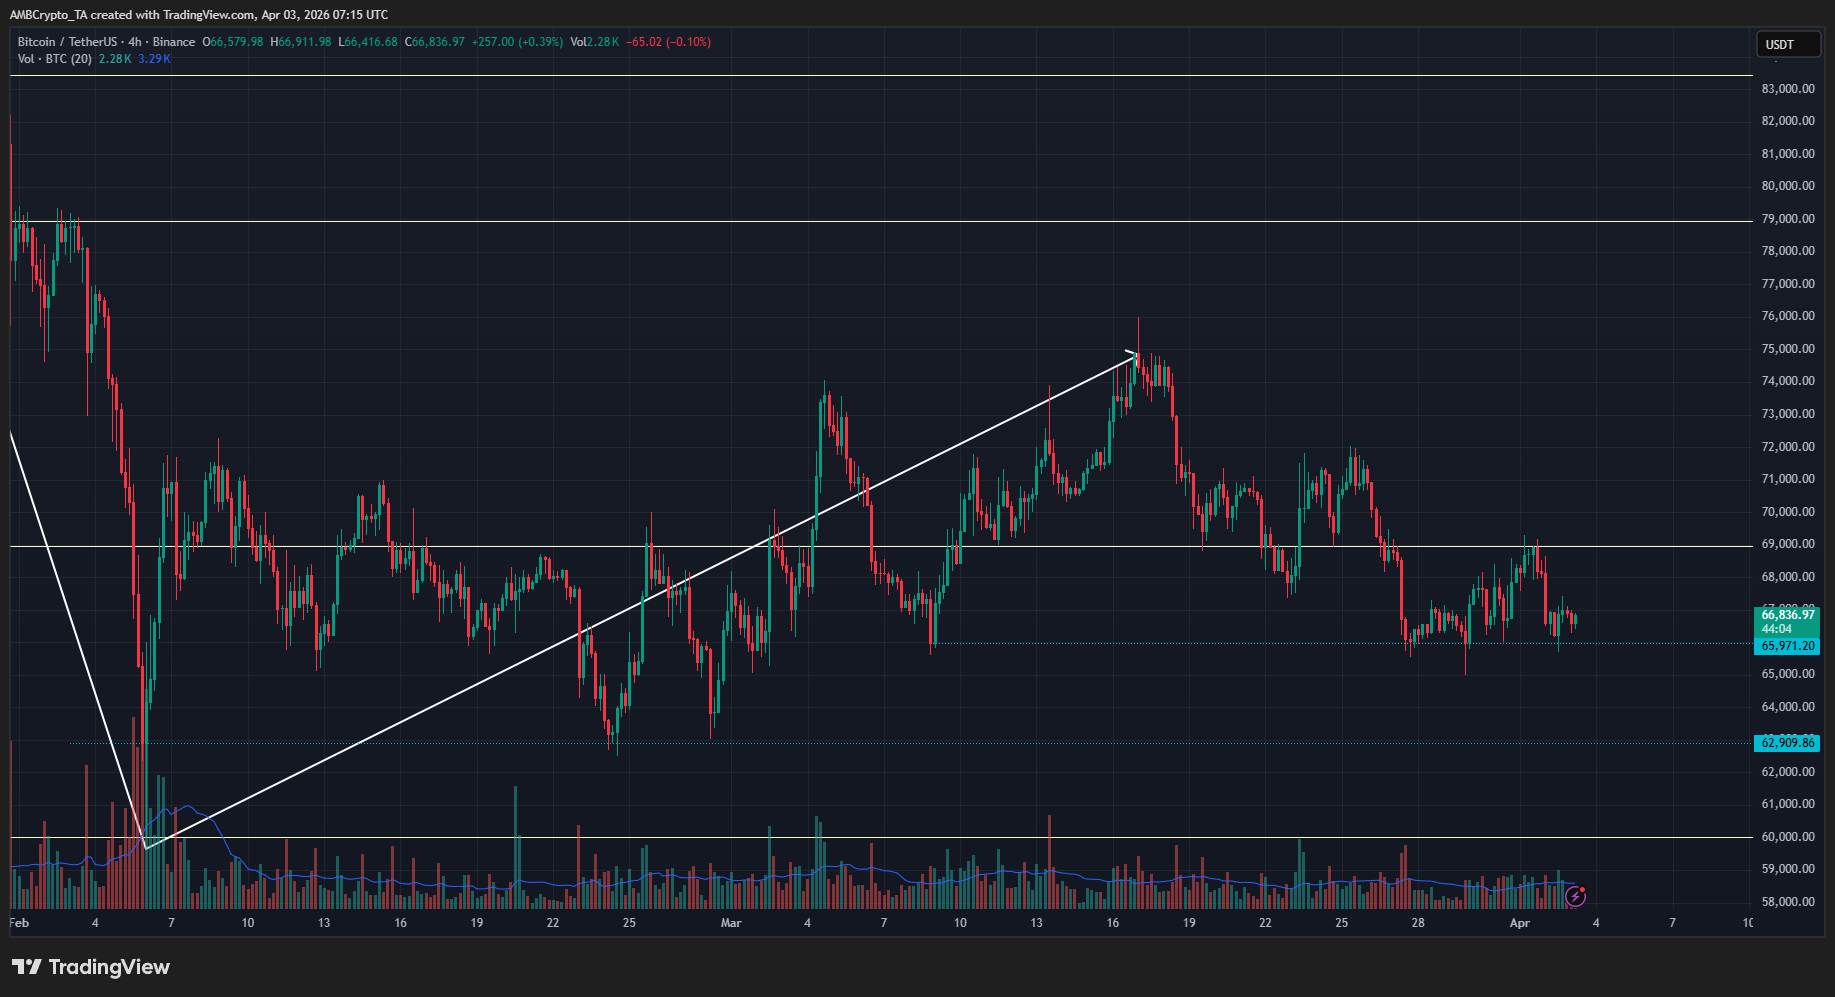
Как и двойная вершина в октябре 2025 года, неспособность Биткоина установить новые минимумы в последние недели была интригующим развитием событий. Рассмотрим уровни $65,9 тыс. и $62,9 тыс. (пунктирные голубые линии).
Свинг-структура на 4-часовом таймфрейме была бычьей, но цена находилась near свинговым минимумам $65,9 тыс. Для разворота ожиданий на 4-часовом таймфрейме в медвежью сторону требуется закрытие сессии ниже $65 618.
Аналогично, для того чтобы показать, что долгосрочный нисходящий тренд продолжится, требуется закрытие 3-дневной сессии ниже $60 тыс.
Пока этого не произошло, ожидание отскока цены Биткоина в премиальную ценовую область выше $78,9 тыс. остается valid. В нынешних условиях рынок ждет катализатора для следующего движения.
Итоговый вывод
- Трехдневные и 4-часовые ценовые графики Биткоина дали некоторые контринтуитивные бычьи ожидания относительно структуры младшего таймфрейма.
- Важность свингового минимума на уровне $65,9 тыс. и его защита в течение последней недели означает, что медведи не полностью контролировали краткосрочный тренд.


