Odaily приглашенный аналитик рынка Conaldo, магистр финансовой статистики Колумбийского университета (США), со времен учебы в университете специализируется на количественной торговле акциями США и постепенно расширил свою деятельность до цифровых активов, таких как биткоин. На практике он разработал систематическую модель количественной торговли и систему управления рисками; обладает острым пониманием данных рыночной волатильности и стремится к постоянному углублению в профессиональную торговлю,追求稳健回报; будет еженедельно глубоко анализировать технические, макроэкономические и денежные аспекты BTC, проводить разборы и демонстрировать практические стратегии, а также предсказывать важные события на ближайшее время для справки.

Ключевые моменты торгового недельного отчета:
- Проверка эффективности выполнения стратегии (краткосрочной): На прошлой неделе торговля строго следовала установленной стратегии, успешно завершены две операции, совокупная доходность составила 3,62%.
- Подтверждение ключевой точки зрения (краткосрочной): Наша ключевая точка зрения, высказанная на прошлой неделе, о том, что «рынок будет демонстрировать широкий диапазонный флэт», полностью подтвердилась рыночной динамикой. Определенные ключевые зоны наблюдения 89 500~91 000 долларов и зона поддержки ниже 86 500~87 500 долларов неоднократно тестировались рынком. Особенно важно, что на прошлой неделе цена достигла максимума в 90 598 долларов, что всего на 402 доллара меньше верхней границы нашей ключевой зоны (91 000 долларов); минимум в середине недели (86 400 долларов) всего на 100 долларов отличался от нижней границы зоны поддержки (86 500 долларов), точность прогноза точек была полностью подтверждена рынком.
- С макротехнической точки зрения, с момента достижения исторического максимума в 126 200 долларов 6 октября коррекция биткоина длится уже 82 дня, в течение которых максимальное падение составило около 36%, подтвердив среднесрочный медвежий тренд. Однако, согласно наблюдениям за多项技术指标, в настоящее время мы находимся в зоне низких значений, и время и пространство коррекции постепенно приближаются к историческим условиям перепроданности. С 22 ноября цена продолжает консолидироваться в диапазоне на низких уровнях, что свидетельствует об относительном балансе сил быков и медведей и накоплении импульса для направленного пробоя. Несмотря на то, что в настоящее время на рынке все чаще раздаются призывы к росту, мы считаем, что при исключении вмешательства внезапных новостей последующее движение все еще имеет одну ключевую возможность:Если рынком управляют основные средства, то для медведей более оптимальной стратегией может быть сначала пробить вниз, пробив ключевой психологический уровень в 80 000 долларов, используя панические настроения для очистки оставшихся длинных позиций, тем самым завершив последнее формирование дна. После этого средства могут顺势 осуществить «разворот из медвежьего в бычий», быстро подняв цену из зоны成本区, а затем запустив волну восстановления с относительно сильным техническим отскоком.Важно подчеркнуть, что вышеупомянутое движение является лишь одним из сценариев, основанных на логике рыночного поведения, а не неизбежным путем. Независимо от того, как развивается ситуация, следует помнить: «Рынок всегда прав.» До выбора направления сохранение наблюдения и гибкое реагирование остаются ключевыми на текущем этапе.
一、Обзор торговых результатов за прошлую неделю: (22.12~28.12)
1、Разбор краткосрочных сделок (без плеча):
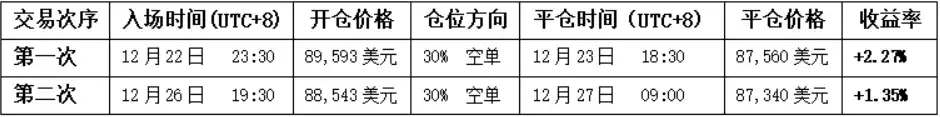
• Первая сделка (прибыль 2,27%): На основе модели «короткая продажа при встрече сопротивления в ключевой зоне давления при отскоке». Когда цена достигла зоны89 500~91 000долларов и встретила сопротивление, одновременно модель торговли по спреду также подала сигнал вершины, была открыта короткая позиция объемом 30%, которая в конечном итоге была закрыта с прибылью, когда цена опустилась near зоны поддержки.
• Вторая сделка (прибыль 1,35%): Логика этой сделки аналогична. Когда цена снова достигла зоны89 500~91 000долларов и встретила сопротивление, два模型 подали резонансные сигналы, успешно завершив сделку.
2、Обзор прогноза движения и торговой стратегии на прошлой неделе:
В前瞻分析 на прошлой неделе четко указывалось: Ожидается, что рынок в основном будет демонстрироватьширокий диапазонный флэт. Ключевой зон наблюдения -89 500~91 000долларов, результаты борьбы в этой зоне определят краткосрочное направление. Ниже приведен разбор и анализ стратегии.
1、Обзор прогноза движения:
• Ключевые уровни сопротивления: Первое сопротивление в зоне89 500~91 000долларов; второе сопротивление в зоне93 000~94 500долларов.
• Ключевые уровни поддержки: Первая поддержка в зоне86 500~87 500долларов; вторая поддержка в зоне83 500~84 500долларов.
2、Обзор торговой стратегии:
• Среднесрочная стратегия: Поддержание среднесрочной позиции (шорт) около65%.
• Краткосрочная стратегия: На прошлой неделе мы предварительно разработали два краткосрочных плана действийA/B. Учитывая фактическое движение рынка, мы в конечном итоге принялиплан Bв качестве основной стратегии и выполнили его.
(План B:Проверка отскоком, ключевая зона89 500~91 000долларов была эффективно пробита вниз)
• Открытие позиции: При появлении сигналов сопротивления в процессе проверки отскоком можно открыть короткую позицию объемом30%.
• Управление рисками: Стоп-лосс установлен выше 92 000 долларов.
• Закрытие позиции: При опускании цены до зоны83 500~84 500долларов и появлении признаков сопротивления考虑 частично или полностью закрыть позицию, зафиксировав прибыль.
二、Технический анализ: оценка среднесрочного тренда биткоина
Объединяя рыночные движения прошлой недели, я проведу углубленный анализ эволюции внутренней структуры и тренда биткоина с использованием многомерных аналитических моделей.
Недельный график BTC: (Модель量化 импульса + Модель量化 настроений)
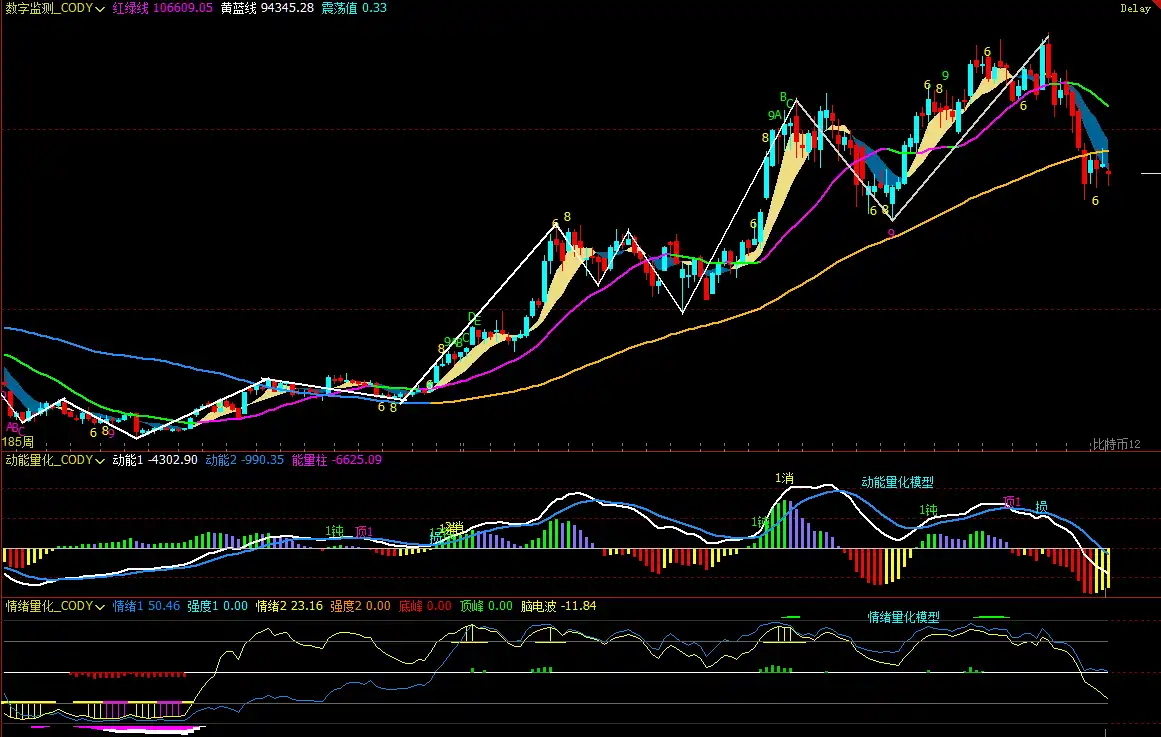
Рисунок 2
1、Как показано на (Рисунке 2), анализ недельного графика:
• Модель量化 импульса:После коррекции на прошлой неделе две линии индикатора импульса все еще работают ниже нулевой оси, отрицательные столбцы импульса постепенно сокращаются, что указывает на то, что хотя недельный график уже находится на медвежьем рынке, медвежий импульс еще не полностью высвобожден.
Модель量化 импульса предсказывает:Индекс падения цены: Высокий
• Модель量化 настроений:Значение синей линии настроений 49.74, интенсивность ноль; значение желтой линии настроений 19.99 (близко к нижнему порогу), интенсивность ноль, пиковое значение 0.
Модель量化 настроений предсказывает:Индекс давления и поддержки цены: Нейтральный
• Модель数字 мониторинга: Цена跌破 линию раздела быков и медведей (желто-синяя линия) в течение 6 недель; цифровые сигналы краткосрочного дна (9 и выше) еще не появились.
Вышеуказанные данные预示:На недельном графике биткоина установился медвежий тренд, необходимо警惕 последующего высвобождения медвежьих сил.
Дневной график BTC:
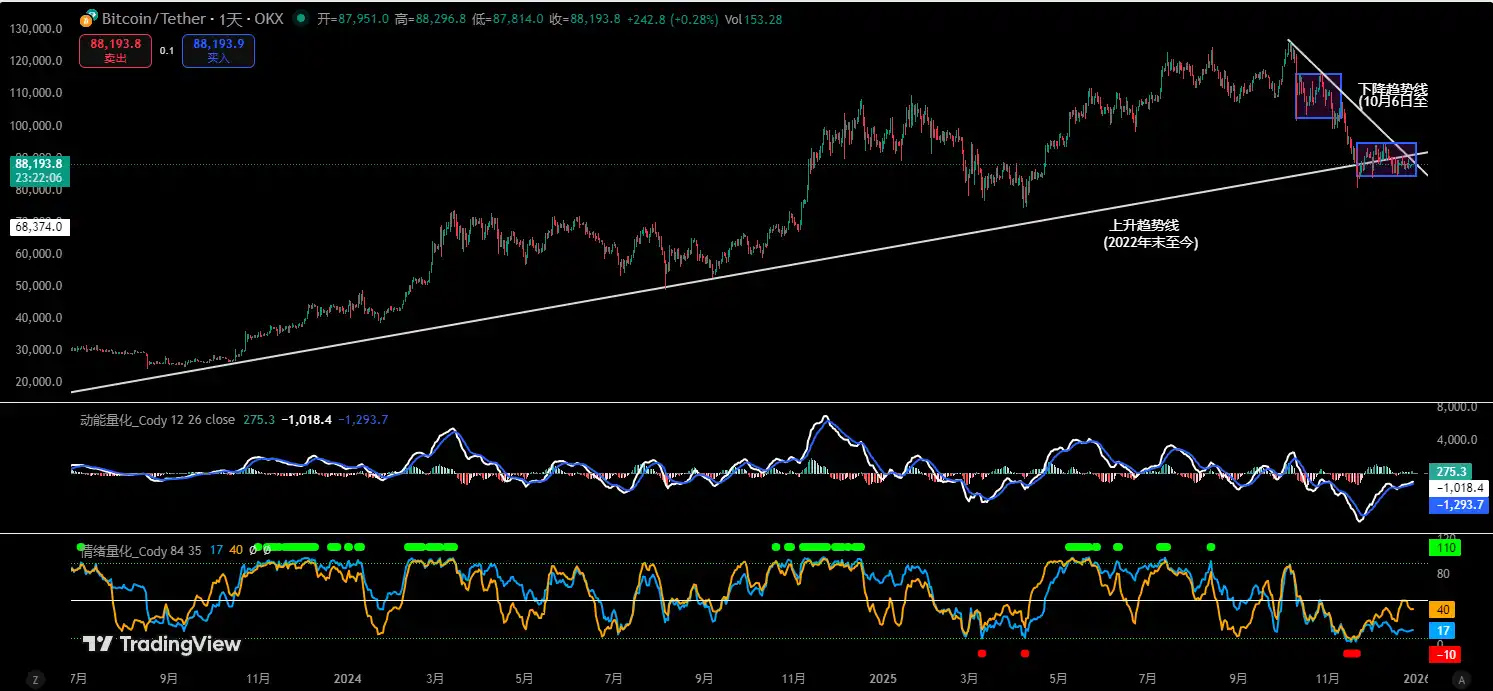
Рисунок 3
2、Как показано на (Рисунке 3), анализ дневного графика:
• Модель量化 импульса:На прошлой неделе две линии импульса几乎 слились在一起, медленно поднимаясь ниже нулевой оси и постепенно приближаясь к ней. Из-за праздников每日 объем торгов持续 сокращался, положительные столбцы импульса изменялись незначительно.
Модель量化 импульса предсказывает:Импульс покупок слабый, столбцы объема сократились до «точечного» состояния, что указывает на временное равновесие сил быков и медведей.
• Модель量化 настроений:После закрытия прошлой недели значение синей линии настроений 16 (близко к нижнему порогу), интенсивность ноль; значение желтой линии настроений 40, интенсивность ноль.
Модель量化 настроений предсказывает:Индекс давления и поддержки: Нейтральный
Вышеуказанные данные提示:На дневном таймфрейме рынок медвежий, в краткосрочной перспективе рынок готовится к выбору направления.
三、Прогноз движения биткоина на текущей неделе: (29.12~04.01)
1、Ожидается, что на этой неделе рынок, скорее всего, будет в основном колебаться с探底, ключевая зона наблюдения - 86 000~86 500долларов.
• При эффективном пробитии вниз: Цена может продолжить снижение,考验 зону поддержки ниже83 500~84 500долларов.
• При эффективном закреплении выше: Рынок может продолжить текущий диапазонный флэт86 500~91 000долларов.
2、Ключевые уровни сопротивления:
• Первая зона сопротивления:89 500~91 000долларов
• Вторая зона сопротивления:93 000~94 500долларов
• Важная зона сопротивления:97 000долларов附近
3、Ключевые уровни поддержки:
• Первый уровень поддержки:86 000~86 500долларов
• Второй уровень поддержки:83 500~84 500долларов
• Важный уровень поддержки:80 000долларов附近.
四、Торговая стратегия для биткоина на текущей неделе (исключая влияние внезапных новостей): (29.12~04.01)
1、 Среднесрочная стратегия: Поддержание среднесрочной позиции (шорт) около65%.
2、 Краткосрочная стратегия: Использование30%объема, установка стоп-лосса, поиск возможностей для «спреда» на основе уровней поддержки и сопротивления. (使用 30-минутный таймфрейм для операций).
3、 Внимательно观察 борьбу быков и медведей за зону86 000~86 500 долларов. Для应对 рыночных изменений мы разработали два краткосрочных плана действийA/B:
• План A: При эффективном закреплении выше зоны86 000~86 500 долларов:
• Открытие позиции: Когда цена отскочит до зоны89 500~91 000 долларов и появятся сигналы сопротивления, можно открыть короткую позицию объемом30%.
• Управление рисками: Стоп-лосс для шорта установить выше92 500 долларов.
• Закрытие позиции: Когда цена упадет до зоны86 000~86 500 долларов и появятся сигналы стабилизации, закрыть все шорты с прибылью.
• План B:При эффективном пробитии вниз зоны86 000~86 500 долларов:
• Открытие позиции: Если цена эффективно пробивает вниз, можно открыть короткую позицию объемом30%.
• Управление рисками: Стоп-лосс установить выше88 000 долларов.
• Закрытие позиции: Когда цена опустится до зоны83 500~84 500долларов и появятся сигналы стабилизации, можно постепенно закрывать позицию с прибылью.
五、Особые указания:
1. При открытии позиции: Немедленно установить начальный стоп-лосс.
2. При достижении прибыли 1%: Переместить стоп-лосс на цену открытия (точка безубыточности), обеспечив безопасность本金.
3. При достижении прибыли 2%: Переместить стоп-лосс на уровень прибыли 1%.
4. Постоянное отслеживание: После этого с каждым дополнительным 1% прибыли перемещать стоп-лосс на 1%, динамически защищая и фиксируя已有 прибыль.
(Примечание: Вышевый порог прибыли в 1% инвесторы могут гибко调整 в соответствии с собственными предпочтениями к риску и волатильностью актива.)
六、Важные события на предстоящей неделе: (29.12~04.01)
1、Протоколы заседания ФРС сигнализируют о «реальных разногласиях»
В среду в 03:00 ФРС опубликует протоколы последнего заседания по денежно-кредитной политике. По сравнению с самим решением по ставкам, протоколы更关键的是 степень разногласий среди членов по «времени, масштабу и устойчивости» снижения ставок.
Если протоколы покажут, что чиновники уверены в снижении инфляции и обсуждают более ранний или быстрый путь смягчения, это усилит рыночные ожидания «снижения реальных ставок», что станет среднесрочным позитивом для биткоина;反之, если протоколы подчеркнут опасения по поводу повторного роста инфляции или слишком быстрого ослабления финансовых условий, это может временно повысить курс доллара и доходность казначейских облигаций, оказывая эмоциональное давление на BTC.
Для биткоина это не сигнал краткосрочного направления, а важный узел, влияющий насреднесрочный定价锚 средств.
2、Количество первичных заявок на пособие по безработице: термометр ожиданий ликвидности
В среду в 21:30 США опубликуют количество первичных заявок на пособие по безработице за неделю по 27 декабря.
В настоящее время рынок更关注 «произошло ли структурное охлаждение рынка труда», а не колебания отдельных данных.
Если количество заявок将持续 выше трендового уровня, это further подтвердит логику охлаждения экономики, усилит ожидания延续 мягкой политики, что благоприятствует восстановлению оценки активов, не приносящих доход, таких как биткоин; если данные снова снизятся, это может усилить判断 «экономика все еще устойчива», что в краткосрочной перспективе неблагоприятно для расширения аппетита к риску BTC.
Влияние этого показателя на биткоин mainly проявляется вожиданиях процентных ставок, а не в基本面本身.
3、Окончательное значение PMI обрабатывающей промышленности подтверждает направление реальной экономики
В пятницу в 22:45 будет опубликовано окончательное значение индекса менеджеров по закупкам (PMI) обрабатывающей промышленности США от S&P Global за декабрь.
PMI作为 опережающий индикатор, поможет рынку判断, остается ли «мягкая посадка» на track.
Если окончательное значение подтвердит стабилизацию или даже улучшение в обрабатывающей промышленности, общие настроения на рынке рискованных активов могут сохраниться, с有限льным системным давлением на BTC; если PMI будет снова пересмотрен в сторону понижения, это может вызвать переоценку экономического спада, краткосрочно негативно для рискованных активов, но в среднесрочной перспективе反而 может усилить ожидания монетарного смягчения.
Финансовые рынки瞬息万变, все анализ рынка и торговые стратегии требуют динамической调整. Все观点, аналитические модели и операционные стратегии, затронутые в данной статье, основаны на личном техническом анализе и предназначены только для личного торгового журнала, не являются инвестиционной рекомендацией или основанием для действий. Рынок有风险, инвестиции需谨慎, DYOR (проводите собственное исследование).