В то время как цена Bitcoin застряла ниже отметки в $70 000, аналитики начинают считать это текущее поведение признаком медвежьего рынка. После нескольких недель нисходящего давления многие ключевые показатели начинают сигнализировать о продолжающейся фазе коррекции, укрепляя идею сценария медвежьего рынка.
Ключевой показатель Bitcoin приближается к своему 4-летнему скользящему среднему
Учитывая недавние сигналы от нескольких ключевых рыночных показателей Bitcoin, нисходящее движение BTC, похоже, еще не закончилось. В настоящее время конкретный показатель указывает на то, что главный актив приближается к исторически значимому порогу, сходному с фазой медвежьего рынка.
Этот сигнал исходит из анализа дневной цены Bitcoin с мультипликатором SMA, построенного на скользящих средних и мультипликаторах, как сообщил Darkfost, аналитик данных и автор CryptoQuant. Последние данные показывают, что Bitcoin снова вошел в зеленую зону на графике и приближается к своему 4-летнему SMA, который в настоящее время находится на уровне около $57 500.
Чем выше стандартное отклонение и, следовательно, мультипликатор SMA, тем более перекупленным кажется Bitcoin. Однако эксперт подчеркнул, что чем ближе цена подходит к 4-летнему SMA, тем более недооцененной становится цена BTC. Чтобы облегчить понимание этих стадий, для иллюстрации всего этого используется цветовая шкала.
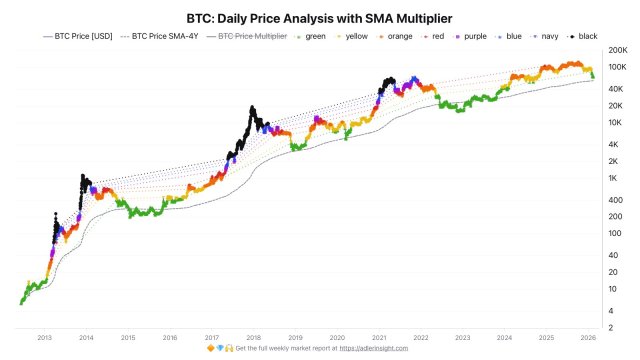
В прошлом этот уровень обычно служил надежным сигналом для финальной стадии каждого медвежьего рынка, при этом главный актив торговался около этих уровней в течение нескольких месяцев. Согласно данным на графике, рынок приближается к уровню медвежьего рынка, и Darkfost считает этот текущий тренд интересным, требующим внимания рынка.
По мере того как Bitcoin приближается к этому уровню, внимание смещается на то, повторится ли история или вступит в силу динамика нового цикла. Пока же криптовалюта остается в точке принятия решения, которая иллюстрирует растущее напряжение между устойчивой слабостью и долгосрочной поддержкой оценки.
Достигла ли цена BTC дна?
По мере нарастания дискуссий о цене дна Bitcoin, Жоао Ведсон предоставил информацию по ситуации, используя полосы реализованной цены долгосрочных держателей BTC. Исторически основные дна происходили, когда цена достигала уровней -0,2 стандартного отклонения этого ключевого показателя.
Ведсон отметил, что эта точка отмечена классическими фазами капитуляции и последней возможностью купить криптокороля перед началом нового бычьего рынка. Однако на выходных поведение было иным. Взгляд на график показывает, что цена не может удержаться выше отметки +1 стандартного отклонения, что говорит о продолжающейся и агрессивной продаже со стороны медведей в этих регионах.
В настоящее время эти полосы действуют как естественные зоны поддержки и сопротивления на протяжении рыночных циклов. Вероятность появления структурного дна резко возрастает, когда цена приближается к крайне отрицательным значениям. Тем временем данные выявляют области с наибольшим риском и появление асимметрии.