Альянс искусственного суперинтеллекта [FET] упал более чем на 8% и на момент публикации торговался около $0,229, что, по-видимому, является переломным моментом для актива. Более того, усиление показателей деривативов наряду с комментариями экспертов дополнительно подтверждает и потенциально доказывает, что FET может продолжить свое нисходящее движение.
В то время как весь рынок переживает трудности, данные CoinGlass показывают, что внутридневные трейдеры внимательно следят за трендом и делают ставки на дальнейшее снижение.
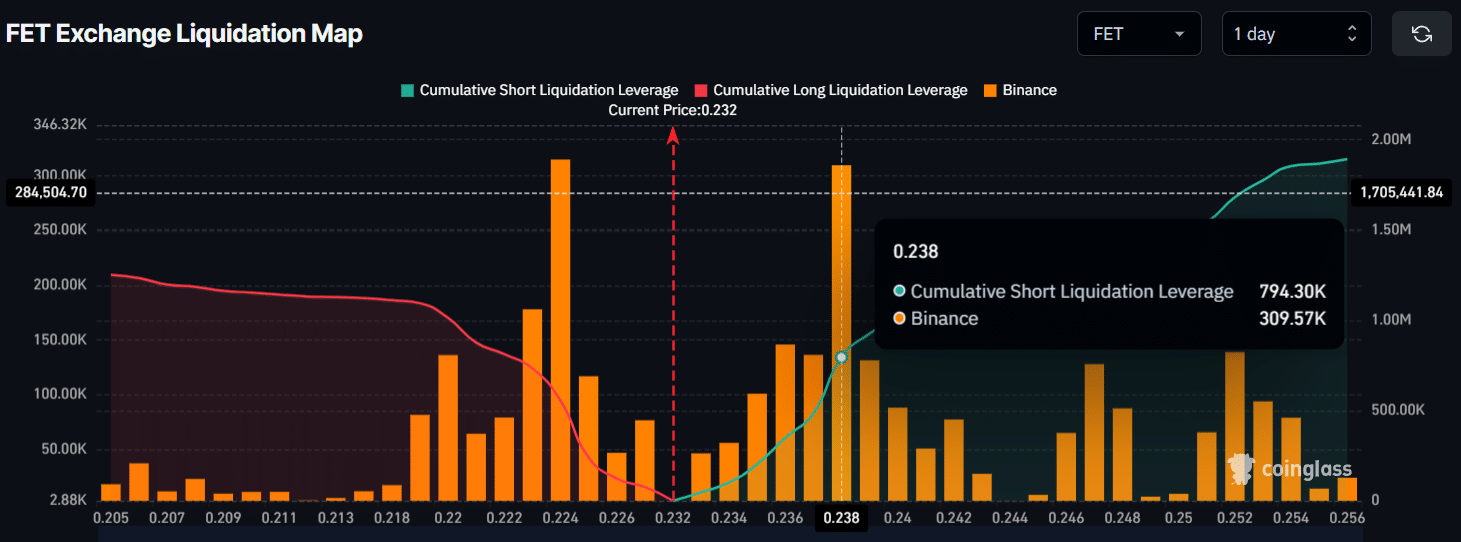
Согласно карте ликвидации на биржах FET, трейдеры проявили значительный интерес к уровням около $0,224 внизу и $0,238 вверху. На этих уровнях они построили примерно $294K длинных позиций с плечом и $794K коротких позиций с плечом.
Эти ставки указывают на то, что медведи в настоящее время доминируют над активом в краткосрочной перспективе, в то время как быки, по-видимому, истощены.

Фактически, криптоаналитик недавно озвучил схожий прогноз по цене FET. В публикации на X аналитик объяснил, что актив откатывается в зону предложения и показывает явные признаки истощения. Более того, FET, по-видимому, готов забрать ликвидность, прежде чем развернуться вниз. Для этого потенциального снижения эксперт обозначил целевые уровни, отметив, что FET может упасть до $0,20 и $0,1737.
Движение цены FET и ключевые уровни для наблюдения
На четырехчасовом графике FET выглядит медвежьим, поскольку падение токена привело цену к переломному уровню, который актив стабильно удерживает с 26 марта 2026 года. Фактически, график предполагает, что FET сформировал нисходящий треугольник и теперь готов к пробою вниз.

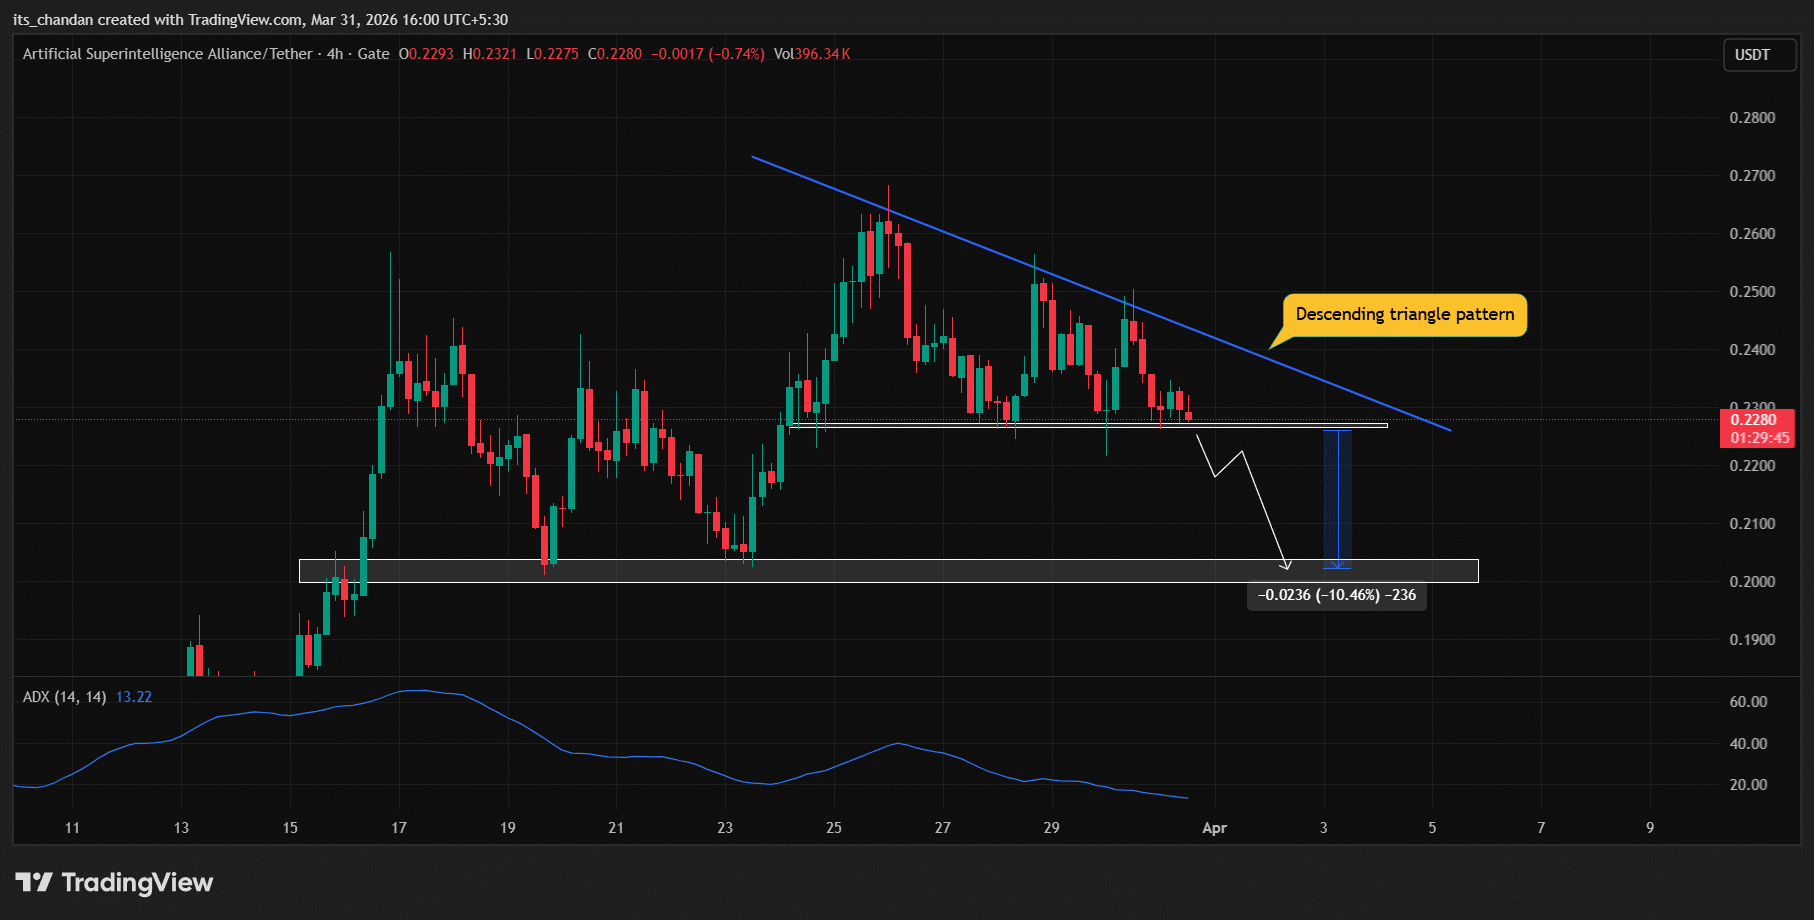
Основываясь на текущем движении цены, если FET не сможет удержать свой ключевой уровень поддержки $0,2270 и закроет четырехчасовую свечу ниже него, цена может потенциально снизиться еще на 10%, достигнув уровня $0,20 в ближайшие дни.
Однако разворот также возможен, если цена останется выше уровня $0,2270. Восходящее движение, вероятно, начнется только в том случае, если FET пробьется выше нисходящей линии тренда паттерна.
Наряду с этим технический индикатор Average Directional Index (ADX) находился на отметке 13,22, ниже ключевого порога в 25, что указывает на слабый направленный импульс. Это говорит о том, что актив может испытывать трудности перед продолжением своего нисходящего движения.
Топ-100 адресов увеличивают холдинги
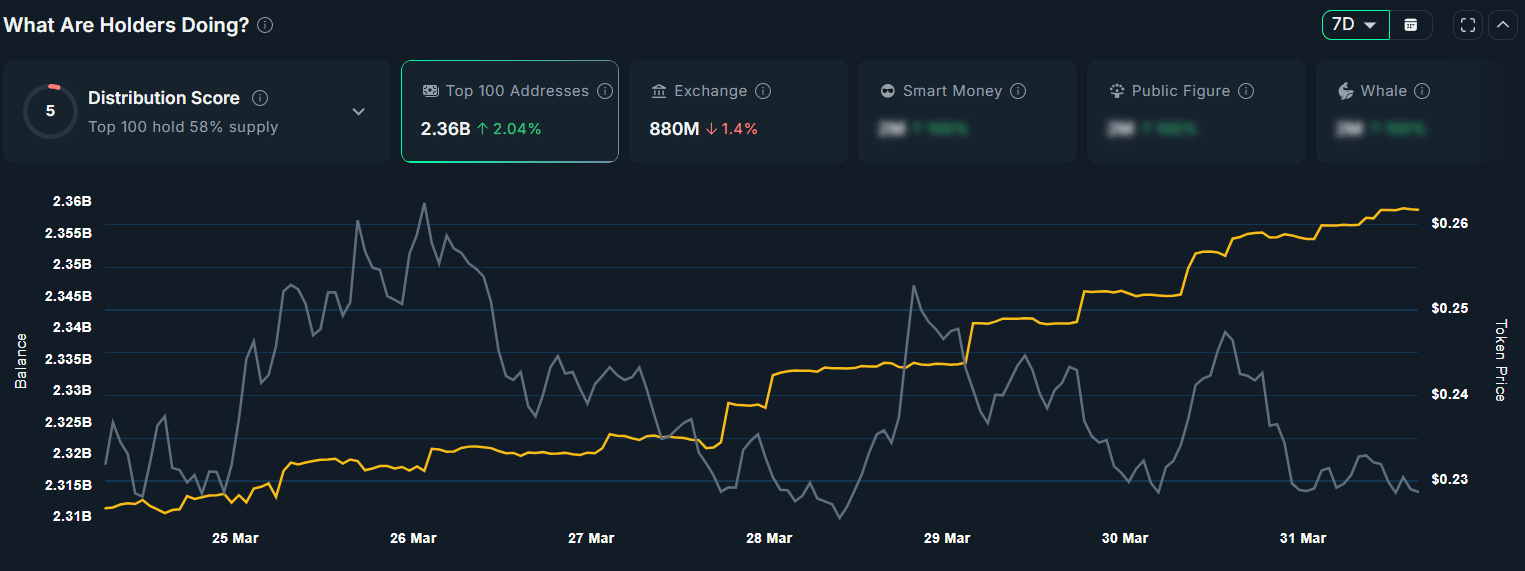
Несмотря на все эти медвежьи события за последние 24 часа, аналитический инструмент Nansen указывает, что долгосрочные перспективы FET остаются бычьими.
Данные показывают, что топ-100 адресов кошельков увеличили свои холдинги на 2,04% за последнюю неделю, сигнализируя о потенциальном накоплении. В то же время резервы на биржах снизились на 1,40% за тот же период, что также свидетельствует о накоплении долгосрочными держателями.

Итоговое резюме
- FET снизился более чем на 8%, и его движение цены намекает на потенциальное падение на 10%, если он упадет ниже уровня $0,2270.
- Эксперт обозначил медвежий прогноз по активу, выделив цели для снижения на уровнях $0,20 и $0,1737.