Ценовые показатели Биткоина за последний месяц были довольно разочаровывающими. Ведущая криптовалюта изо всех сил пыталась устойчиво преодолеть отметку в $70 000 на протяжении всего февраля, достигая цен лишь до $71 000 перед тем, как столкнуться с резкими разворотами.
Тогда становится интуитивно очевидным, что этот ценовой регион может быть ключевым уровнем, выступающим в качестве сопротивления для бычьих попыток Биткоина. Ниже приведены некоторые другие важные уровни, за которыми стоит следить в марте, и то, что они могут потенциально означать для цены Биткоина.
Реализованная цена BTC находится на уровне $54 600 – Что это означает
В посте Quicktake на платформе CryptoQuant рыночный аналитик Бурак Кесемчи выделил пять "кластеров затрат", которые могут раскрыть следующий шаг для цены Биткоина. Для контекста, кластеры затрат – это, по сути, ценовые уровни, которые представляют среднюю цену приобретения актива (в данном случае Биткоина) различными группами инвесторов.
Для начала Кесемчи сразу же указал самую надежную цену поддержки Биткоина – реализованную цену – на отметке около $54 600. Реализованная цена является сильным регионом поддержки, потому что она отражает среднюю себестоимость всех BTC в обращении.
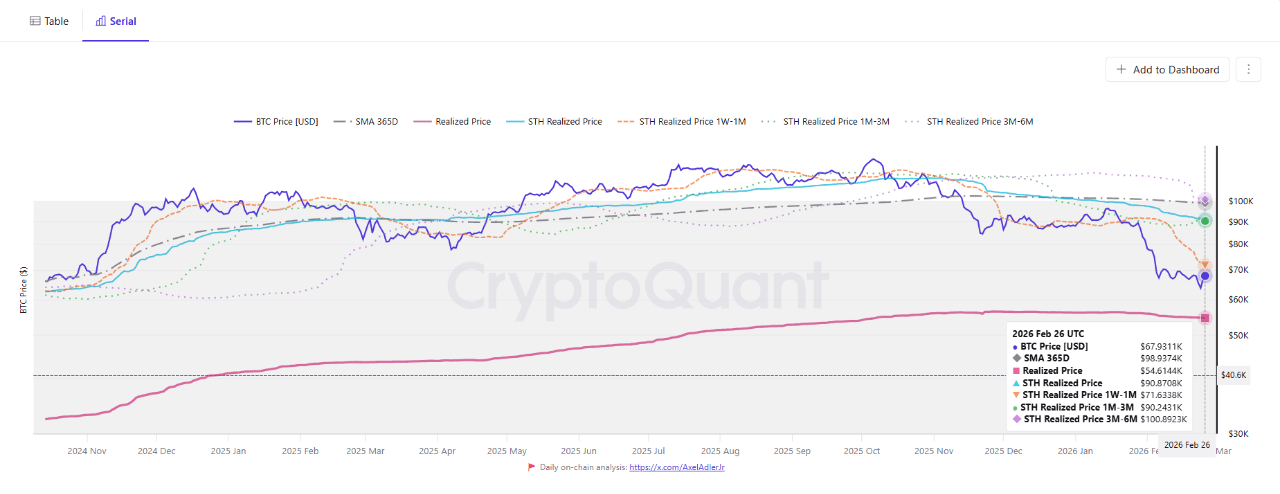
Источник: CryptoQuant
Кроме того, реализованные цены исторически служили долгосрочной ценовой поддержкой во время медвежьих фаз. В результате, когда цена Биткоина торгуется выше этого уровня, это часто является признаком существующей структурной силы, в то время как прорыв ниже реализованной цены обычно является признаком надвигающейся беды.
Биткоин может стать бычьим в марте – Но при этом условии
Хотя цена Биткоина может демонстрировать свою поддержку на более высоком таймфрейме, также верно и то, что ведущая мировая криптовалюта имеет серию битв, которые предстоит выдержать по мере ее восхождения. По словам крипто-эксперта, четыре зоны сопротивления ждут, чтобы отклонить возможное восстановление вверх.
Первой из этих зон является Реализованная цена за 1–4 недели, которая показывает среднюю цену, по которой недавние покупатели вошли на рынок BTC. Согласно выделенным данным CryptoQuant, эта себестоимость составляет около уровня $71 600.
Когда цена Биткоина торгуется ниже этого уровня, это сигнализирует о том, что последние участники находятся под серьезным давлением. Следовательно, попытки восстановления к этому ценовому уровню обычно будут встречать значительное сопротивление, поскольку эта когорта захочет выйти в безубыток.
Аналитик далее отметил, что Реализованная цена краткосрочных держателей (STH RP) составляет около $90 800; это касается инвесторов, которые держали BTC менее 155 дней. Если цене Биткоина удастся преодолеть очевидное сопротивление на этом уровне, это может сигнализировать об изменении тренда Биткоина с медвежьего на бычий.
За STH RP находится 365-дневное Простое скользящее среднее, занимающее уровень цены $98 900; затем, чуть дальше на севере, Реализованная цена за 3–6 месяцев находится около $100 800. Эти метрики отражают активность среднесрочных держателей Биткоина, показывая их реализованную цену и средние цены закрытия за последний год.
В грандиозной схеме Биткоин явно находится в медвежьей фазе. Таким образом, прежде чем март сможет стать pivotal месяцем для участников рынка, BTC должен преодолеть эти критические уровни сопротивления. На момент написания Биткоин оценивается примерно в $63 696, что отражает снижение более чем на 5% за последние 24 часа.

Цена BTC на дневном таймфрейме | Источник: график BTCUSDT на TradingView


