Polkadot tăng 11% sau khi phá vỡ kênh giảm – DOT có thể vượt qua mức 1.686 USD?

ambcryptoОпубликовано 2026-03-16Обновлено 2026-03-16

Введение

Polkadot (DOT) đã tăng hơn 11% trong 24 giờ với khối lượng giao dịch tăng gần 78%, báo hiệu sự trở lại của các nhà mua. Giá đã phá vỡ kênh giảm dần kéo dài, vượt lên vùng $1.59 và tiến gần ngưỡng kháng cự quan trọng $1.686. Chỉ báo RSI tăng lên 57.51 cho thấy áp lực mua tăng, trong khi dòng lệnh mua chiếm ưu thế trên thị trường giao ngay. Các trader hàng đầu trên Binance cũng nghiêng về vị thế mua với tỷ lệ long/short là 1.61. Nếu vượt qua được ngưỡng $1.686, DOT có thể nhắm đến mục tiêu $2.000 khi tâm lý thị trường được cải thiện.

Polkadot đã tăng hơn 11% trong 24 giờ khi khối lượng giao dịch tăng gần 78%, báo hiệu hoạt động thị trường được nối lại khi người mua quay trở lại thị trường DOT một cách mạnh mẽ.

Sự tham gia ngày càng tăng đã đồng hành cùng động thái hướng tới vùng 1,59 USD, cho thấy các nhà giao dịch đã quay trở lại thị trường sau nhiều tuần hoạt động trầm lắng.

Thanh khoản tăng đã củng cố động lực giá ngắn hạn đồng thời mở rộng biến động trên các thị trường giao ngay.

Kết quả là, Polkadot [DOT] đã giao dịch gần hơn với một rào cản kháng cự quan trọng có thể ảnh hưởng đến động thái định hướng tiếp theo.

Đột phá kênh giảm định hình lại cấu trúc của DOT

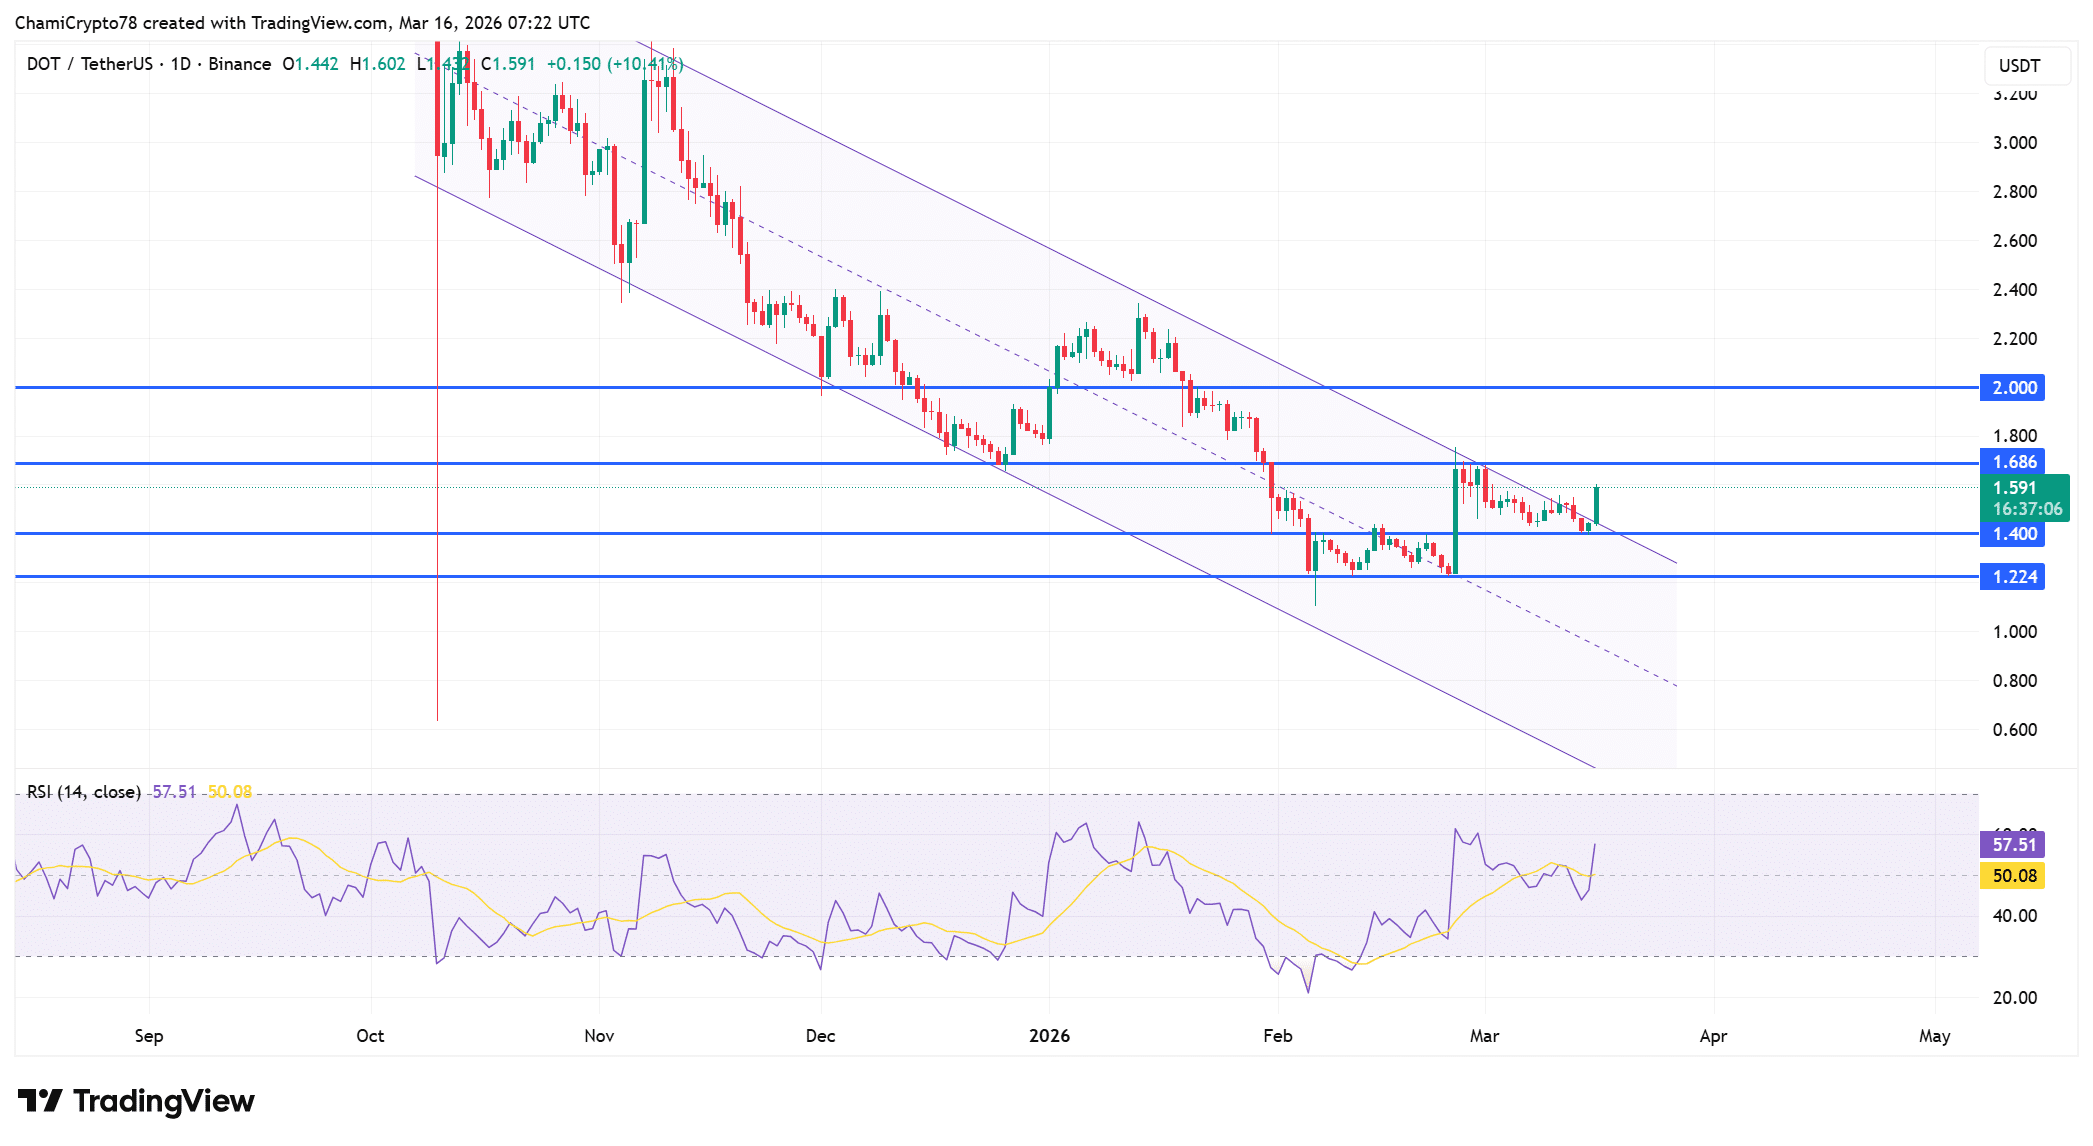
Hành động giá phản ánh một sự thay đổi cấu trúc đáng chú ý sau khi DOT phá vỡ trên một kênh giảm kéo dài.

Sự đột phá diễn ra sau đợt tăng mạnh đã đẩy giá lên vùng kháng cự 1,686 USD, đặt tài sản này gần một điểm uốn kỹ thuật.

Sự nén giá trước đó trong kênh đã hạn chế các nỗ lực phục hồi trong nhiều tháng.

Tuy nhiên, đợt tăng giá gần đây đã đưa giá vượt lên trên ranh giới giảm đó, báo hiệu rằng sự kiểm soát của phe giảm giá đã suy yếu đáng kể.

Các chỉ báo kỹ thuật hiện phản ánh hoạt động mua ngày càng mạnh mẽ khi RSI đã tăng lên 57,51, rõ ràng trên ngưỡng trung tính 50.

Sự thay đổi này cho thấy nhu cầu đã được củng cố một cách ổn định sau sự suy yếu trước đó trong xu hướng giảm kéo dài.

Khi người mua giành lại quyền kiểm soát các biến động giá ngắn hạn, chỉ báo đã dần tiến vào vùng tăng giá.

Trong khi đó, DOT tiếp tục giao dịch quanh mức 1,591 USD, điều này đặt nó giữa mức hỗ trợ 1,400 USD và rào cản kháng cự 1,686 USD.

Phe mua đã bảo vệ vùng thấp hơn nhiều lần trong các phiên gần đây.

Kết quả là, cấu trúc đột phá hiện thu hút sự chú ý vì một đợt đẩy giá bền vững trên 1,686 USD có thể mở ra con đường hướng tới vùng kháng cự 2,000 USD.

Nguồn: TradingView

Dòng lệnh thiên về mua củng cố nhu cầu đối với DOT

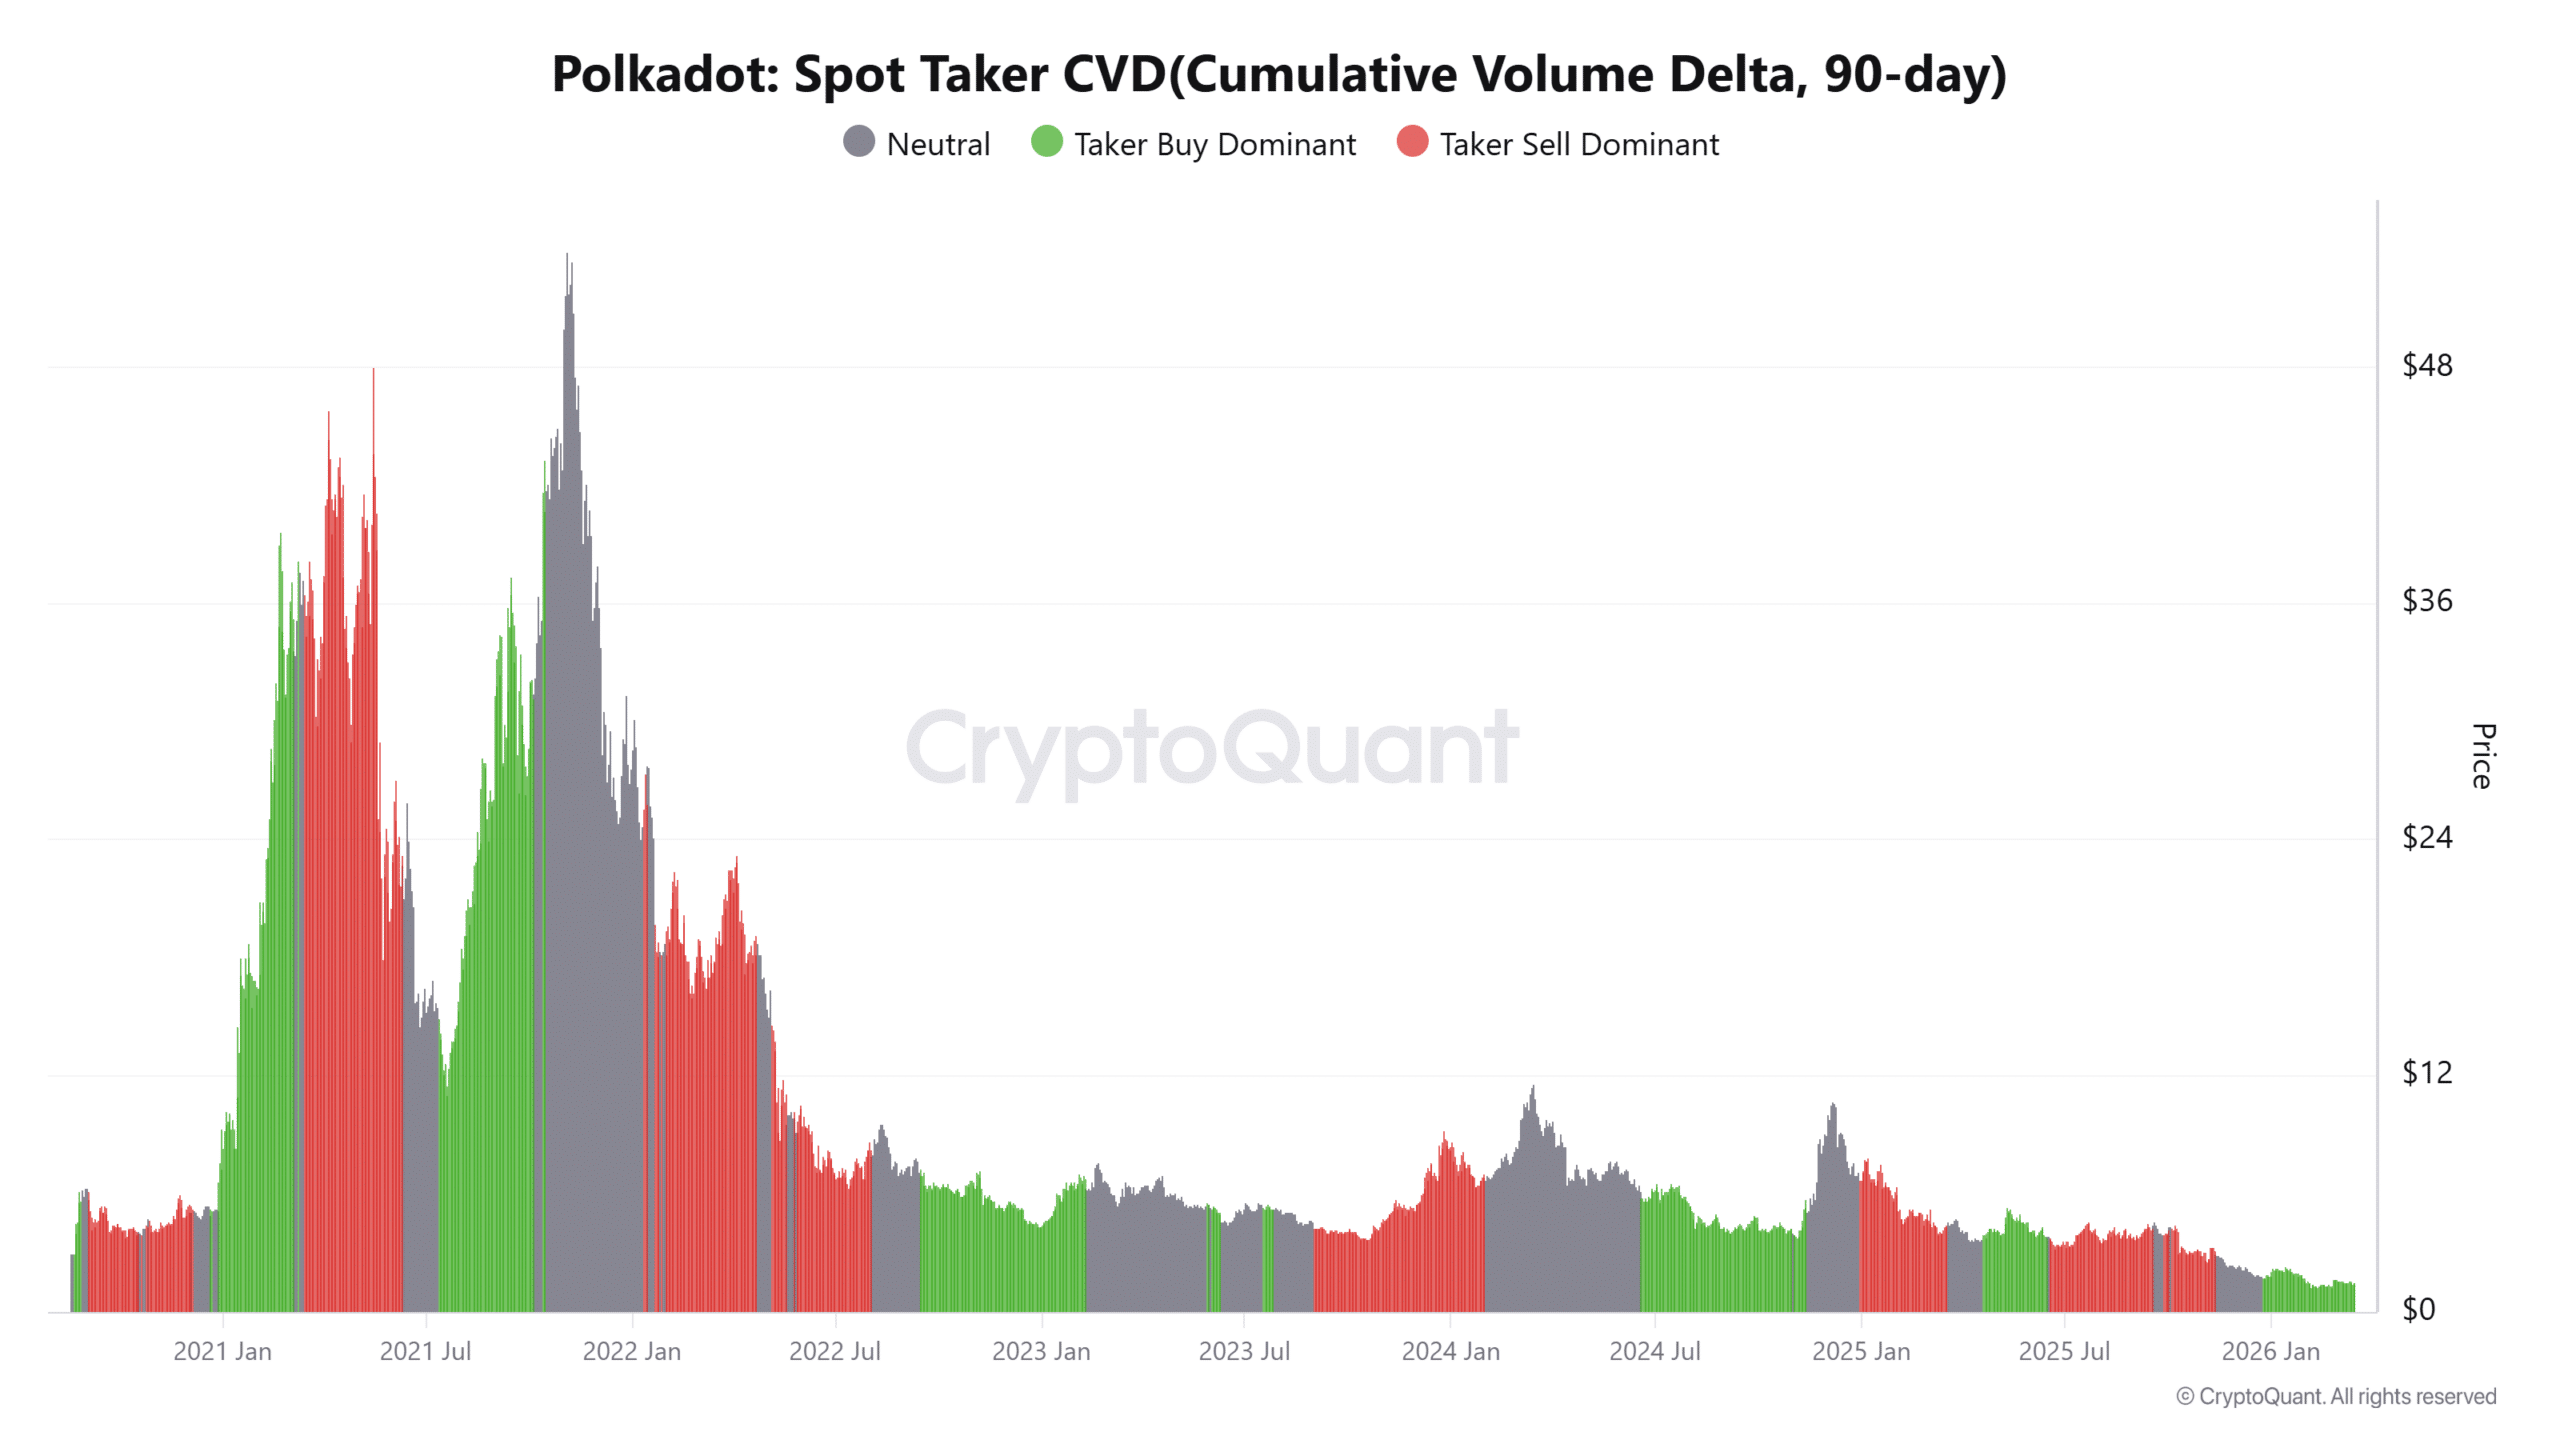
Hoạt động thị trường trên các sàn giao dịch giao ngay hiện phản ánh sự giao dịch mạnh mẽ của người mua khi Spot Taker CVD đã chuyển sang vùng thiên về mua.

Chỉ số này theo dõi sự chênh lệch tích lũy giữa các lệnh mua chủ động và lệnh bán, cung cấp cái nhìn sâu sắc về sự tin quyết của nhà giao dịch.

Các số liệu gần đây cho thấy những người tham gia thị trường ngày càng thực hiện các lệnh mua ở giá thị trường thay vì chờ đợi thanh khoản thụ động.

Hành vi như vậy thường phản ánh niềm tin định hướng mạnh mẽ hơn giữa các nhà giao dịch. Trong trường hợp của DOT, dòng lệnh do người mua dẫn dắt này đã xuất hiện cùng với hoạt động giao dịch gia tăng và sự đột phá giá gần đây.

Khi nhu cầu chủ động tiếp tục thúc đẩy các giao dịch, các nhà giao dịch ngày càng diễn giải dữ liệu như một tín hiệu cho thấy áp lực tích lũy đã được củng cố trên các thị trường giao ngay.

Nguồn: CryptoQuant

Các nhà giao dịch hàng đầu trên Binance nghiêng nhiều về Long đối với DOT

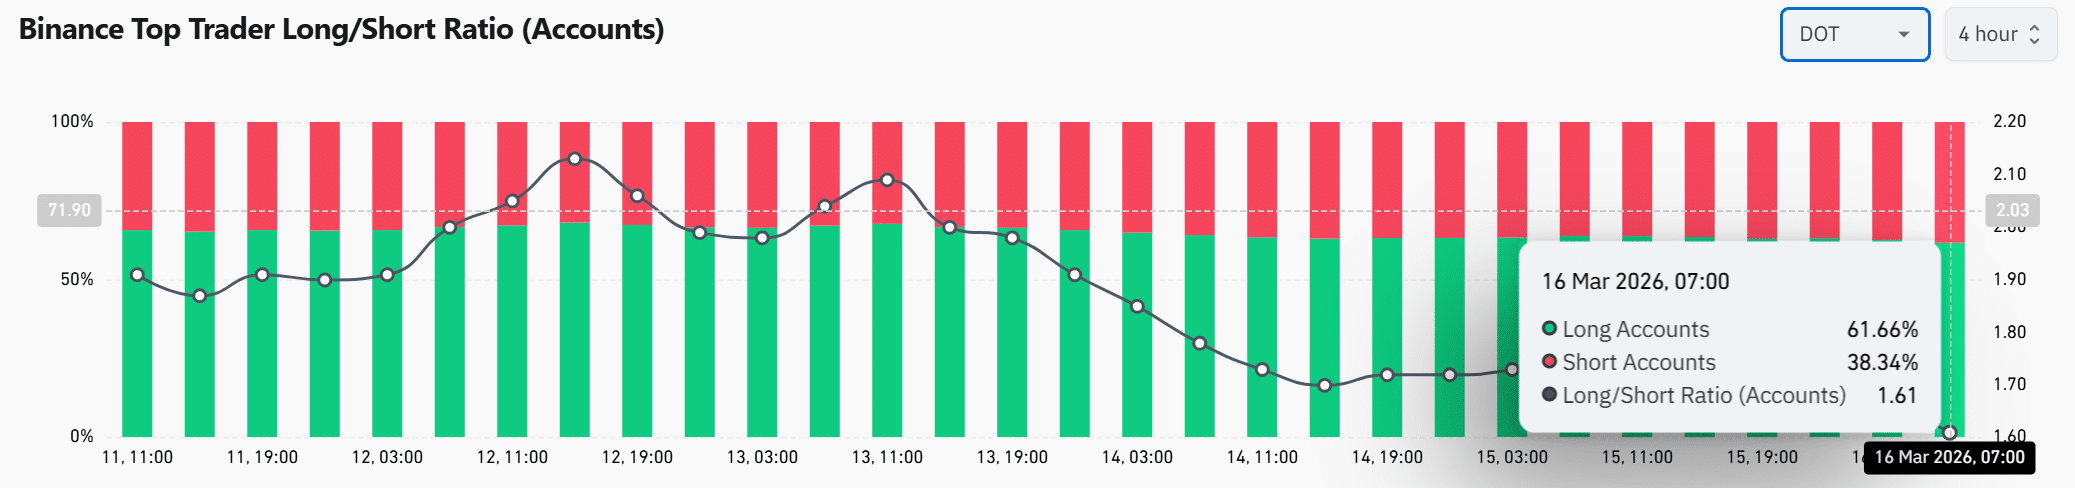
Dữ liệu từ CoinGlass về Tỷ lệ Long/Short của Nhà giao dịch Hàng đầu Binance cho thấy 61,66% tài khoản nắm giữ vị thế mua tại thời điểm báo chí, trong khi 38,34% duy trì vị thế bán, dẫn đến tỷ lệ long/short là 1,61.

Sự phân bổ này chỉ ra rằng các nhà giao dịch có kinh nghiệm phần lớn đã định vị mình cho mức tăng thêm.

Các phiên trước đó cho thấy sự định vị biến động giữa các nhà giao dịch hàng đầu. Tuy nhiên, các số liệu gần đây cho thấy mức tiếp xúc long vẫn chiếm ưu thế trong khi giá cố gắng phục hồi.

Sự liên kết giữa định vị phái sinh và nhu cầu giao ngay ngày càng mạnh mẽ thường báo hiệu niềm tin ngày càng tăng giữa những người tham gia thị trường khi họ dự đoán áp lực tăng giá sẽ tiếp tục.

Nguồn: CoinGlass

Polkadot đã được củng cố đáng kể khi giá tăng vượt trên kênh giảm của nó trong khi người mua mở rộng hoạt động giao dịch và dòng lệnh chủ động.

Các chỉ báo kỹ thuật và định vị phái sinh hiện hỗ trợ tâm lý được cải thiện. Tuy nhiên, mức kháng cự 1,686 USD vẫn là rào cản quan trọng tiếp theo.

Một sự phá vỡ dứt khoát trên mức đó có thể đẩy DOT về phía vùng 2,000 USD khi niềm tin của người mua tiếp tục được củng cố trên toàn thị trường.


Tóm tắt cuối cùng

  • Polkadot [DOT] tăng hơn 11% trong 24 giờ, với khối lượng giao dịch tăng gần 78%.
  • DOT đã phá vỡ trên một kênh giảm kéo dài, cho thấy sự kiểm soát của phe giảm giá đang suy yếu sau nhiều tháng nén giá.

Связанные с этим вопросы

QPolkadot (DOT) đã tăng bao nhiêu phần trăm trong 24 giờ?

APolkadot (DOT) đã tăng hơn 11% trong 24 giờ.

QMức kháng cự quan trọng tiếp theo mà DOT cần vượt qua là gì?

AMức kháng cự quan trọng tiếp theo mà DOT cần vượt qua là $1.686.

QChỉ báo kỹ thuật RSI hiện tại của DOT là bao nhiêu và điều này có ý nghĩa gì?

AChỉ báo RSI hiện tại của DOT là 57.51, nằm trên ngưỡng trung tính 50, cho thấy nhu cầu mua đã tăng lên và phe mua đang kiểm soát các biến động giá ngắn hạn.

QTỷ lệ Long/Short của các nhà giao dịch hàng đầu trên Binance là bao nhiêu?

ATỷ lệ Long/Short của các nhà giao dịch hàng đầu trên Binance là 1.61, với 61.66% tài khoản giữ vị thế mua (long) và 38.34% giữ vị thế bán (short).

QViệc breakout khỏi kênh giảm (descending channel) cho thấy điều gì về cấu trúc giá của DOT?

AViệc breakout khỏi kênh giảm kéo dài cho thấy sự kiểm soát của phe gấu đã suy yếu đáng kể và đánh dấu một sự thay đổi cấu trúc đáng chú ý, mở ra khả năng giá tiếp tục tăng.

Похожее

Fed's Internal Doves Flock to Hawkish Stance, Warsh's Debut "Between a Rock and a Hard Place"

U.S. Federal Reserve officials who previously advocated for rate cuts, including Governor Christopher Waller, have recently shifted their stance, with many now not ruling out the possibility of future rate hikes. This sets a challenging stage for new Fed Chair Kevin Warsh's first policy meeting. Appointed by President Trump based on his dovish views, Warsh now faces a committee where the debate has pivoted from "when to cut" to "whether to hike," driven by persistent inflation above 3%, a strong labor market, and supply-side pressures from AI infrastructure demands and geopolitical tensions. Key figures illustrate the shift. Governor Waller, once concerned about employment, now says data has pushed him toward considering rate increases. Even moderate voices like Governor Lisa Cook, while expecting inflation to ease, have indicated readiness to hike if it fails to do so. Long-time hawks such as regional Fed presidents Beth Hammack, Lorie Logan, and Neel Kashkari have grown more vocal, arguing that the real policy rate is effectively falling and that action may soon be needed. The upcoming Fed meeting is expected to keep rates steady but will likely remove the "easing bias" from its statement, signaling a neutral stance between cuts and hikes. The quarterly "dot plot" is anticipated to show most officials projecting no cuts this year, with some potentially indicating hikes. Chair Warsh, a critic of the Fed's reliance on forward guidance like the dot plot, must navigate communicating this pivot using tools he has questioned, all while steering policy in a direction counter to the preferences of the president who appointed him. The consensus suggests the Fed's next move could well be a rate increase.

marsbit55 мин. назад

Fed's Internal Doves Flock to Hawkish Stance, Warsh's Debut "Between a Rock and a Hard Place"

marsbit55 мин. назад

The Trillion-Yuan Market Cap 'Yi Zhong Tian': Who is the True Value King?

The article analyzes the three leading Chinese optical module companies, collectively nicknamed "Yi Zhong Tian": Xinyisheng, Zhongji Innolight, and TFC Optical Communication. It evaluates their "cost-performance" not by current stock price, but through three lenses: PEG ratio (growth vs. valuation), earnings quality, and premium/discount for certainty. Xinyisheng shows the most attractive PEG ratio and high profitability, but its valuation reflects discounts for risks like high customer concentration and reliance on overseas markets. Zhongji Innolight, the most expensive, commands a premium for its market leadership, dominant share in key products like 800G/1.6T modules, and higher earnings certainty, though it faces geopolitical risks. TFC Optical, as an upstream component supplier ("water seller"), has the highest gross margin and bets on the long-term CPO/NPO architecture trend, but trades at a high valuation with more stable, less explosive growth. The core argument is that while these companies dominate module assembly, the true profit pool and technological moat lie upstream in laser and switch chips, currently controlled by U.S. firms like Lumentum and Coherent. The long-term "cost-performance" for these Chinese leaders hinges on whether the domestic industry, exemplified by companies like Yuanjie Technology, can successfully move up the value chain into high-power laser chips. Otherwise, their high growth may remain confined to the lower-margin assembly segment.

marsbit1 ч. назад

The Trillion-Yuan Market Cap 'Yi Zhong Tian': Who is the True Value King?

marsbit1 ч. назад

Has the Crypto Market Bottomed? Here's What Institutions Think

The crypto market is in a period of significant debate, with leading institutions offering differing views on whether a bottom has been reached. Three prominent firms have published detailed analyses: * **Galaxy Digital** argues Bitcoin has **not yet bottomed**. Their analysis of 13 historical indicators across six dimensions (valuation, profit-taking, miner pressure, etc.) shows only four are fully met. They project a potential bottom range between $30k and $54k. * **NYDIG** states a bottom is **possible but not likely**. While metrics are close to historic bear market extremes, they note the absence of a classic panic-selling event. They also suggest increased institutional adoption may have structurally altered the market cycle, potentially leading to a shallower downturn. * **Standard Chartered Bank** asserts the **bottom has already occurred** at around $59k. They cite two key factors: potential US-Iran diplomatic progress and the anticipated SpaceX IPO, which they believe absorbed capital and caused ETF selling pressure that is now subsiding. They forecast a year-end price target of $100k. Despite the surface-level disagreement, the reports share critical common ground more valuable for long-term investors: 1. All three believe the market bottom will form **within this year**. 2. All agree the current price is **closer to the bottom than to previous highs**. 3. All maintain a **bullish long-term outlook** for Bitcoin and a new cycle. The core takeaway is that while the exact bottom price ($40k, $50k, or $60k) is debated, the consensus is that a bottom is imminent. For long-term holders, the primary focus should not be pinpointing the absolute low, but on the future potential for prices to reach $100k, $200k, or higher. The fundamental thesis for Bitcoin—sovereign debt accumulation, inflation, declining trust in centralized institutions, global digitization, and improved accessibility—remains intact and is arguably strengthening. The overall landscape is viewed as more favorable than in previous crypto winters.

marsbit1 ч. назад

Has the Crypto Market Bottomed? Here's What Institutions Think

marsbit1 ч. назад

The 'Chip' Challenge and Breakthroughs in China's Optical Industry Chain

China's Photonics Industry: Bottlenecks and Breakthroughs In the global AI race, computing chips dominate the narrative, but the underlying bottleneck increasingly defining the scale of AI clusters is light—or more specifically, optical connectivity. Optical modules, which translate electrical signals to light and vice versa, are crucial for connecting thousands of GPUs in AI data centers, preventing data congestion and ensuring efficient model training. High-speed modules (800G, 1.6T) are now standard, with performance hinging on advanced DSP (Digital Signal Processor) chips. This is where a critical dependency lies. Two US giants—Marvell and Broadcom—collectively dominate over 90% of the high-end DSP chip market. Chinese optical module leaders like Zhongji Innolight and Eoptolink rely on these chips to manufacture modules for overseas AI customers, primarily in North America. While this creates a supply chain vulnerability, complete decoupling is difficult. Marvell derives over half its revenue from Greater China, and the US firms depend on Chinese partners for chip packaging and optical components. The risk from laser chips (e.g., from Lumentum), another key component, is considered more manageable due to multiple global suppliers and faster progress in domestic alternatives from companies like YOFC and Accelink. To mitigate risks, China's industry is pursuing a multi-pronged strategy: diversifying supply chains and locking in long-term orders; fostering a domestic market ecosystem to adopt homegrown DSPs from firms like Huawei HiSilicon and CETC; accelerating R&D in high-speed DSPs and advanced packaging; and investing in next-gen technologies like silicon photonics and Co-Packaged Optics (CPO) to reduce reliance on discrete DSPs. The ultimate solution lies not in short-term博弈 but in persistent advancement of domestic high-end chip R&D and manufacturing. While challenges remain in performance, certification, and ecosystem building, China's vast domestic market and manufacturing base provide a crucial buffer, buying time for the industry to achieve greater technological independence.

marsbit1 ч. назад

The 'Chip' Challenge and Breakthroughs in China's Optical Industry Chain

marsbit1 ч. назад

Торговля

Спот
Фьючерсы

Популярные статьи

Как купить DOT

Добро пожаловать на HTX.com! Мы сделали приобретение Polkadot (DOT) простым и удобным. Следуйте нашему пошаговому руководству и отправляйтесь в свое крипто-путешествие.Шаг 1: Создайте аккаунт на HTXИспользуйте свой адрес электронной почты или номер телефона, чтобы зарегистрироваться и бесплатно создать аккаунт на HTX. Пройдите удобную регистрацию и откройте для себя весь функционал.Создать аккаунтШаг 2: Перейдите в Купить криптовалюту и выберите свой способ оплатыКредитная/Дебетовая Карта: Используйте свою карту Visa или Mastercard для мгновенной покупки Polkadot (DOT).Баланс: Используйте средства с баланса вашего аккаунта HTX для простой торговли.Третьи Лица: Мы добавили популярные способы оплаты, такие как Google Pay и Apple Pay, для повышения удобства.P2P: Торгуйте напрямую с другими пользователями на HTX.Внебиржевая Торговля (OTC): Мы предлагаем индивидуальные услуги и конкурентоспособные обменные курсы для трейдеров.Шаг 3: Хранение Polkadot (DOT)После приобретения вами Polkadot (DOT) храните их в своем аккаунте на HTX. В качестве альтернативы вы можете отправить их куда-либо с помощью перевода в блокчейне или использовать для торговли с другими криптовалютами.Шаг 4: Торговля Polkadot (DOT)С легкостью торгуйте Polkadot (DOT) на спотовом рынке HTX. Просто зайдите в свой аккаунт, выберите торговую пару, совершайте сделки и следите за ними в режиме реального времени. Мы предлагаем удобный интерфейс как для начинающих, так и для опытных трейдеров.

968 просмотров всегоОпубликовано 2024.03.29Обновлено 2026.06.02

Как купить DOT

Обсуждения

Добро пожаловать в Сообщество HTX. Здесь вы сможете быть в курсе последних новостей о развитии платформы и получить доступ к профессиональной аналитической информации о рынке. Мнения пользователей о цене на DOT (DOT) представлены ниже.

活动图片