Uniswap's 80% gains in July are in danger with UNI price painting a classic bearish pattern

CointelegraphОпубликовано 2022-07-30Обновлено 2022-07-30

Введение

Uniswap price risks falling 50% from its current levels due to a bearish reversal setup.

Uniswap (UNI) looks ready to post its best monthly performance in more than a year as it rallied approximately 80% in July, but signs of an extended pullback in the near term are emerging.

Uniswap price nearly doubles in July

UNI's price is having one of its best months ever, reaching nearly $9 on July 30 versus nearly $5 at the beginning of the month, best returns since January 2021's 250% price rally.

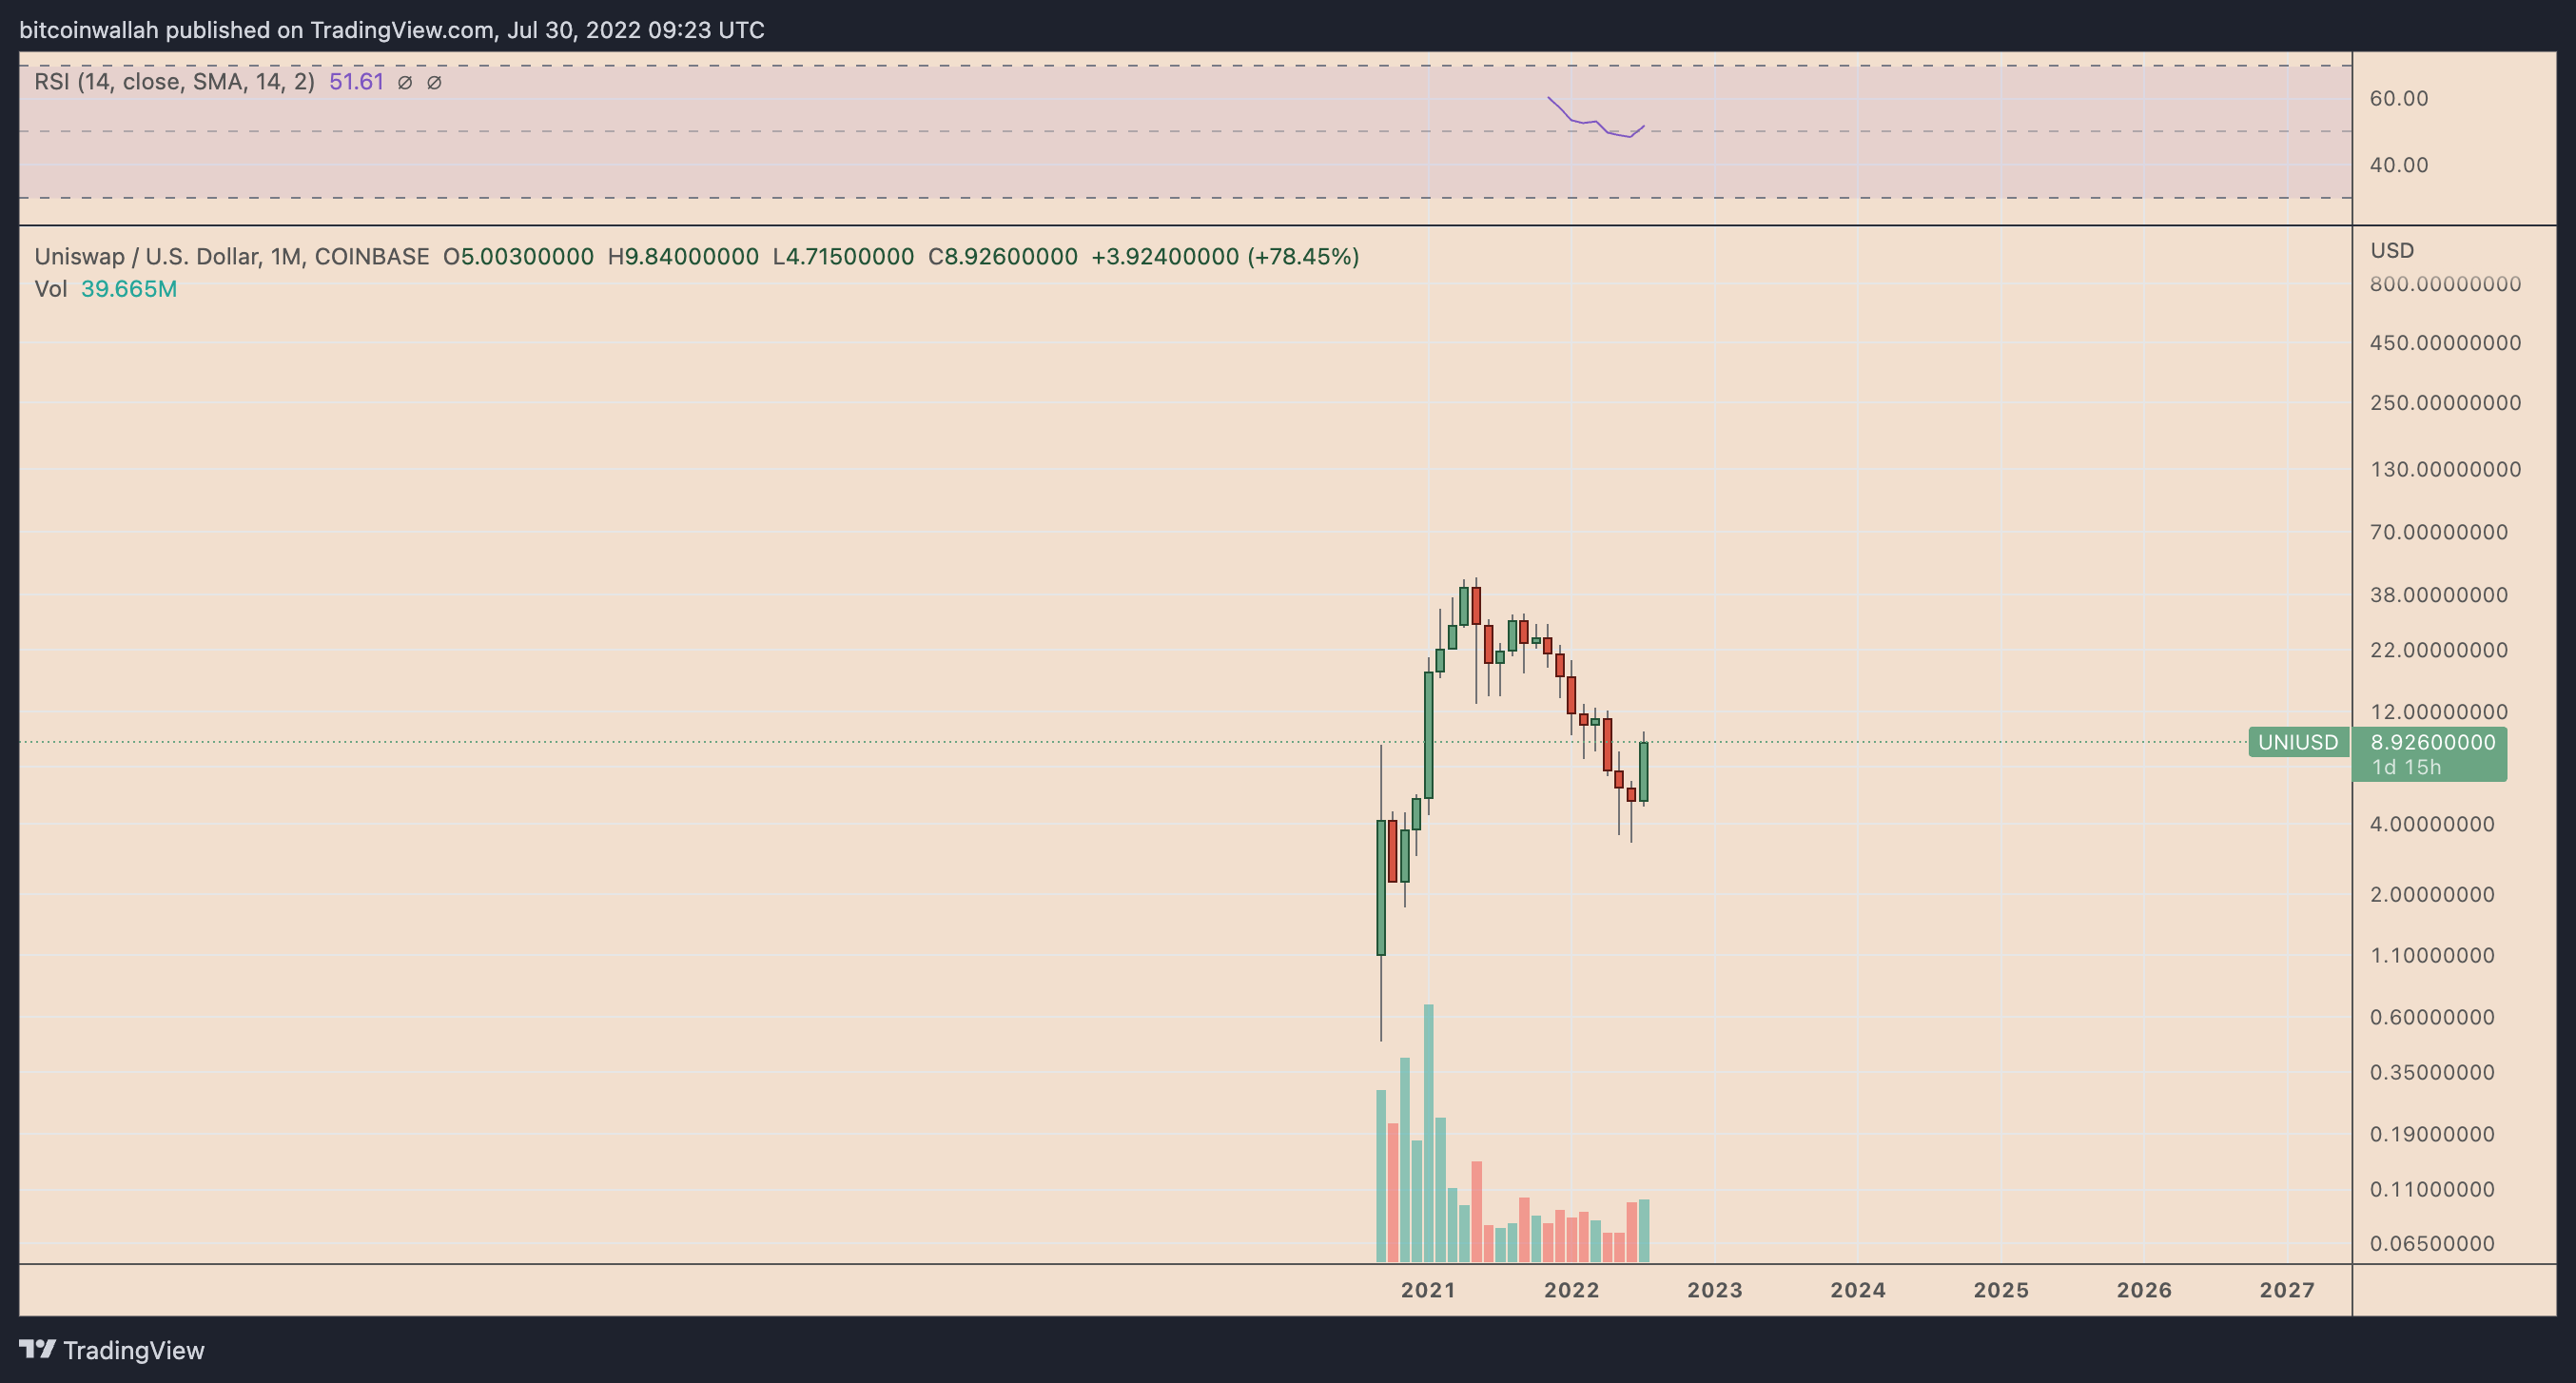
UNI/USD monthly price chart. Source: TradingView

Merge FOMO an UNI "fee switch" proposal

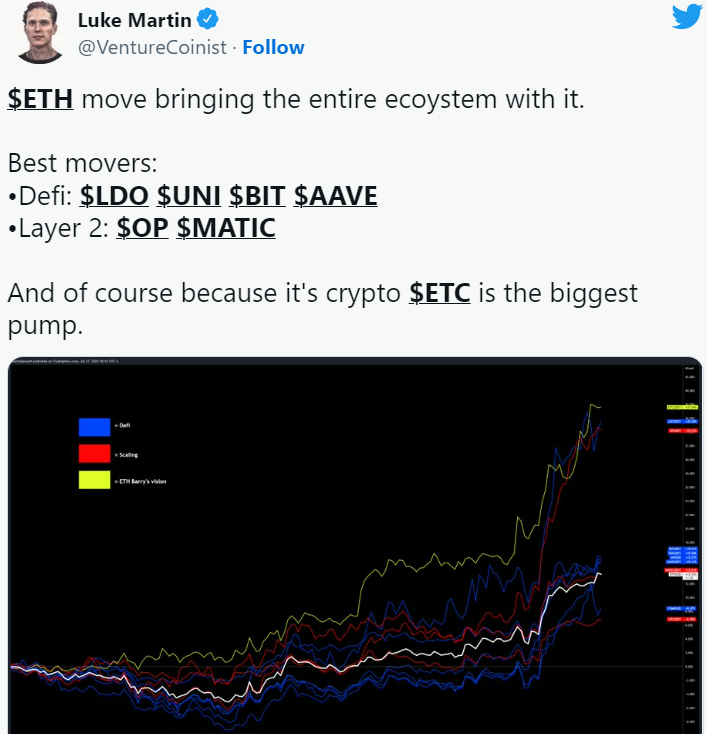
Uniswap's gains primarily surfaced due to similar upside moves in a broader crypto market. But they turned out to be relatively massive due to an ongoing euphoria surrounding "the Merge."

Notably, the Ethereum blockchain's potential transition from proof-of-work to proof-of-stake in September has triggered a buying hysteria among related toke.

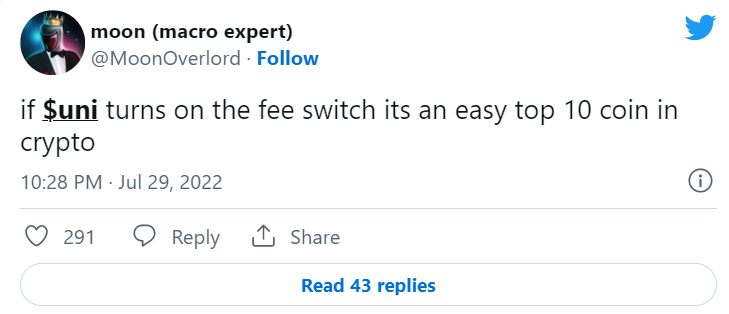
Additionally, UNI may also have been drawing its gains from a so-called "fee switch" proposal.

Specifically, community governance system that oversees Uniswap has been discussing whether or not they should grant UNI holders the right to earn 0.5% commission from Uniswap's 3% trading fees while rewarding the rest for liquidity providers.

UNI "rising wedge" still in play

From a technical's perspective, UNI is now heading lower after testing $20 as its interim resistance.

It now eyes an extended pullback toward the upper trendline of its prevailing "rising wedge" pattern—around $8.

However, its price would risk falling even further if it lands back inside the pattern's trading range, defined by two ascending, converging trendlines.

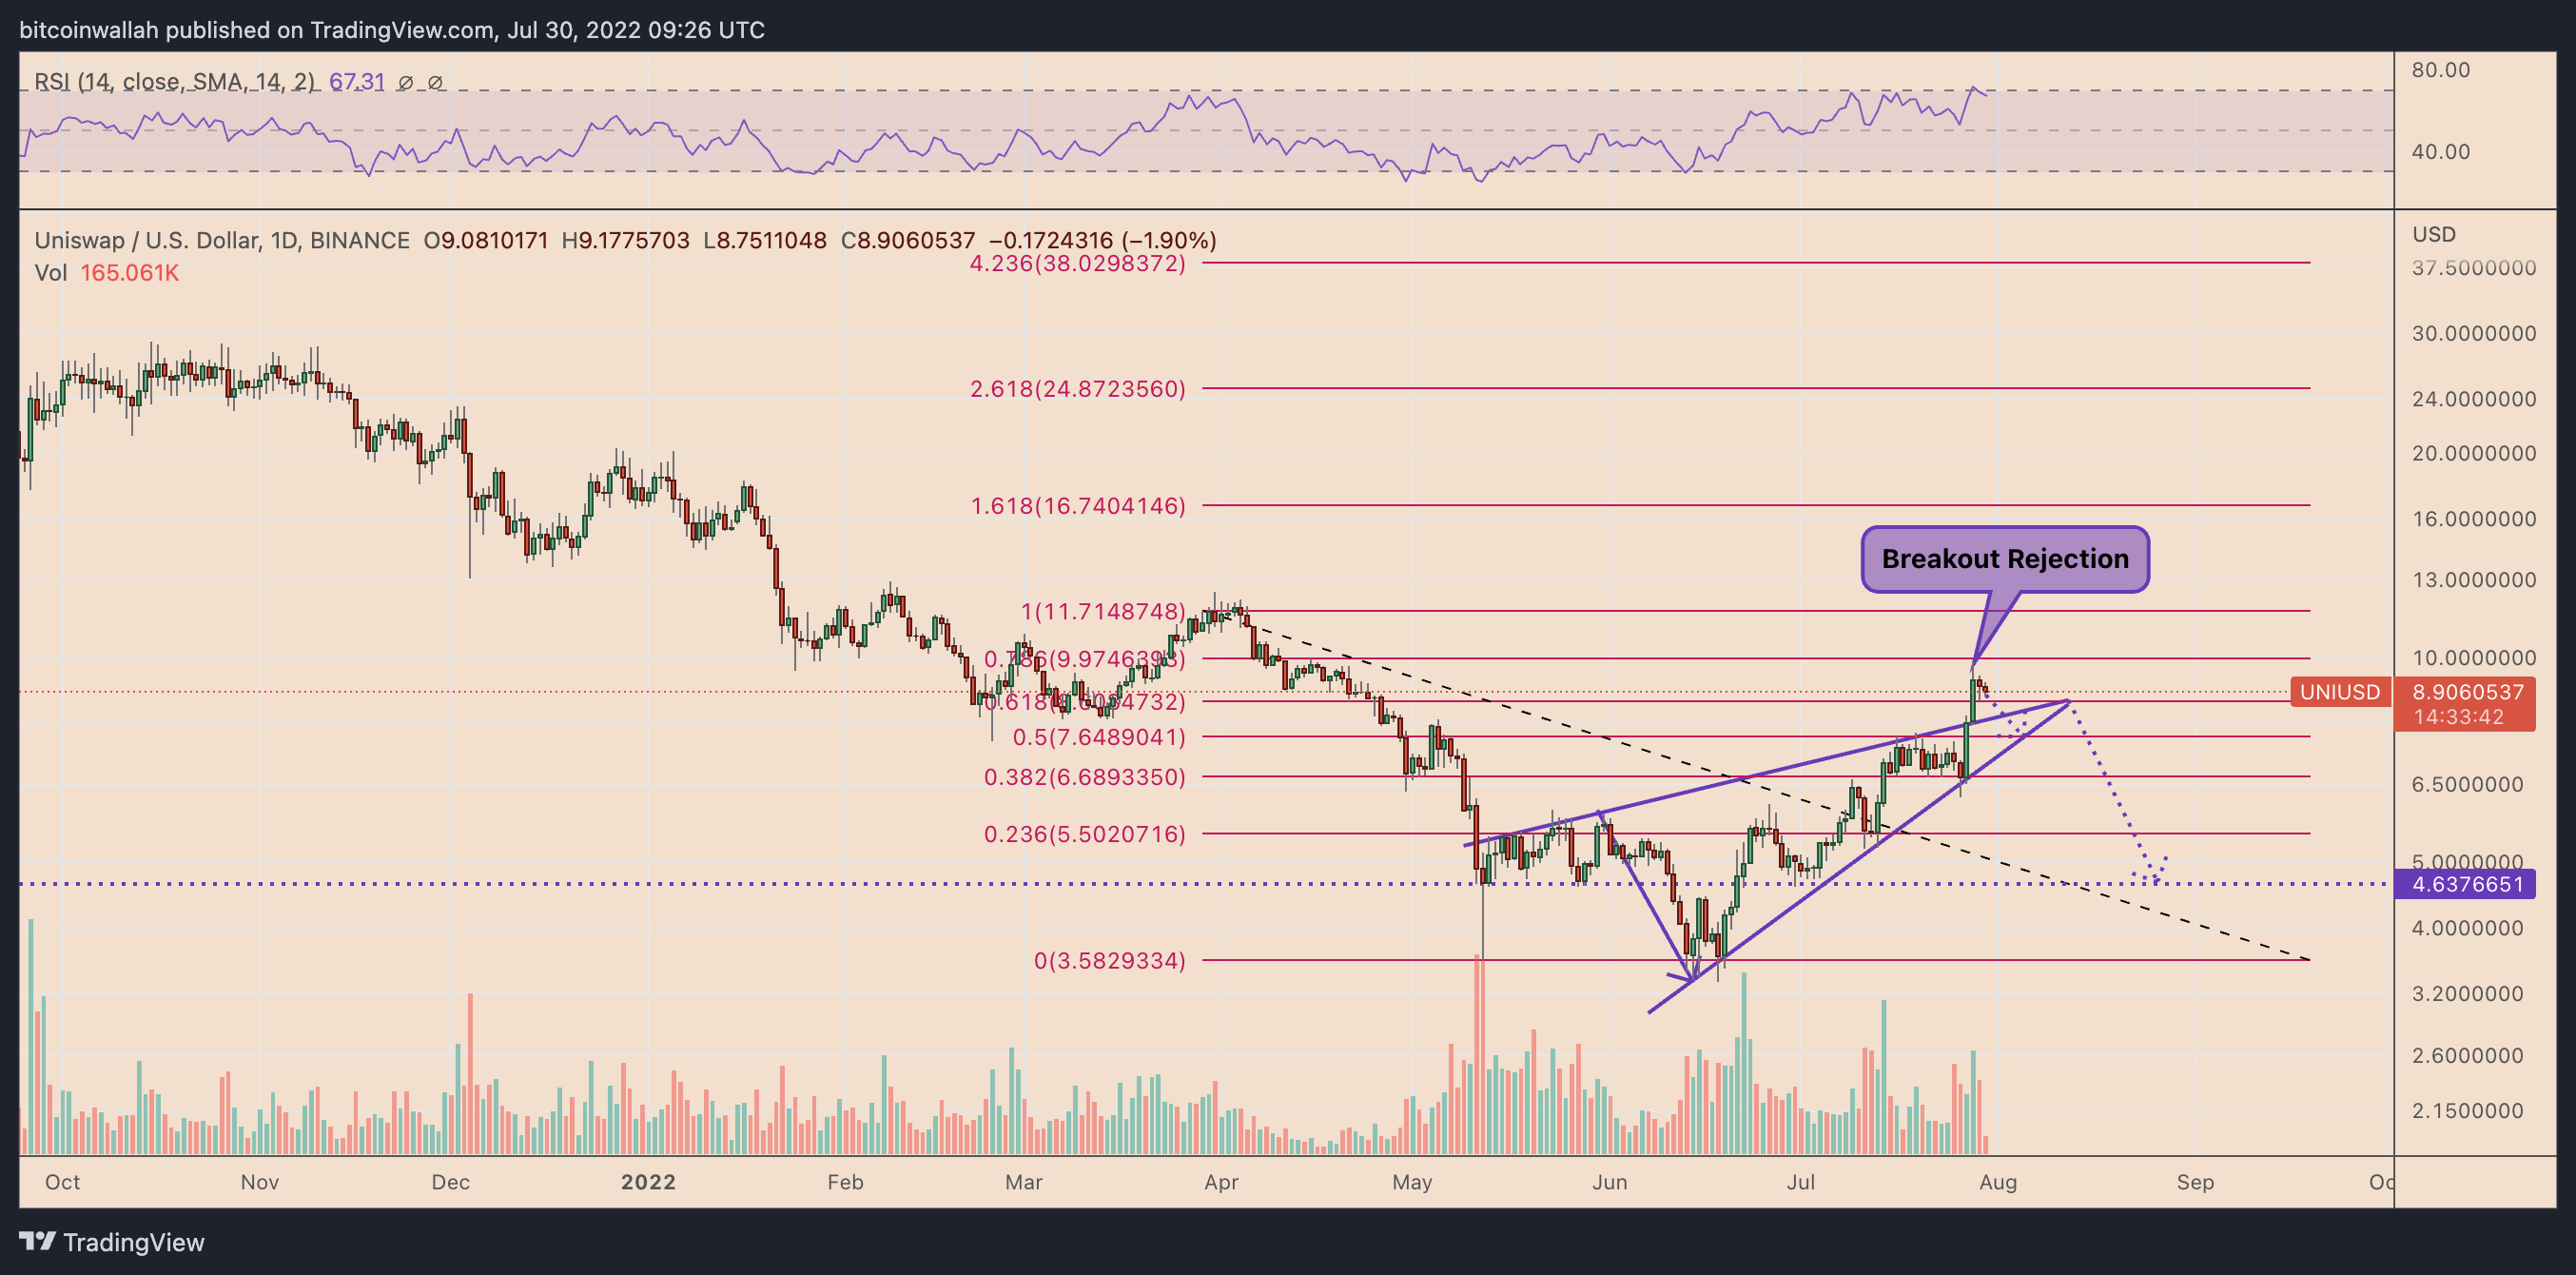
UNI/USD daily price chart featuring 'rising wedge' breakdown. Source: TradingView

That is primarily because rising wedges are bearish reversal patterns.

They resolve after the price breaks below their lower trendlines. Meanwhile, their profit target are typically at length equal to the maximum distance between their upper and lower trendlineswhen measured from the breakdown point.

In other wordsUNI's price could fall toward $4.50 by September, down 50% from today's price if the pattern plays out.

Conversely, a bounce back at or ahead of testing the rising wedge's upper trendline could have UNI retest $10 as its interim resistance. In doing so, it could eye an extended upside move toward the $11.50-$17 range.

Похожее

Bitcoin Trading Strategy Breakdown: Celebrity Predictions and Classic Models All Fail, Only These Four Indicators Remain

Analysis of Bitcoin Trading Strategies: Why Celebrity Forecasts and Classic Models Fail, Leaving Only These Four Reliable Indicators This analysis examines the failure of common Bitcoin prediction methods and identifies four reliable indicators for constructing a trading strategy. The author reviewed all major BTC prediction approaches from 2017-2025, categorizing them into three groups: celebrity price targets (consistently over-optimistic), analytical models like Stock-to-Flow (broken post-2022), and on-chain signals. The key finding is that more data often creates confusion, not clarity. The strategy discards unreliable elements: celebrity predictions (incentivized to be extreme), pure models (invalidated by post-ETF market changes), and the Fear & Greed Index used alone (too many false signals). Four reliable indicators were selected: 1. **MVRV Z-Score:** Accurately identifies cycle bottoms when entering its green zone (e.g., 2018, 2020, 2022). Note: Its ability to call tops is now ineffective post-2024. 2. **SOPR (28-day MA):** Consistently signals bottoms when below 1.0, indicating holders are selling at a loss. 3. **ETF Net Flow:** A crucial post-2024 metric showing institutional momentum (e.g., sustained inflows = buying). 4. **Macro Liquidity (Fed policy & M2):** Sets the overall directional bias (e.g., bullish during easing cycles). The core strategy involves waiting for a multi-signal共振 (resonance). For example, a bottom signal requires MVRV in the green zone + SOPR < 1.0. A top signal requires overheated on-chain data + sustained ETF outflows. Macro policy sets the overall direction. The Fear & Greed Index is only used as a weighted confirmatory signal, never alone. Action is only taken when three or more indicators align. The author automated this into a monitoring system that sends Telegram alerts only when signals trigger. As of the article's date (April 15, 2026), the system showed a strong bottom signal: extreme fear (F&G=12), MVRV in the buy zone, and SOPR < 1.0. The only contrary signal was weak ETF flows. Historically, such triple on-chain共振 has preceded 100%+ returns. The conclusion emphasizes building a personal framework over relying on external predictions, allowing for iterative improvement and customization based on individual risk tolerance.

marsbit1 ч. назад

Bitcoin Trading Strategy Breakdown: Celebrity Predictions and Classic Models All Fail, Only These Four Indicators Remain

marsbit1 ч. назад

Торговля

Спот
Фьючерсы

Популярные статьи

Manyu: восходящая мем-звезда на Ethereum, готовая открыть новую эру культуры Shiba

Manyu - это мемтокен на Ethereum, который приносит децентрализованную культурную и развлекательную ценность через вирусное влияние в соцсетях и вовлечённость сообщества.

1.8k просмотров всегоОпубликовано 2025.11.27Обновлено 2025.11.27

Manyu: восходящая мем-звезда на Ethereum, готовая открыть новую эру культуры Shiba

Обсуждения

Добро пожаловать в Сообщество HTX. Здесь вы сможете быть в курсе последних новостей о развитии платформы и получить доступ к профессиональной аналитической информации о рынке. Мнения пользователей о цене на ETH (ETH) представлены ниже.

活动图片