Автор: Исследовательская команда 21Shares
Перевод: Deep Tide TechFlow
Deep Tide TechFlow: Исследовательская команда 21Shares выпустила углубленный отчёт о Hyperliquid. Ключевой тезис: Hyperliquid эволюционировал из криптодеривативной DEX в круглосуточную универсальную торговую площадку. Во время авиаудара по Ирану в феврале, когда CME была закрыта, контракты на нефть марки WTI на Hyperliquid установили цену почти на 48 часов раньше. Доля торговли традиционными активами достигла 35%, доходы приближаются к показателям CME, но мультипликатор оценки — лишь половина от её показателя. В отчёте представлены оценки для бычьего и медвежьего сценариев, которые стоит изучить внимательно.
28 февраля, когда союзные силы США и Израиля нанесли авиаудар по Ирану, традиционные рынки погрузились во тьму. Чикагская товарная биржа (CME) была закрыта, традиционная инфраструктура не реагировала. Hyperliquid не остановился. Эта основанная на блокчейне биржа деривативов работает 24/7, бессрочные контракты на нефть WTI устанавливали цену в реальном времени, достигнув $111.53, в то время как трейдеры на традиционных рынках могли лишь беспомощно наблюдать.
Этот инцидент подчеркнул роль Hyperliquid как ключевой торговой площадки и индекса в период обострения геополитической напряжённости — в выходные дни он обеспечил ценовое обнаружение в реальном времени. Когда традиционные рынки вновь открылись 2 марта, WTI поднялась выше $110, а разрыв между ценами на Hyperliquid и CME уже сошёл на нет. Hyperliquid не просто реагировал быстрее — он по сути завершил ценообразование в условиях шока почти на 48 часов раньше традиционных систем.
Этой истории уже достаточно для убедительности. Но то, что произошло потом, превращает её в инвестиционную историю. Если перенестись на два месяца вперёд, суточный объём торгов нефтью на Hyperliquid по-прежнему составляет около $5 млрд, а контракты на нефть остаются в пятёрке самых торгуемых активов на платформе.
Биткоин по-прежнему остаётся активом с наибольшим объёмом торгов на Hyperliquid, но традиционные активы — S&P 500, серебро, Nasdaq 100, нефть WTI и Brent — занимают половину мест в топ-10 торгуемых активов. Акции отдельных компаний, такие как Micron Technology (MU), в некоторые дни даже входят в десятку. Мы считаем, что это демонстрирует конечное направление развития Hyperliquid. Hyperliquid — это не просто биржа для торговли криптобессрочными контрактами, он полностью превратился в «универсальную биржу», где пользователи могут торговать бессрочными контрактами практически на любой тип активов.
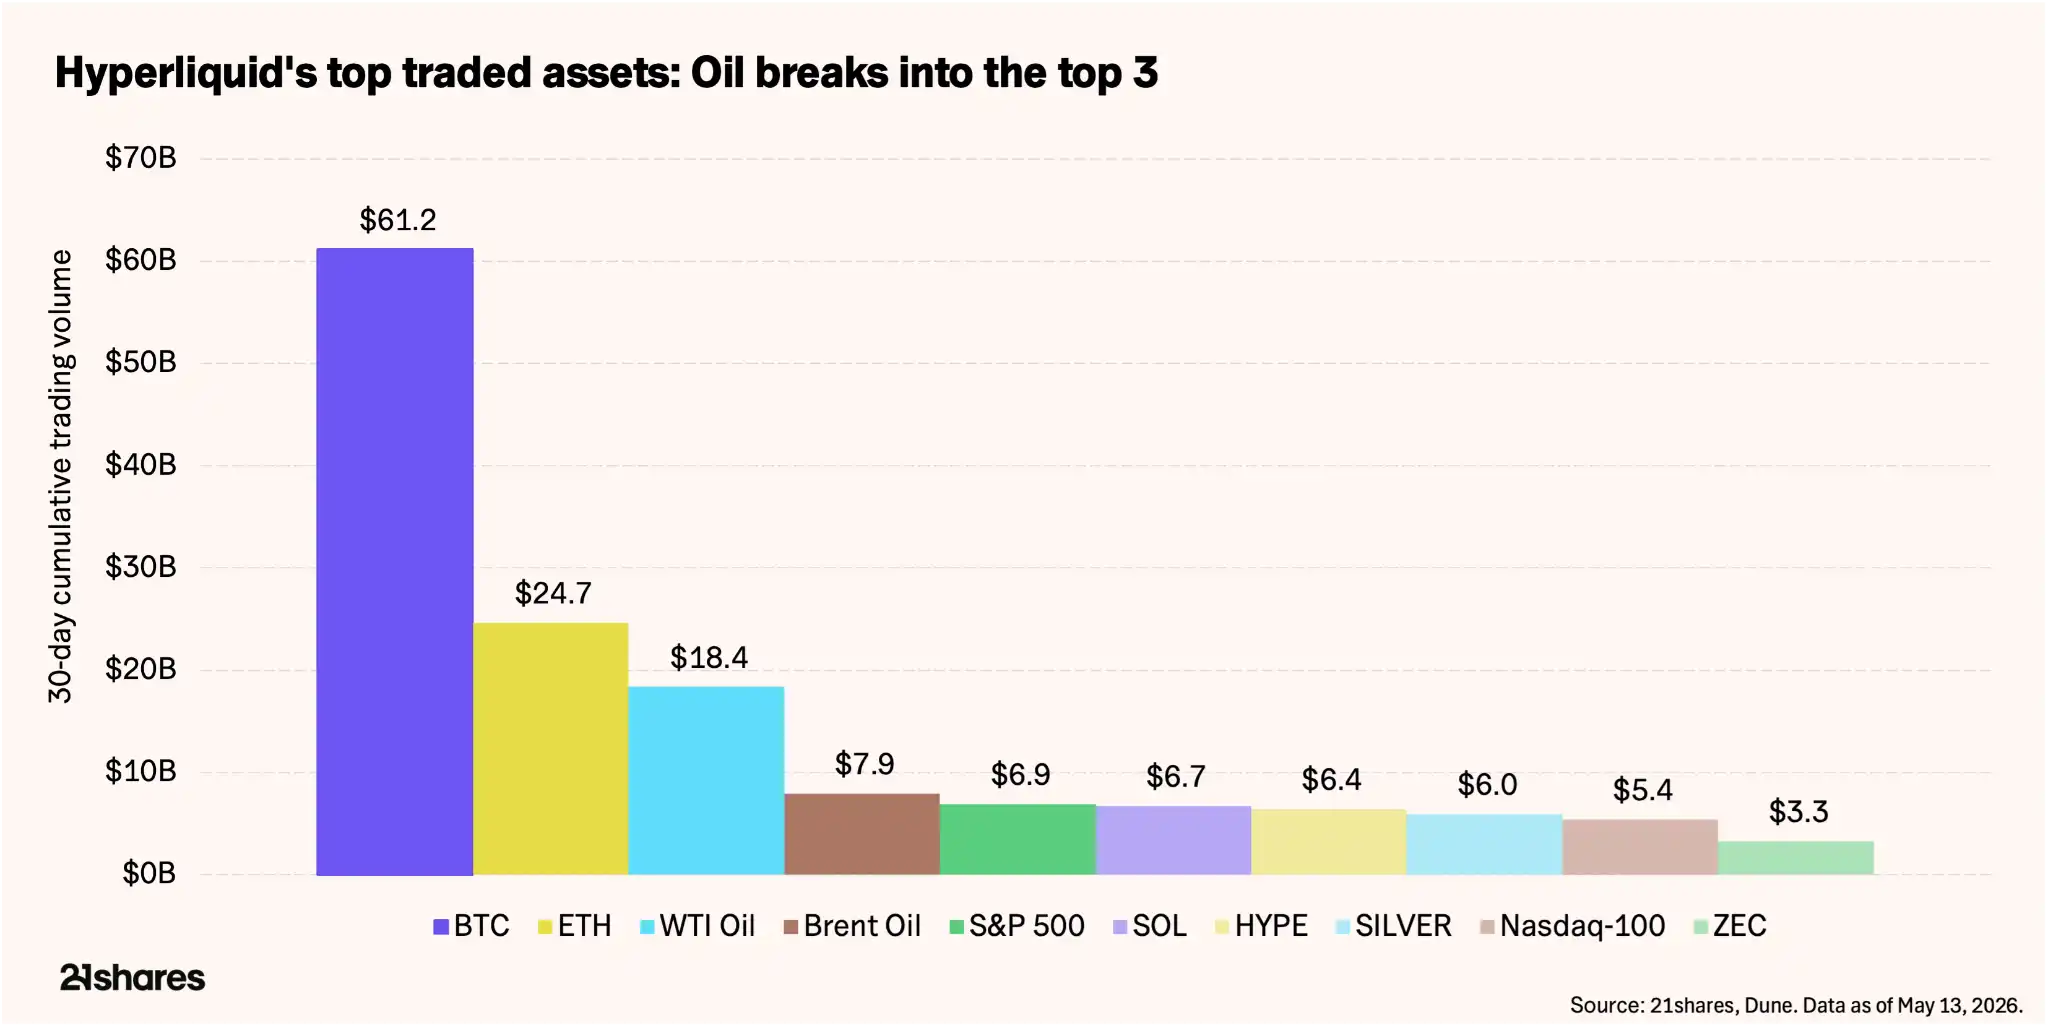
Рисунок: Распределение топ-10 торгуемых активов на платформе Hyperliquid
Бизнес-модель Hyperliquid эволюционирует
Этот отчёт поможет понять, как разумно оценить Hyperliquid, а также какие ключевые показатели и риски следует отслеживать инвесторам.
В прошлом большая часть доходов Hyperliquid поступала от торговли цифровыми активами, и бизнес-модель сильно зависела от общей динамики крипторынка. Но рост объёмов торговли нецифровыми активами фундаментально расширил основную бизнес-модель платформы.
HIP-3 — это разрешительная структура протокола, позволяющая любому лицу запускать новые рынки бессрочных фьючерсов. В настоящее время на HIP-3 приходится около 35%-37% общего объёма торгов, что на 600%-800% больше, чем в конце 2025 года. Открытый интерес (OI) на этих рынках достиг $1.7 млрд к середине мая, увеличившись более чем на 150% с февраля. На сырьевые товары приходится около $730 млн, из которых только на нефть — около 20%.
Темпы изменений высоки. Доля криптопар — бизнеса, с которого начинала платформа — снизилась примерно с 90% до примерно 65%. В настоящее время пять из десяти активов с наибольшим объёмом торгов представляют собой традиционные рыночные инструменты, такие как сырьевые товары. Платформа, которая когда-то занималась только криптодеривативами, всё больше напоминает макро-биржу.
Бычья логика Hyperliquid строится на этой диверсификации классов активов. С запуском HIP-4 в начале мая, ориентированного на рынки предсказаний и опционов, Hyperliquid ускоряет своё превращение в «универсальную биржу».
Следуя за деньгами
Данные Hyperliquid выводят его в число самых прибыльных протоколов в сфере цифровых активов, и его даже можно сравнить с ведущими традиционными биржами деривативов:
- Совокупный исторический объём торгов: $4.22 трлн. Из них $2.9 трлн пришлось на 2025 год, что сравнимо с объёмом торгов криптодеривативными контрактами CME Group в $3 трлн.
- Совокупный общий доход протокола: $1.15 млрд. Доход за один только 2025 год составил $873 млн по сравнению с $6.5 млрд у CME Group за тот же период.
Кроме того, для токена HYPE существует постоянная покупательная сила и механизм возврата стоимости — Assistance Fund. Этот фонд направляет 97%-99% комиссий, генерируемых платформой, на автоматизированный выкуп токенов, и на сегодняшний день общая сумма выкупа превысила $1.5 млрд. Эта «программа обратного выкупа акций» линейно масштабируется с объёмом торгов, не требует одобрения какого-либо совета директоров, и каждая сделка напрямую влияет на динамику предложения токена.
При текущих операционных темпах подразумеваемая доходность от выкупа составляет примерно 13% от рыночной капитализации в обращении. Для сравнения: CME Group в конце 2024 года утвердила программу обратного выкупа акций на $3 млрд, но фактически использовала только $532 млн. В годовом исчислении — около $1.06 млрд при рыночной капитализации около $105 млрд, доходность около 1%. Норма возврата капитала Hyperliquid примерно в 13 раз выше, чем у CME, хотя и риски, конечно, больше.
HYPE одновременно является средством оплаты торговых комиссий и залоговым активом, необходимым для развёртывания новых рынков HIP-3. В настоящее время для запуска каждого нового рынка бессрочных контрактов требуется заблокировать 500,000 HYPE, что составляет около $19.5 млн. По мере расширения платформы на большее количество классов активов HYPE одновременно изымается из обращения с нескольких сторон. При текущих объёмах торгов протокол находится в состоянии чистого дефляционного давления: ежемесячный выкуп составляет около 1.95 млн HYPE, что превышает примерно 1.75 млн HYPE, поступающих в обращение за счёт разблокировки и стейкинга.
Оценка
Текущая рыночная капитализация HYPE в обращении составляет около $9.4 млрд. При сопоставлении с доходами за последние 12 месяцев в размере $944 млн, коэффициент P/S (цена/выручка) Hyperliquid составляет примерно 10x. Для сравнения, у крупнейшей в мире биржи деривативов CME Group коэффициент P/S равен 17.32x, рыночная капитализация — около $110 млрд, а доходы за 2025 год составили $6.5 млрд.
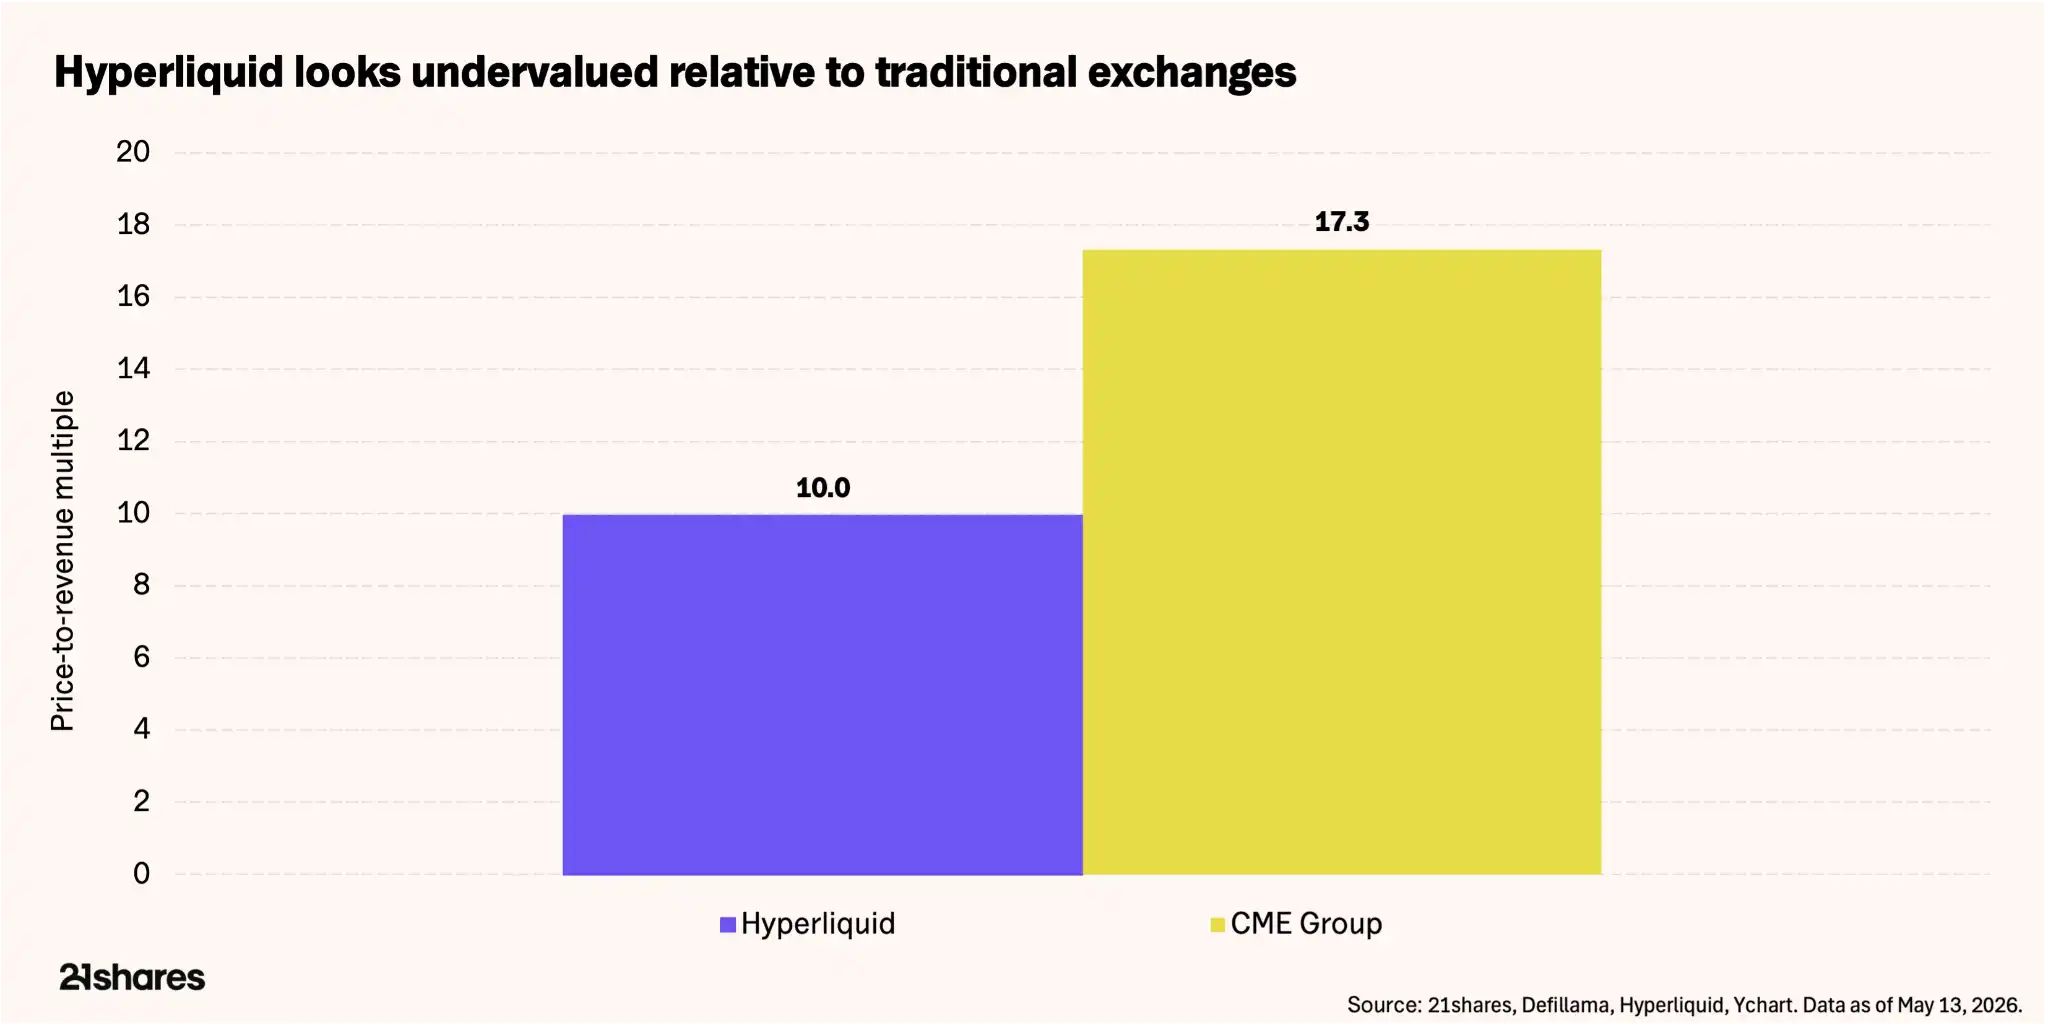
Рисунок: Сравнение P/S и выручки на сотрудника для HYPE и CME
Рынок уже использует оценочные рамки традиционных бирж для ценообразования HYPE. Реальный вопрос в том, заслуживает ли качество доходов Hyperliquid такого сравнения. Чтобы проиллюстрировать преимущества эффективности блокчейн-инфраструктуры перед традиционными системами: доходы Hyperliquid за 2025 год составили $873 млн, а в команде всего 11 человек — выручка на сотрудника $79.36 млн. За доходами CME Group в $6.5 млрд стоят 3875 сотрудников, выручка на сотрудника — $1.7 млн. Разница очевидна.
По полностью разводнённой базе — с учётом всех 1 млрд токенов HYPE, большая часть которых ещё не разблокирована — оценка вырастает примерно до $37 млрд, то есть 38-39x от выручки. Эта цифра может быть оправдана только в случае значительного роста доходов до того, как все токены поступят в обращение. Но учитывая, что годовой рост пользователей Hyperliquid превышает 100%, а также экспансию в новые классы активов, такие как сырьевые товары, и рынки предсказаний, этот премиум за рост может быть обоснован.
Вместо того чтобы давать конкретную целевую цену на токен, давайте рассмотрим несколько сценариев:
Бычий сценарий: Если геополитическая напряжённость сохранится, объёмы торгов сырьевыми товарами останутся высокими, традиционные трейдеры продолжат заходить на Hyperliquid после закрытия торгов, а открытый интерес HIP-3 вырастет до $3-5 млрд, годовые доходы могут выйти в диапазон $1.2-1.5 млрд. При коэффициенте P/S CME в 16-17x подразумеваемая рыночная капитализация составит около $15-17 млрд, что соответствует цене HYPE примерно $62-70. Если опционы и рынки предсказаний наберут популярность в ближайшие месяцы, рост доходов может ускориться.
Базовый сценарий: При аналогичных допущениях, открытый интерес HIP-3 вырастает до $3.2-5.3 млрд, годовые доходы выходят в диапазон $1.0-1.1 млрд. При коэффициенте P/S 17x подразумеваемая рыночная капитализация составляет около $17-18 млрд, что соответствует цене HYPE примерно $75.
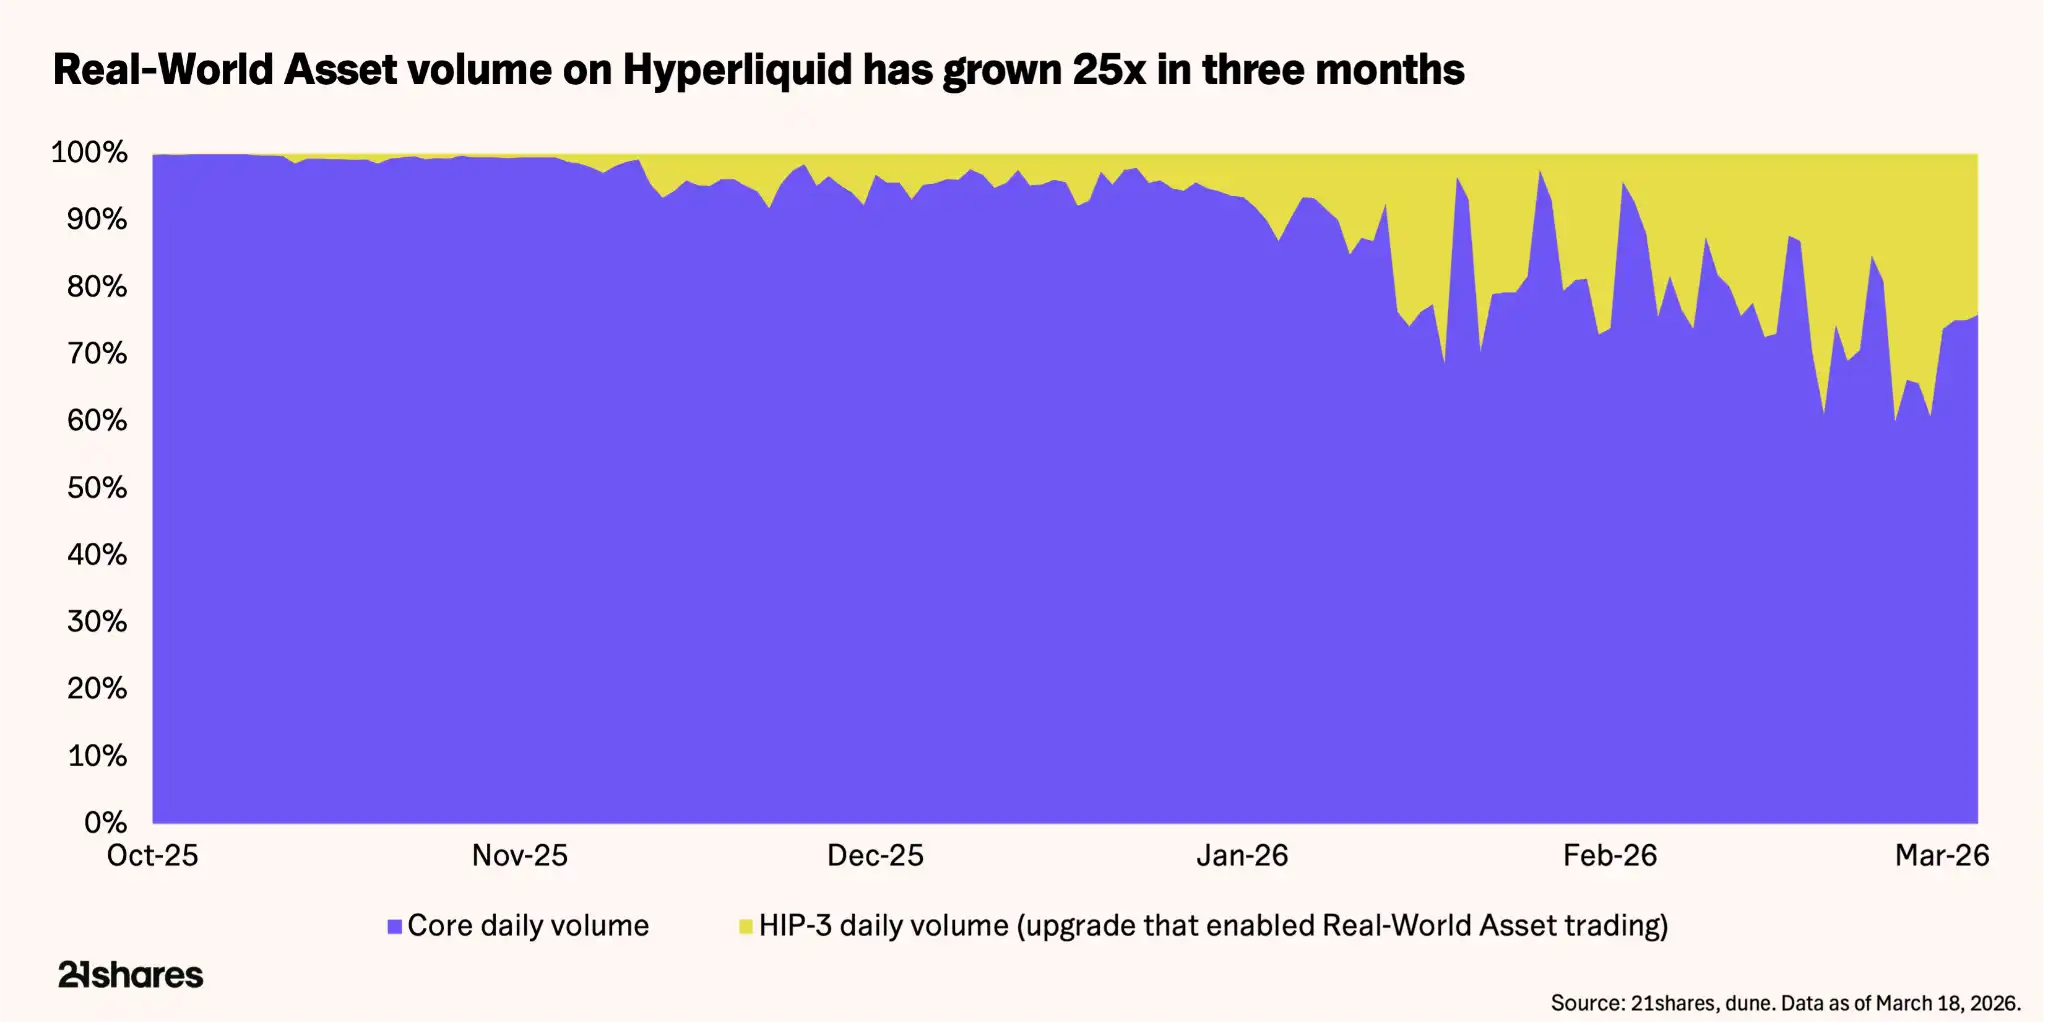
Рисунок: Сравнение трёх сценариев оценки (бычий/базовый/медвежий)
Медвежий сценарий: Если торговля нецифровыми активами охладится, выкуп может не компенсировать разблокировку токенов, а годовые доходы снизятся до диапазона $350-450 млн. При более консервативном мультипликаторе 10x — отражающем замедление роста и более высокое разводнение — рыночная капитализация составит около $3.5-4.5 млрд, что соответствует цене HYPE примерно $15-19, то есть откату на 51%-62% от текущего уровня. Но это ещё не учитывает диверсификацию доходов за счёт предстоящих рынков предсказаний и опционной торговли.
Рынок подтверждает наш бычий тезис: с начала года биткоин упал на 9%, а HYPE вырос более чем на 50%. Это расхождение обусловлено тем, что HYPE переходит на диверсифицированные доходы. HYPE не является безрисковым — он просто меняет крипто-бета риск на волатильность, обусловленную геополитикой. Сохранится ли эта тенденция, зависит от геополитической ситуации и эффективности работы команды.
Риски, которые необходимо учитывать
У HYPE есть несколько ключевых рисков, которые инвесторам необходимо сопоставлять с ростом протокола:
Централизация и векторы атак: Инциденты с атаками на токены JELLYJELLY и POPCAT в 2025 году едва не опустошили казну ликвидности на $230 млн, вынудив валидаторов вручную вмешаться для снятия активов с торгов. Хотя это было эффективно, это выявило, что платформа может действовать централизованно, когда под угрозой оказывается безопасность средств.
Регулирование: Hyperliquid по-прежнему блокирует пользователей из США, а сырьевые товары на блокчейне находятся в серой зоне с точки зрения регулирования. Для решения этой проблемы HYPE, возможно, потребуется получить лицензию, аналогично тому, как Polymarket приобрела регулируемое CFTC юридическое лицо для законной работы на американском рынке.
Изменение геополитической ситуации: Доходы HIP-3 выигрывают от глобальной напряжённости. Снижение макроволатильности может быстро нивелировать «геополитическую премию за волатильность (VIX)», которая в настоящее время стимулирует использование платформы, что, в свою очередь, повлияет на стоимость токена.
Эмиссия vs. Выкуп: Хотя протокол в настоящее время находится в состоянии чистого дефляционного давления, его способность поглощать постоянную разблокировку токенов полностью зависит от сохранения высоких объёмов торгов.
Заключение
Рынок нефти торгуется на блокчейне не из-за идеалов децентрализации, а потому что все другие рынки закрыты. Это различие — практичность, а не идеология — является сущностным отличием нынешнего момента Hyperliquid от предыдущих нарративов DeFi.
При оценке в 13-15x годовых доходов рынок оценивает HYPE как законный биржевой бизнес, а не как спекулятивный альткоин. Запас прочности зависит от того, сохранятся ли объёмы торговли не-криптоактивами, сможет ли выкуп продолжать опережать разводнение и насколько эффективно будут внедряться новые функции.
Как минимум, сами данные заслуживают того, чтобы вы внимательно взглянули на HYPE. Стоит ли включать его в свой инвестиционный портфель — зависит от вашей оценки мира за пределами графиков.