Author: 21shares Research
Compiled by: Jiahuan, ChainCatcher
Introduction
Welcome to the mid-year update of State of Crypto. In this report, we revisit our predictions for 2026 made at the start of the year to see how they have held up after six months.
At the beginning of the year, we proposed that 2026 would be the year the crypto industry transitions from narrative-driven to fundamentals-driven.
Specifically, we identified four core drivers: structural inflows into regulated exchange-traded funds (ETFs) and exchange-traded products (ETPs), enterprise adoption of stablecoins, tokenization of commodities and pre-IPO companies, and on-chain use cases moving from concept to scale.
Six months later, reality is more complex than we anticipated. Some calls have arrived ahead of schedule: annual trading volume in prediction markets is already close to our full-year target, consolidation in Ethereum scaling solutions is playing out as we expected, tokenized commodities are gaining renewed attention in gold and energy due to geopolitical hedging needs, the pre-IPO market is moving mainstream with a pipeline of marquee projects from SpaceX to Anthropic taking shape.
The overall direction we outlined for 2026 remains largely intact, but some predictions are ahead of schedule, while others are lagging. In this report, we take an objective look at each forecast, presenting where the market actually stands, not where we wish it were.
I. The BTC Cycle: Still Unbroken
Prediction at the start of the year: Bitcoin's four-year cycle is over.
Entering 2026, we thought Bitcoin's four-year cycle might be over. Six months later, we must be candid: the price action looks familiar. After peaking around $126,000 in October 2025, BTC pulled back sharply, a pattern highly consistent with previous post-halving cycles.
But this doesn't mean our call was entirely wrong. The market structure has indeed changed: ETF holdings are increasingly institutionalized, and the current drawdown of around 50% is far less severe than the 80%+ bear market drops of the past.
Bitcoin has also not broken below the global average cost basis of approximately $54,000, avoiding the kind of total capitulation selling seen in previous bear cycles. These are signals of a more mature market with stickier capital.
But stronger fundamentals do not mean BTC has become a "cycle-less" asset. Like most asset classes, cycles persist; only their shape changes. Investors ultimately still look at price and relative opportunity costs. Commodities, US stocks, and AI-themed stocks are all competing for the same pool of capital, and this still influences behavior.
Taken together, the continued expansion in adoption keeps us cautiously optimistic. The number of wallets holding BTC continues to grow. Our year-end base case expectation is for Bitcoin to return near $100,000, not to break to new all-time highs.
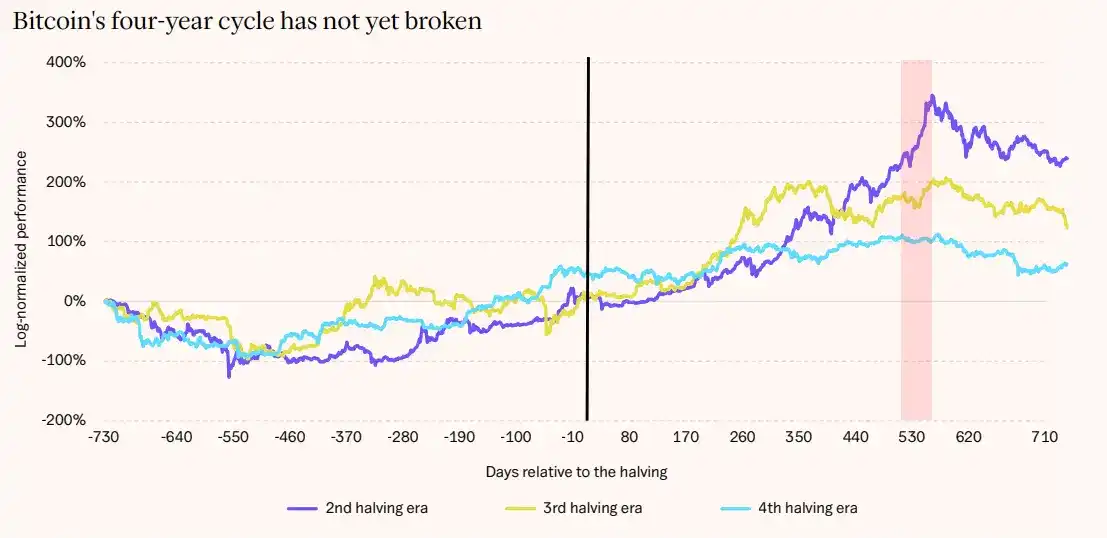
[Chart 1: Bitcoin's Four-Year Cycle Not Yet Broken]
Chart Description: Plots Bitcoin's log-normalized performance in the 2nd, 3rd, and 4th halving cycles, with the halving day as the origin (x-axis: days since halving, y-axis: log returns). The trajectory of the 4th halving cycle closely resembles that of the previous two cycles.
Data Source: Glassnode, 21Shares
II. Crypto ETPs: AUM Declines Instead of Rising
Prediction at the start of the year: Global crypto ETP AUM will surpass $400 billion.
We predicted that global crypto ETP assets under management (AUM) would exceed that of the largest and best-known Nasdaq-100 ETF (QQQ) by year-end. This forecast was built on an expected starting point of $250 billion. The reality is that AUM was around $172 billion at the end of 2025, lower than expected, and has been declining since the start of the year.
As of May 2026, total global crypto ETP AUM is approximately $140 billion, down about 15% year-to-date, with BTC ETPs accounting for roughly $110 billion of that.
The headline numbers look bad, but the underlying support is noteworthy. Despite net outflows of around $3 billion from US spot BTC ETFs year-to-date, BTC-denominated holdings remain near all-time highs, just over 1.25 million BTC, only about 8% below the peak. Investors are navigating the volatility or quietly building strategic positions, even with BTC far from its highs.
The product landscape is also maturing rapidly. The SEC's uniform listing standards have turned last year's backlog of applications into a wave of new products beyond just BTC and ETH.
Hyperliquid stands out in particular: the US spot ETF tracking this asset attracted over $150 million in net inflows in less than a month since launch, demonstrating that traditional capital is still flowing towards digital assets showing fundamental growth, even in a weak broader market.
Meanwhile, Morgan Stanley launched the first bank-sponsored spot BTC ETF in April, bringing one of the largest US advisor networks into the asset class. BlackRock and Goldman Sachs are racing to launch options-based BTC yield strategy ETFs, expanding the crypto product matrix beyond pure Delta One exposure.
The structural drivers remain. Institutional adoption is advancing, and regulatory momentum is real. But global ETP AUM largely follows the BTC price. Reaching our initial target would require a combination of significant price recovery and sustained net inflows simultaneously.
For reference, QQQ, propelled by the strength of AI and tech stocks, now boasts nearly $500 billion in AUM. Closing this gap is not impossible, but the combination of required conditions suggests this story more likely belongs to the next cycle.
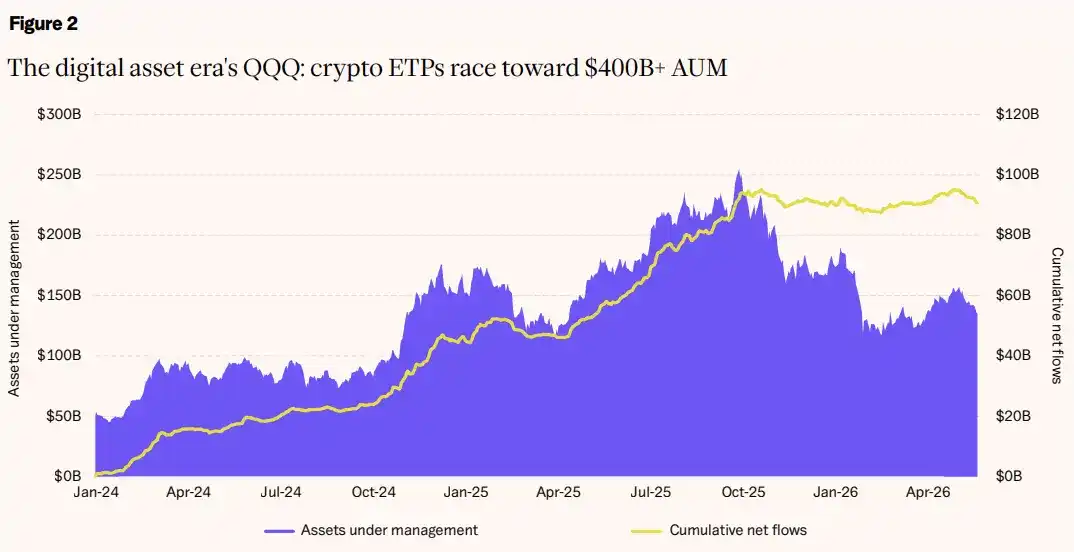
[Chart 2: The QQQ of the Digital Asset Age: Crypto ETPs Compete for Over $400 Billion AUM]
Chart Description: Left axis shows global crypto ETP Assets Under Management (AUM); right axis shows cumulative net inflows. From January 2024 to May 2026, AUM peaked in mid-2025 and subsequently declined, but cumulative net inflows remain elevated.
Data Source: Bloomberg, 21Shares
III. Stablecoins: $1 Trillion Target Arrived at Least a Year Early
Prediction at the start of the year: Stablecoin supply will reach $1 trillion.
Our prediction that stablecoin supply would reach $1 trillion was based on the assumption that regulatory clarity would unlock large-scale institutional and corporate adoption. Clarity has indeed arrived, but only partially.
The GENIUS Act was signed into law in July 2025, establishing the first federal stablecoin framework in the US. The EU's MiCA regulation is fully effective, with 14 licensed issuers and roughly 20 compliant stablecoins in circulation. The infrastructure is in place: total supply is approximately $320 billion, a significant increase from a year ago, but still only a third of the $1 trillion target.
The second step of regulatory clarity has been slower. The CLARITY bill has stalled for months, primarily over how to treat yield-bearing stablecoins, with banking groups warning that deposit-like yields could siphon funds from traditional lenders.
In mid-May, a compromise limiting passive, deposit-like yields passed the Senate Banking Committee, but this delay has dampened the near-term prospects for what could have been the biggest growth engine for the category.
Overshadowed by the headline number is genuine resilience. Stablecoin supply contracted over 30% during the last bear market; this time, supply continues to hit new all-time highs even as the market weakens, and far less new capital has entered the ecosystem than in the last cycle. For us, this is the strongest evidence of stablecoins as a core crypto use case: demand no longer relies on the cycle.
Growth is also expanding beyond the US dollar. The circulating supply of non-USD stablecoins has reached an all-time high of around $2 billion for the first time, growing over 40% year-to-date.
Traditional giants are also moving: Visa, Mastercard, Stripe, and Coinbase are reportedly jointly preparing a US stablecoin platform; Japan's three megabanks — MUFG, SMBC, and Mizuho — announced they will jointly issue trust-based stablecoins by early 2027, targeting $7 billion in issuance by 2028.
When payment and banking giants start building their own rails, whether adoption will arrive is no longer the question.
A more realistic year-end range is $400-$600 billion, reflecting steady growth in trading, cross-chain transfers, and remittances, rather than the explosive surge we originally anticipated. The direction is correct, but the timeline ran ahead of the adoption curve.
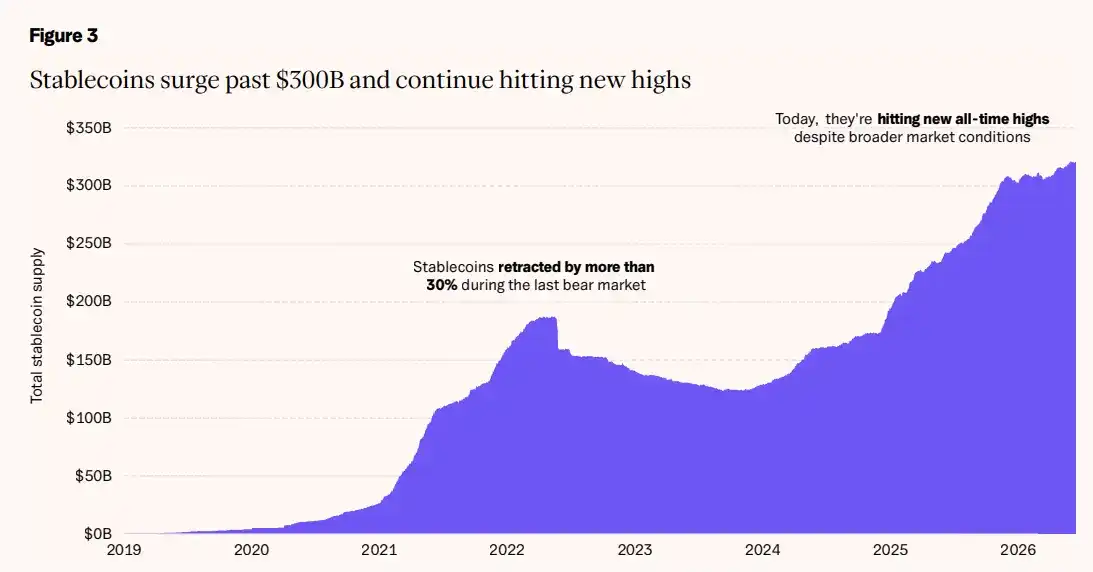
[Chart 3: Stablecoins Break Through $300 Billion and Continue Setting New All-Time Highs]
Chart Description: Change in total stablecoin supply from 2019 to 2026. Supply contracted over 30% during the 2022-2023 bear market, while currently, despite a down market environment, supply continues to reach new all-time highs.
Data Source: DeFiLlama, 21Shares
IV. DeFi: Security Incidents Dent Growth
Prediction at the start of the year: DeFi TVL will exceed $300 billion.
We predicted that DeFi Total Value Locked (TVL) would exceed $300 billion in 2026, more than doubling from the ~$130 billion at the time. This growth has not materialized. TVL sits around $140 billion, with its growth trajectory interrupted by a brutal year for security.
More than 50 security incidents have occurred so far in 2026, with cumulative losses exceeding $840 million, an increase of about 70% year-over-year. April was the single worst month in DeFi history.
A single incident at KelpDAO drained nearly $300 million, triggering over $13 billion in outflows within two days, severely denting institutional confidence in the restaking sector. We view these as growing pains of an emerging industry, not a final verdict, but they have certainly forced a lot of capital to the sidelines.
Beneath the surface weakness, capital is concentrating towards applications with real revenue and user bases.
Hyperliquid, the on-chain, full-financial asset exchange, continues to generate over $1 billion in annualized revenue, returning the majority of it to token holders via buybacks, and is up over 100% year-to-date.
Morpho, the lending engine behind Coinbase's crypto-collateralized loans, has become the highest-valued lending company in the space with a market cap over $1.2 billion, surpassing Aave. Its deposit base has recovered to near its all-time high of around $8 billion, with Apollo committing to acquire up to 9% of its token supply. Select protocols with genuine revenue are attracting outsized capital even in weak conditions.
The massive liquidity surge needed to push TVL to $300 billion hasn't arrived. Significant acceleration is more likely in 2027, before market conditions improve and confidence repairs.
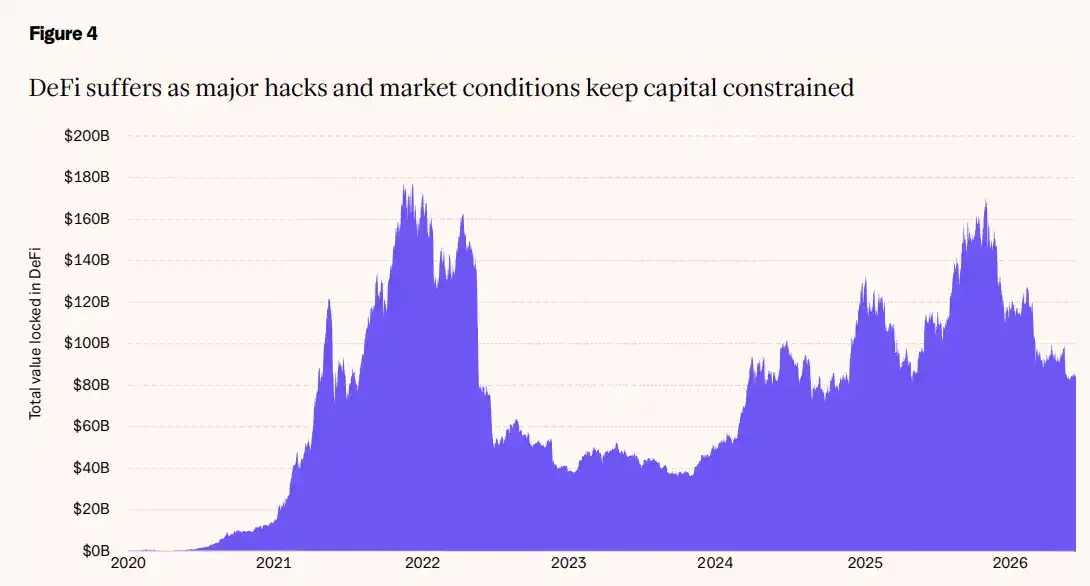
[Chart 4: DeFi Capital Constrained by Major Security Incidents and Market Conditions]
Chart Description: Change in DeFi Total Value Locked (TVL) from 2020 to 2026. TVL peaked in late 2021, declined sharply, partially recovered in 2024-2025, and has remained around $140 billion in 2026.
Data Source: DeFiLlama, 21Shares
V. Digital Asset Treasuries: The Weak Accelerating Their Exit
Prediction at the start of the year: Digital asset treasury companies' crypto holdings will exceed $250 billion, but only a few will survive.
We predicted that the total value of crypto holdings by digital asset treasury companies would exceed $250 billion by year-end, while warning that only a few would survive. On the second point, we've been proven right. On the first, the market is halfway there, but heavily reliant on price appreciation to close the gap.
Approximately 200 publicly traded companies hold BTC as a strategic asset, with combined holdings nearing 1.28 million BTC, already surpassing the 1 million milestone we highlighted last year.
The issue is valuation: at current prices, the total value of corporate crypto treasuries is about $100 billion, far from the $250 billion target. Strategy still dominates overwhelmingly, holding over 845,000 BTC at an average cost of ~$75.7k, representing over 4% of the total BTC supply, but has been in an unrealized loss position as of mid-2026.
The consolidation we pointed to is happening, just not in the form of well-capitalized players acquiring distressed assets, but rather by the weak naturally exiting.
Smaller treasury firms with market caps below the value of their BTC holdings, locked out of fundraising markets, are being forced to sell the very assets they were meant to accumulate.
Nakamoto Holdings sold BTC at an ~40% realized loss to maintain operations, with its stock down ~99% from its 2025 peak.
MARA liquidated over 15,000 BTC to pay off convertible bonds.
Strategy also executed its first BTC sale in four years (32 BTC to pay preferred stock dividends). The amount was negligible (less than 0.004% of holdings), and buying resumed a week later, but it was symbolic: business obligations will compete with BTC accumulation.
Not every company that adopted the treasury model in 2025 has the capital structure or conviction to withstand a sustained pullback.
This stress is precisely the scenario our consolidation call anticipated. Among 18 major treasury firms, 13 have market caps below the value of their BTC holdings. Acquiring one effectively means buying BTC at a discount. Consolidation is starting from the deepest pockets.
Twenty One Capital (the second-largest treasury firm), backed by Tether, is progressing with a merger involving payments company Strike and miner Elektron Energy to create a vertically integrated BTC operating company. Notably, its market cap already exceeds the value of its BTC holdings, while most peers trade at a discount.
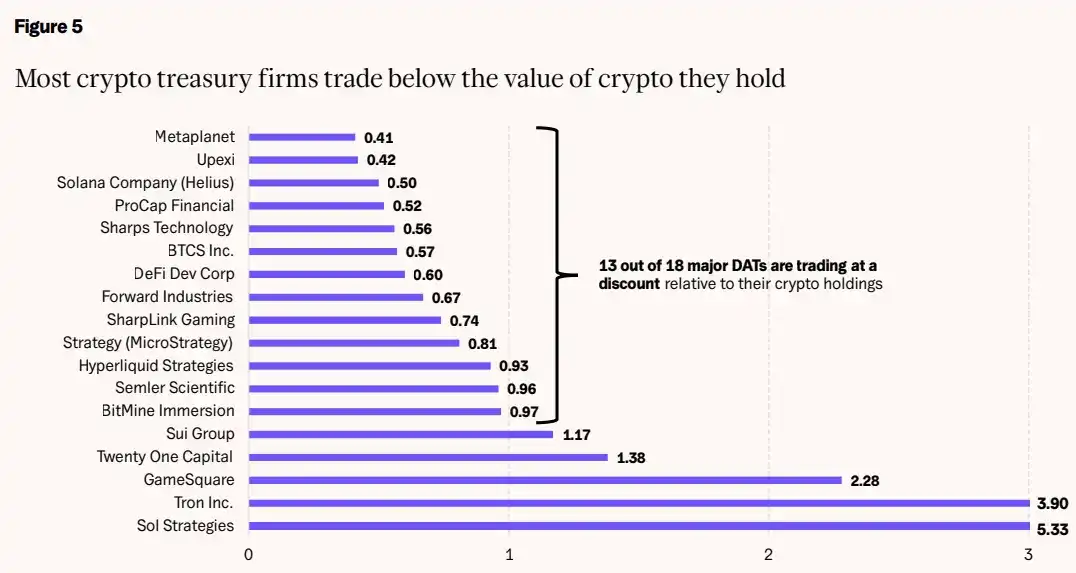
[Chart 5: Most Crypto Treasury Firms Trade at a Discount to Their Crypto Asset Value]
Chart Description: mNAV (Market Cap / Net Asset Value of Crypto Holdings) ratio for 18 major digital asset treasury companies.
Data Source: SEC EDGAR; CoinGecko; Yahoo Finance, 21Shares
VI. Prediction Markets: Half the Annual Target Achieved in Half a Year
Prediction at the start of the year: Prediction markets will bring millions of users on-chain, with annual trading volume reaching $100 billion.
We predicted prediction markets would reach $100 billion in annual trading volume. Progress has even exceeded our own expectations. As of the end of May, $57.5 billion has been traded, over half the annual target and more than ten times the volume from the same period last year. At the current pace, $100 billion would be achieved around early Q4.
We think it will be faster. Catalysts for event-driven trading are concentrated in the second half of the year: the FIFA World Cup is underway, and US House and Senate midterm elections are in November.
Activity has cooled off since the January peak (over $15 billion in a single month), but this is the natural rhythm of an event-driven market between major events. The last time event flow was concentrated (Q4 2025), monthly volume tripled. If a similar surge occurs in H2, the year could head towards $200 billion.
Our expected drivers are materializing one by one. Regulatory clarity arrived: the CFTC closed its investigations into Polymarket and Kalshi; PredictIt won its court case; and Intercontinental Exchange committed up to $2 billion to expand Polymarket.
Platform integration followed: Google and X embedded real-time odds into their own platforms. And 2026 happens to provide the political and macroeconomic volatility these markets were built for.
The competitive landscape is also broadening. Hyperliquid entered the prediction market space via HIP-4 in May. Its volume remains far below Polymarket and Kalshi's for now, but within weeks of launch, it was processing about a fifth of BTC outcome contract trading volume.
Its design points in a unique direction: a trader-focused, composable financial outcome market, a use case beyond the typical audience of Polymarket or Kalshi. The pie is getting bigger, with different segments driven by different forces.
While a US federal framework is settled, regulators elsewhere are drawing the opposite conclusion: Spain blocked both platforms citing a lack of gambling licenses in late May; Brazil, India, Indonesia, and Portugal have also restricted access this year; and some US states are challenging sports event contracts under their own betting-related laws.
These restrictions haven't materially impacted volume yet, as the growth engine remains the US, but the issue is being resolved market by market.
Nevertheless, the biggest events of H2 are yet to come. We expect 2026 to significantly surpass the original forecast, cementing prediction markets alongside stablecoins and tokenization as one of crypto's clearest product-market fits.
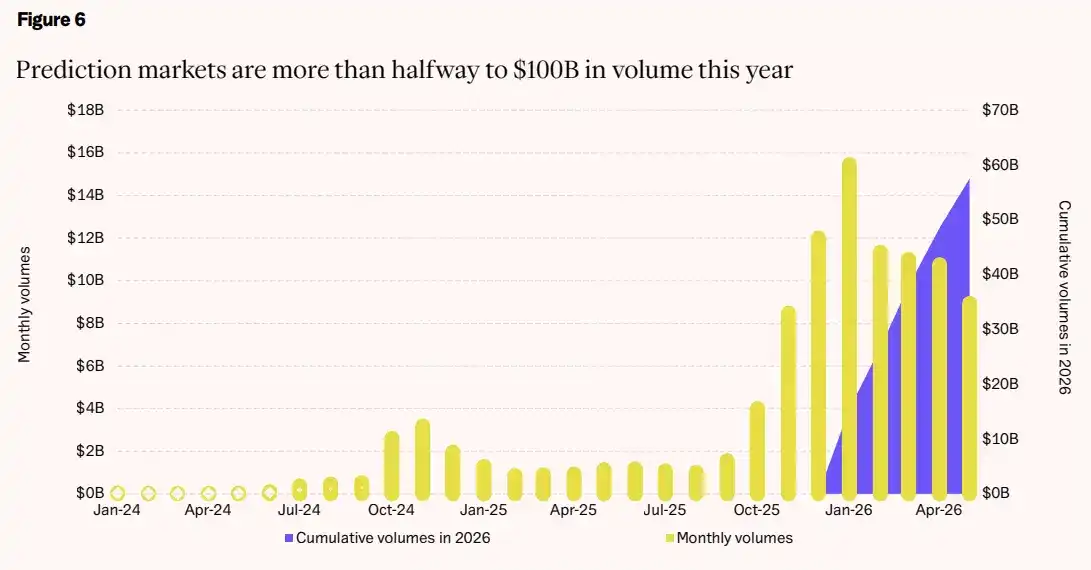
[Chart 6: Prediction Markets Have Already Traded Over Half of Their $100 Billion Annual Target This Year]
Chart Description: Left axis shows monthly trading volume (bars); right axis shows cumulative 2026 trading volume (line). Explosive peaks occurred in Q4 2025 and January 2026, followed by a pullback. Cumulative volume reached ~$57.5 billion by end of May.
Data Source: Dune, 21Shares
VII. The AI Agent Economy: Still in Its Infancy
Prediction at the start of the year: The AI agent economy becomes a reality in 2026.
We predicted that AI agents would become active in 2026, directly interacting with blockchain applications to manage yield, automate payments, optimize liquidity, and minimize human intervention. This prediction is directionally correct: blockchain infrastructure is ready, first products are live, but mass adoption hasn't arrived.
In fact, infrastructure progress has been faster than we expected. ERC-8004 (the identity and reputation layer for autonomous agents on Ethereum) went live on mainnet in January and has begun deploying to other EVM-compatible networks.
The x402 protocol revived the HTTP 402 "Payment Required" status code, designed at the birth of the web but never used, for machine-to-machine payments. It has grown from an internal Coinbase project to a standard co-governed by Coinbase, Cloudflare, and Stripe, with backing from AWS, Google, Mastercard, Microsoft, and Visa.
Traditional finance is also converging in the same direction. Visa, Mastercard, and Stripe are each building their own agent payment protocols. In March 2026, Santander and Mastercard completed Europe's first end-to-end real-time payment executed by an AI agent.
Volumes remain tiny. The x402 protocol's cumulative transaction volume is still in the tens of millions of dollars, more proof-of-concept than mature economy. What's missing is the killer app or integration that makes the agent economy as intuitive as stablecoin transfers or prediction market trading. That breakthrough may still be ahead, but we believe 2026 will be remembered as the "foundation-laying year."
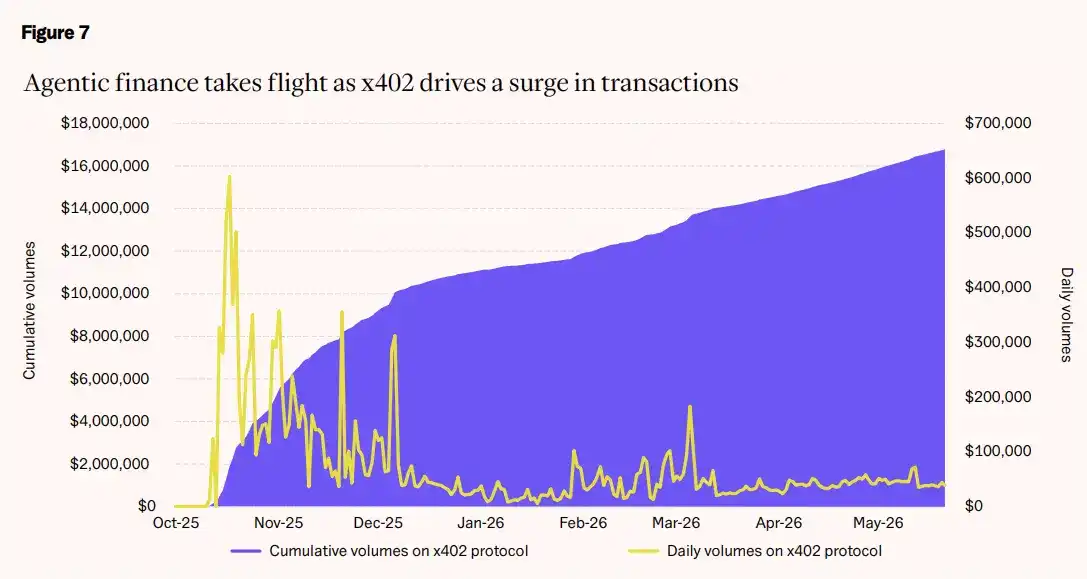
[Chart 7: AI Agent Finance Takes Off, x402 Drives Transaction Surge]
Chart Description: Left axis shows x402 protocol cumulative transaction volume (line); right axis shows daily transaction volume (line). From October 2025 to May 2026, cumulative volume grew from 0 to ~$17 million, with daily volume peaking at ~$600k in January 2026.
Data Source: Dune, 21Shares
VIII. Ethereum L2s: Consolidation Proceeds as Expected
Prediction at the start of the year: Most Ethereum scaling solutions will die out in 2026.
We predicted that most scaling solutions (Layer 2, L2) would not survive 2026, with market share concentrating among a few dominant players. This call has landed.
In February, it received an unexpected endorsement: Ethereum co-founder Vitalik Buterin publicly declared that "the rollup-centric roadmap is no longer tenable."
His reasoning aligned with our analysis: most L2s have stagnated on decentralization and sovereignty, while Ethereum itself is steadily scaling. Scaling solutions without differentiation lose their reason for being. His advice: "differentiate or die."
The data bears this out. The top 5 L2s now command nearly 90% of daily active users in the ecosystem. Asset concentration is similarly stark: Base and Arbitrum control about 70% of total value.
The winners share common traits: built-in distribution channels, credible paths to decentralization, and business models that accumulate value rather than "renting" users with incentives.
The remaining 70+ scaling solutions split the leftovers, with over 50 already irrelevant by any meaningful activity metric. Some once well-known chains have only a few hundred daily active users, running on treasury funds rather than real demand.
However, the elimination tournament isn't over. The final stages (acquisitions, formal shutdowns, migrations to app-chains) are still underway, and we expect acceleration in the second half of the year.
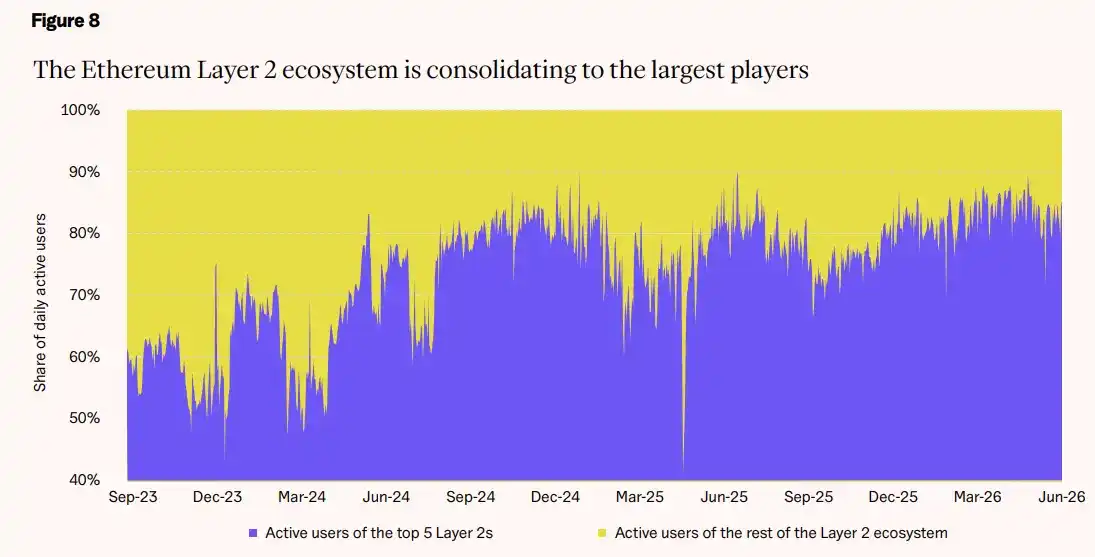
[Chart 8: Ethereum Layer 2 Ecosystem Concentrating Towards the Largest Players]
Chart Description: Comparison of daily active user share between the top 5 L2s and the rest of the L2 ecosystem from September 2023 to June 2026. The share of the top 5 L2s increased from ~70% to nearly 90%.
Data Source: TokenTerminal, 21Shares
IX. Compliant Token Offerings: Platform Ready, Capital Still on the Sidelines
Prediction at the start of the year: Compliant token offerings become a mainstream capital market in 2026.
We predicted that compliant token sales would become a mainstream capital market in 2026, a compliant revival of the 2017-2018 wave, built on transparency and institutional backing. The market exists, but whether it can be called "mainstream" is a harder question.
Infrastructure built out faster than expected. Coinbase acquired Echo for $375 million and began hosting token sales on its own platform, marking the first time US retail investors could legally participate since 2018.
Benchmark cases proved the possibility: high-performance chain Monad raised $216 million from 86,000 buyers on Coinbase. The $50 million round for Ethereum scaling network MegaETH saw $1.39 billion in interest. In Europe, Legion completed multiple compliant offerings across DeFi, DePIN, and infrastructure under the MiCA framework.
Platform quality is vastly improved from 2017: KYC, AML, structured allocations, lockups, and anti-hype rules are now standard. Compliant platforms have captured the majority of fundraising amounts in most months, a complete reversal from the unregulated frenzy of the previous wave.
But sobering limitations exist. Excluding the November peak driven by Monad, monthly fundraising amounts have trended down, hitting the lowest levels for compliant platforms in recent months.
The biggest drag isn't regulation but opportunity cost: AI, robotics, and space stocks have created unprecedented returns in public markets, siphoning off risk capital that might have otherwise flowed into token offerings.
Deal flow has decreased since the November peak, and capital raised through these platforms remains in the hundreds of millions of dollars, a small fraction of the ~$30 billion total raised in the 2017 wave. The investor base, while enthusiastic, remains largely crypto-native.
"Mainstream" status means compliant token sales stand alongside traditional IPOs as an accepted capital formation tool. That will likely require more years of case-building, track records, and broader retail awareness.
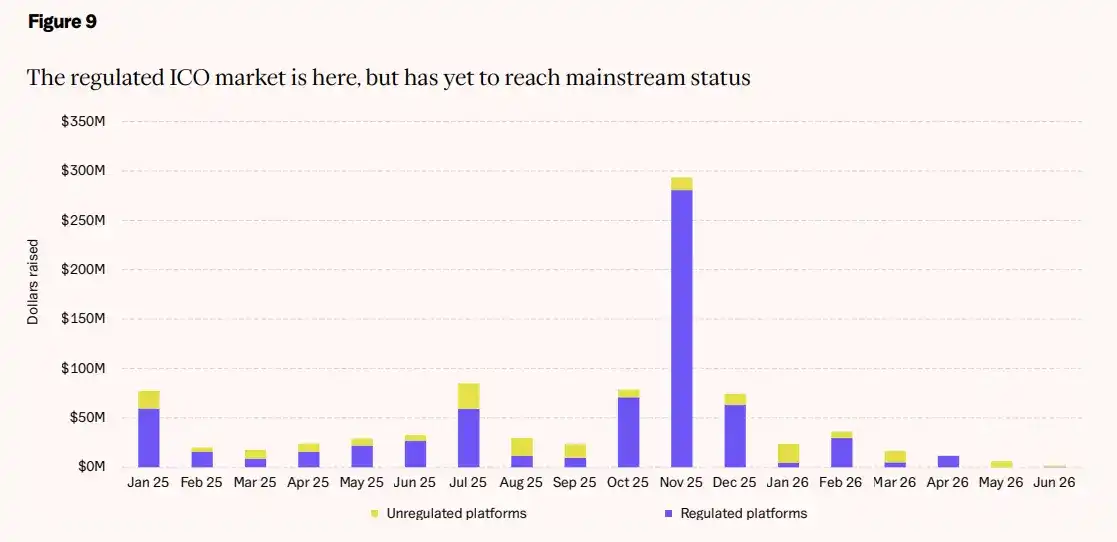
[Chart 9: The Compliant Token Offering Market Exists, But Has Not Yet Reached Mainstream Status]
Chart Description: Monthly fundraising amounts by non-compliant platforms (blue) and compliant platforms (yellow) from January 2025 to June 2026. A peak of ~$300 million occurred in November 2025 (driven by Monad), followed by a consistent decline. Compliant platforms have captured the dominant share in most months.
Data Source: CryptoRank, Messari, The Block, Company Disclosures, 21Shares
X. Tokenized Assets: Rapid Growth, Target Still Distant
Prediction at the start of the year: The total value of tokenized assets will exceed $500 billion.
We predicted that tokenized real-world assets would exceed $500 billion by year-end. Whether that number looks hopeless or within reach depends entirely on the measuring stick.
Measured by public chain distribution, the market was around $31 billion as of early June, with ~$15 billion in tokenized US Treasuries and ~$5 billion in commodities, a mere 6% of the target.
But if assets represented on-chain (like securities already circulating as 24/7 collateral on permissioned institutional networks such as Canton) are included, the figure nears $350 billion. The gap between the two numbers is the core narrative of tokenization in 2026: the speed at which institutional assets are being put on-chain is roughly ten times that of on-chain native distribution. "Representation" is the entry point; "distribution" is the destination.
This entry point will widen noticeably in the second half. Canton has been operational for a while (industry participants were already funding tokenized Treasuries 24/7 on it last year), but the qualitative leap comes from the DTCC (Depository Trust & Clearing Corporation).
This institution, which custodies over $100 trillion in securities, is beginning to tokenize US Treasuries held at the DTC onto a blockchain. Limited production trades are scheduled for July, with the full platform launching in October. Backed by an SEC no-action letter, this marks the first time core US market infrastructure has been cleared to put assets on-chain.
Our sub-predictions are progressing at different speeds. Tokenized stocks have doubled to ~$1.4 billion, still far from the $10 billion path we envisioned, but the pipeline is the strongest: Nasdaq received SEC approval in March to put stocks on-chain, with Kraken as the global distributor; the NYSE is also building its own tokenized settlement platform.
The CLARITY bill (which we expect to unlock bank issuance and custody of tokenized instruments) has passed the Senate Banking Committee, awaiting a full vote.
Reaching $500 billion in distributed value by December would still require a very unconventional acceleration. But the institutions laying the pipes are precisely those that run the existing financial system. That matters.
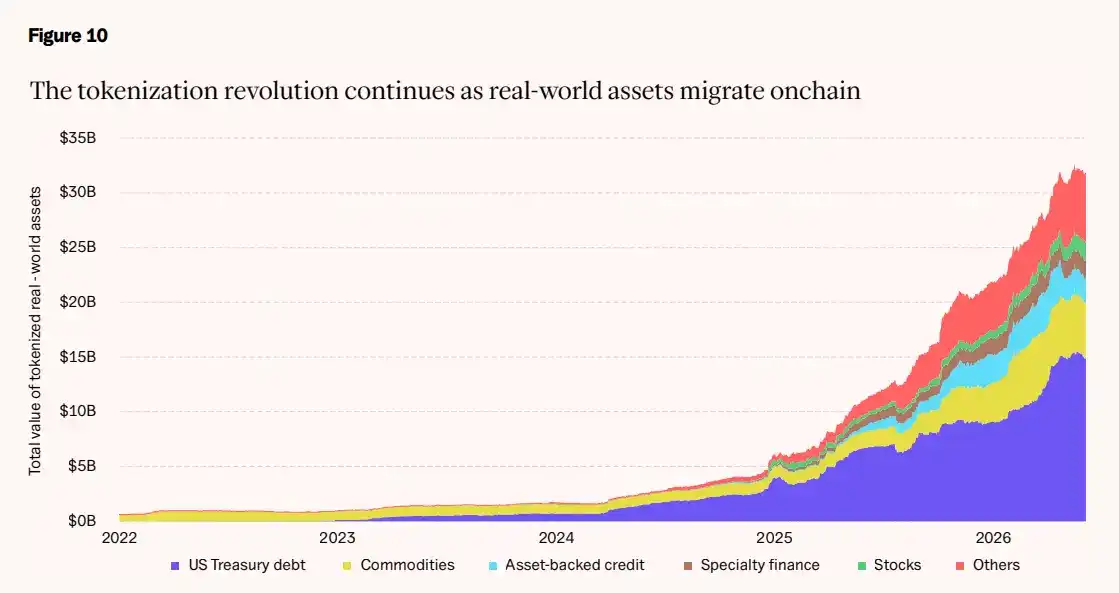
[Chart 10: The Tokenization Revolution Continues, Real-World Assets Accelerate On-Chain]
Chart Description: Composition of the total value of tokenized real-world assets from 2022 to 2026. Includes US Treasuries (largest share), Commodities, Asset-Backed Credit, Special Finance, Stocks, and Other categories. Total value grew from less than $5 billion at the end of 2022 to ~$31 billion in mid-2026.
Data Source: rwa.xyz, 21Shares