What’s Behind Bitcoin’s Drop To $81K? Glassnode Provides On-Chain Insights

bitcoinistPublished on 2026-01-31Last updated on 2026-01-31

Abstract

Following a brief rebound to $90,000, Bitcoin experienced a sharp decline to $81,000, driven by several on-chain factors. According to Glassnode, long-term holders distributed an average of 12,000 BTC daily over the past month, creating significant selling pressure. This was compounded by net outflows from US spot Bitcoin ETFs, reducing institutional demand to absorb the sell-off. Miners also contributed by consistently sending BTC to exchanges, indicating structural weakness. Additionally, over $300 million in long positions were liquidated, amplifying downside momentum. With subdued spot demand and defensive options market sentiment, Bitcoin faces challenges below key resistance levels until significant demand returns. Currently, Bitcoin trades at $84,095, up over 1% in 24 hours.

Following a brief price rebound from $86,000 to $90,000 early in the week, it appeared that Bitcoin was experiencing its routine movement within the consolidation range. However, the market is on edge with curiosity about what is happening with the flagship cryptocurrency, especially after its swift decline to $81,000. A couple of fresh on-chain perspectives have emerged, delving into the underlying dynamics of the BTC market.

On-Chain Signals Behind Bitcoin’s Bearish Move

In a recent post on the social media platform X, crypto analytics firm Glassnode outlined a confluence of on-chain events justifying Bitcoin’s impulsive move to the downside. The analysis began with results from the Spent Volume by LTH/STH metric.

This metric has shown that, over the past 30 days, Bitcoin’s Long-term holders have been heavily distributing their share of BTC. According to Glassnode’s data, over 12,000 BTC per day (on average) has been distributed over the past 30 days — an equivalent of 370,000 BTC per month. Expectedly, distributing large amounts of BTC, in turn, reflected on the price as considerable selling pressure.

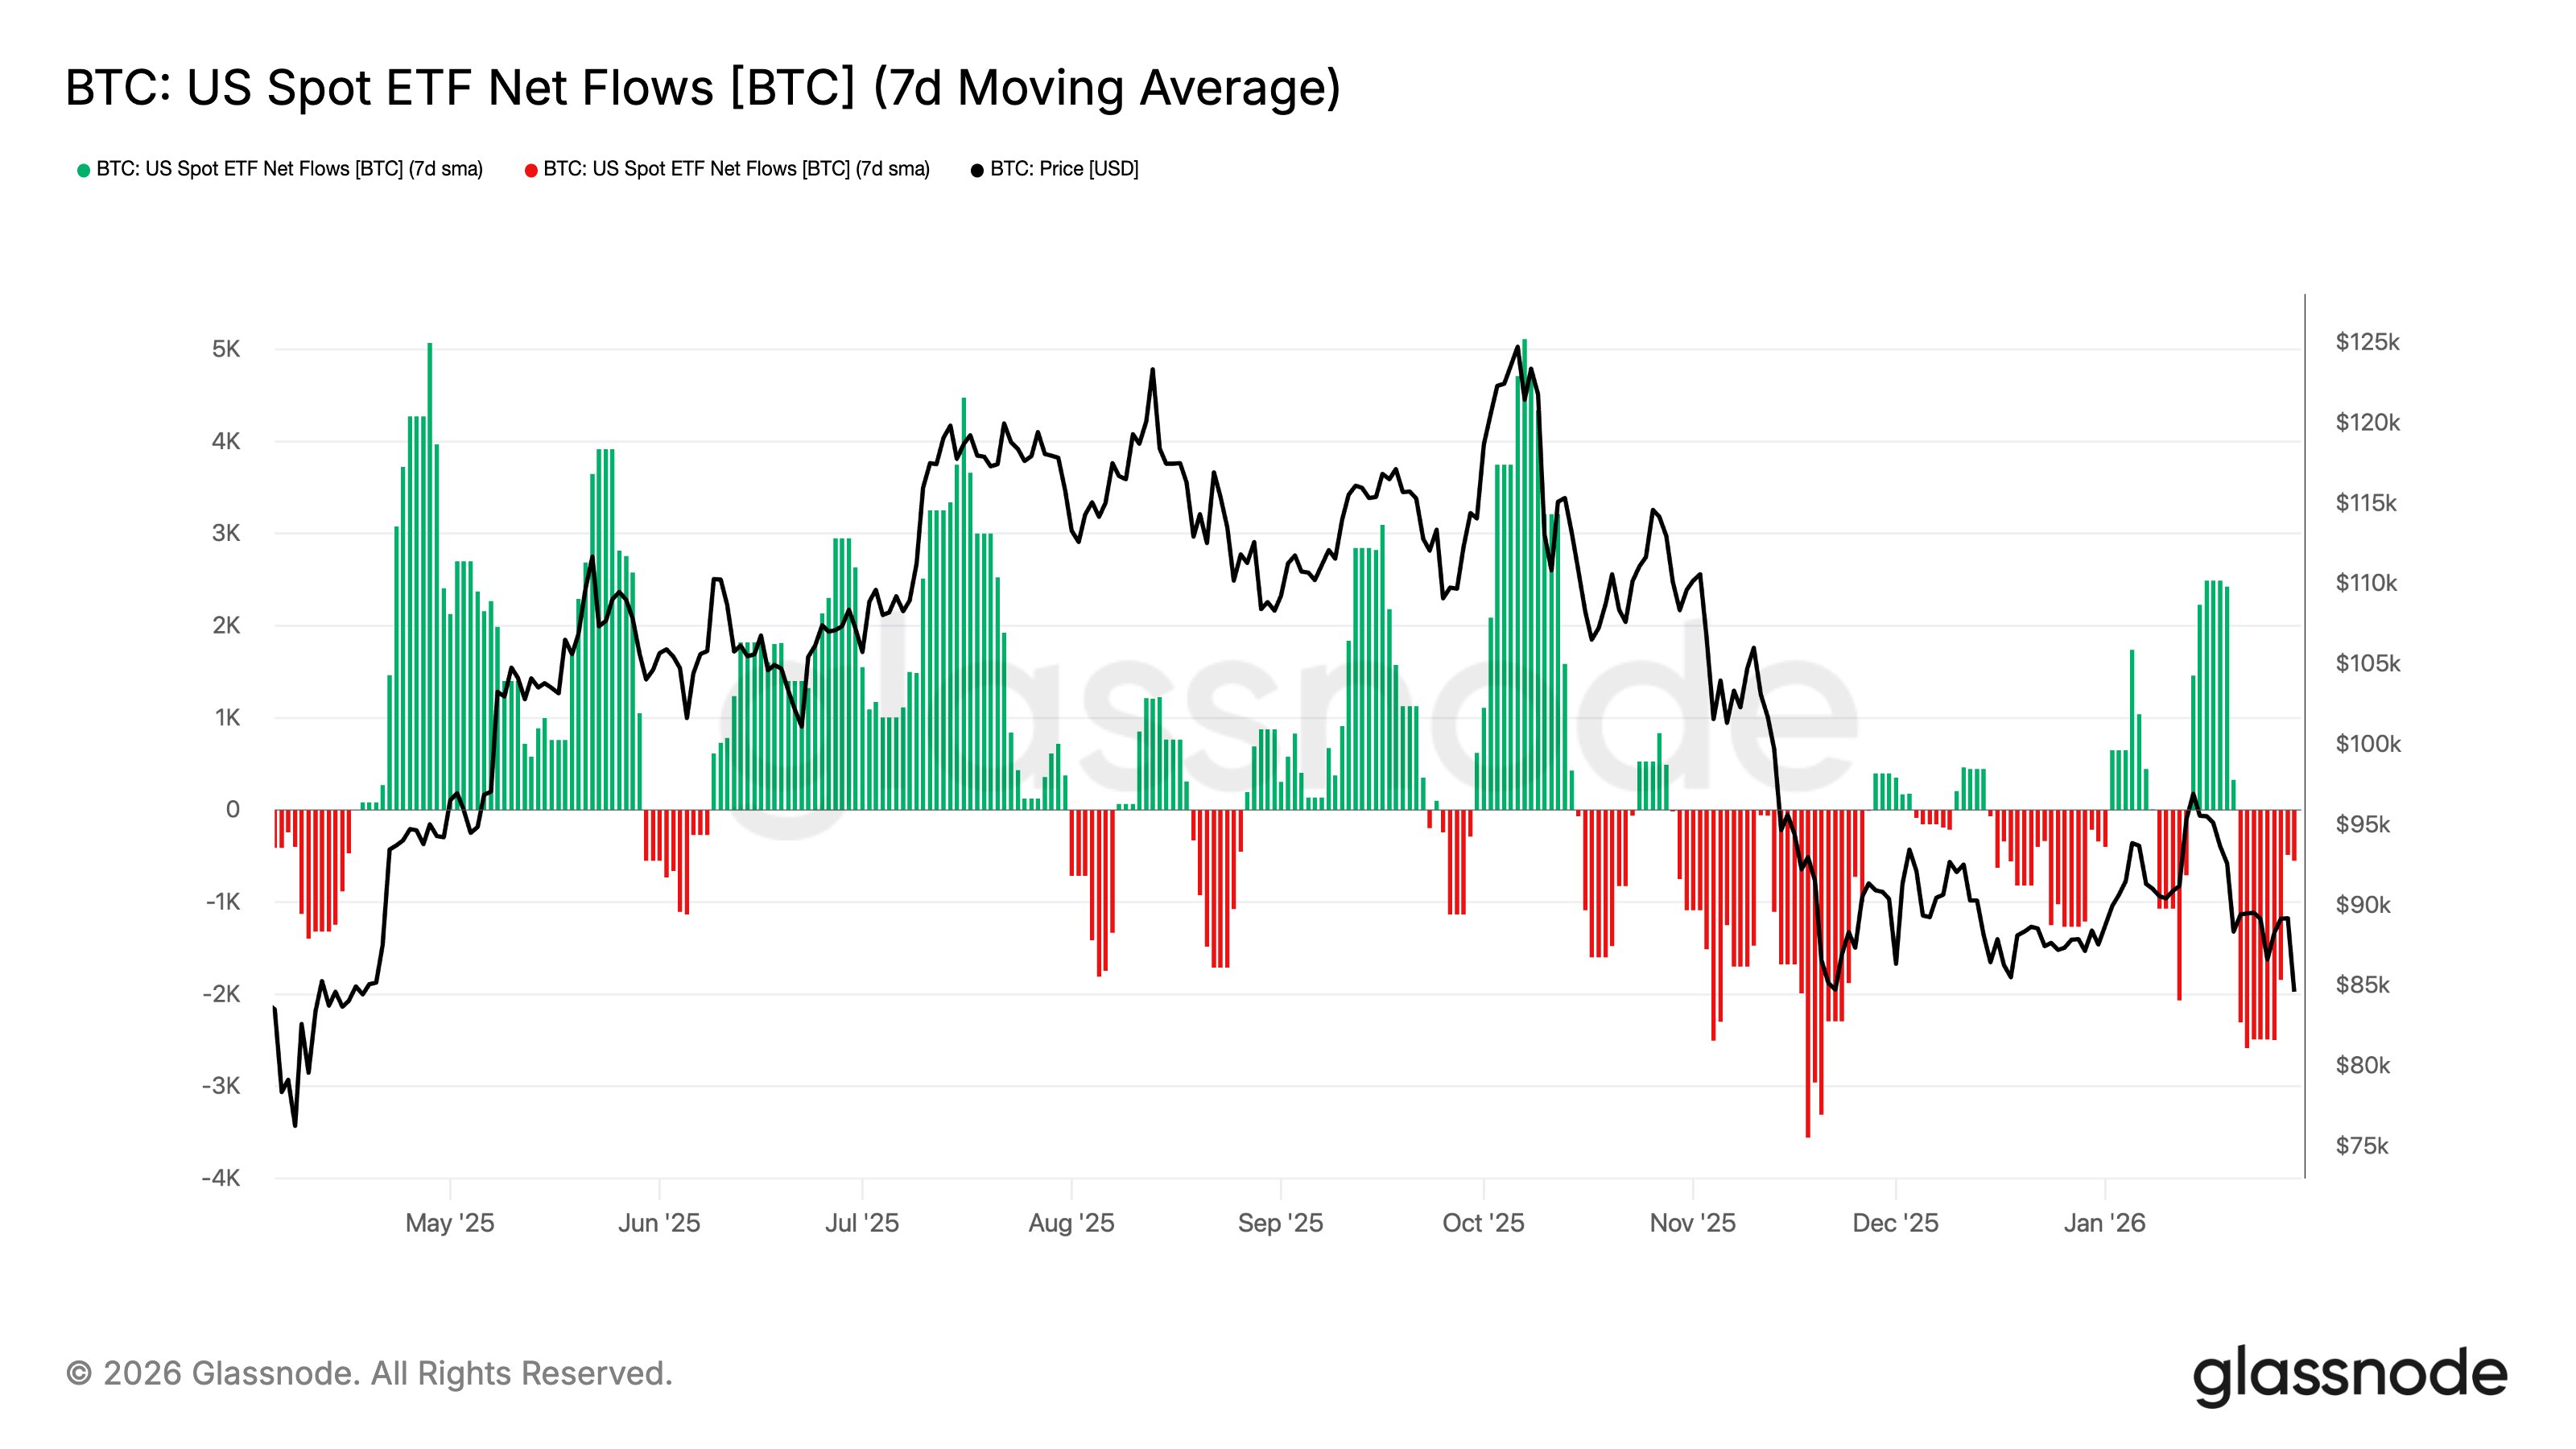
However, distribution among LTHs is not the only event that happened; US spot Bitcoin ETFs also added to the bearish setup, as they have recorded multiple net outflows over the past few weeks. This means that there has been less institutional demand to cushion the LTH sell-off.
Source: @glassnode on X

When demand gaps appear amid ongoing LTH-selloffs, the BTC price can be expected to fall freely, especially in the event that bearish momentum enters the market. Hence, this could have played a role in the recent move to the downside.

The long-term holders are not the only ones who sold; the Net Transfer Volume From/To Miners metric shows that Bitcoin’s miner behavior also reinforces the weakness of the market structure. Glassnode reported that miners have been consistently sending their BTC to exchanges, adding to the structural bearish pressure, as positive exchange inflows often signal growing interest in offloading assets.

Derivatives market dynamics also played their role in intensifying the BTC price decline. As the flagship cryptocurrency lost its previous footing, there was a wave of long liquidations that followed suit. Glassnode highlighted that more than $300 million was liquidated in this move. When long positions are forcefully closed, as in this cycle, downside momentum is usually amplified, further pushing prices downwards.

With options market defensive rather than optimistic in their speculation, and spot demand subdued, it is safe to conclude that the Bitcoin market stands at a critical phase. Until significant demand enters the market, it is likely that Bitcoin may face troubles beneath key resistance levels in the days to come.

Bitcoin Price At A Glance

At the time of writing, Bitcoin is valued at $84,095, reflecting an over 1% price jump in the past 24 hours.

The price of BTC on the daily timeframe | Source: BTCUSDT chart on TradingView


Trending Cryptos

Related Questions

QWhat are the main on-chain factors behind Bitcoin's recent drop to $81,000 according to Glassnode?

AAccording to Glassnode, the main on-chain factors are: heavy distribution by Long-Term Holders (over 12,000 BTC per day), net outflows from US spot Bitcoin ETFs reducing institutional demand, miners sending BTC to exchanges, and a wave of long liquidations in the derivatives market amplifying the downward momentum.

QHow much Bitcoin have Long-Term Holders (LTHs) been distributing on average per day over the past 30 days?

ALong-Term Holders have been distributing over 12,000 BTC per day on average over the past 30 days, which is equivalent to 370,000 BTC per month.

QWhat role did Bitcoin miners play in the recent market weakness?

AMiners reinforced the market's weakness by consistently sending their BTC to exchanges, which added to the structural bearish pressure, as positive exchange inflows often signal a growing interest in selling assets.

QHow much was the value of long positions liquidated during this price decline?

AMore than $300 million in long positions were liquidated during this price decline.

QWhat was Bitcoin's price at the time of writing, and what was its 24-hour performance?

AAt the time of writing, Bitcoin price was $84,095, reflecting an over 1% price increase in the past 24 hours.

Related Reads

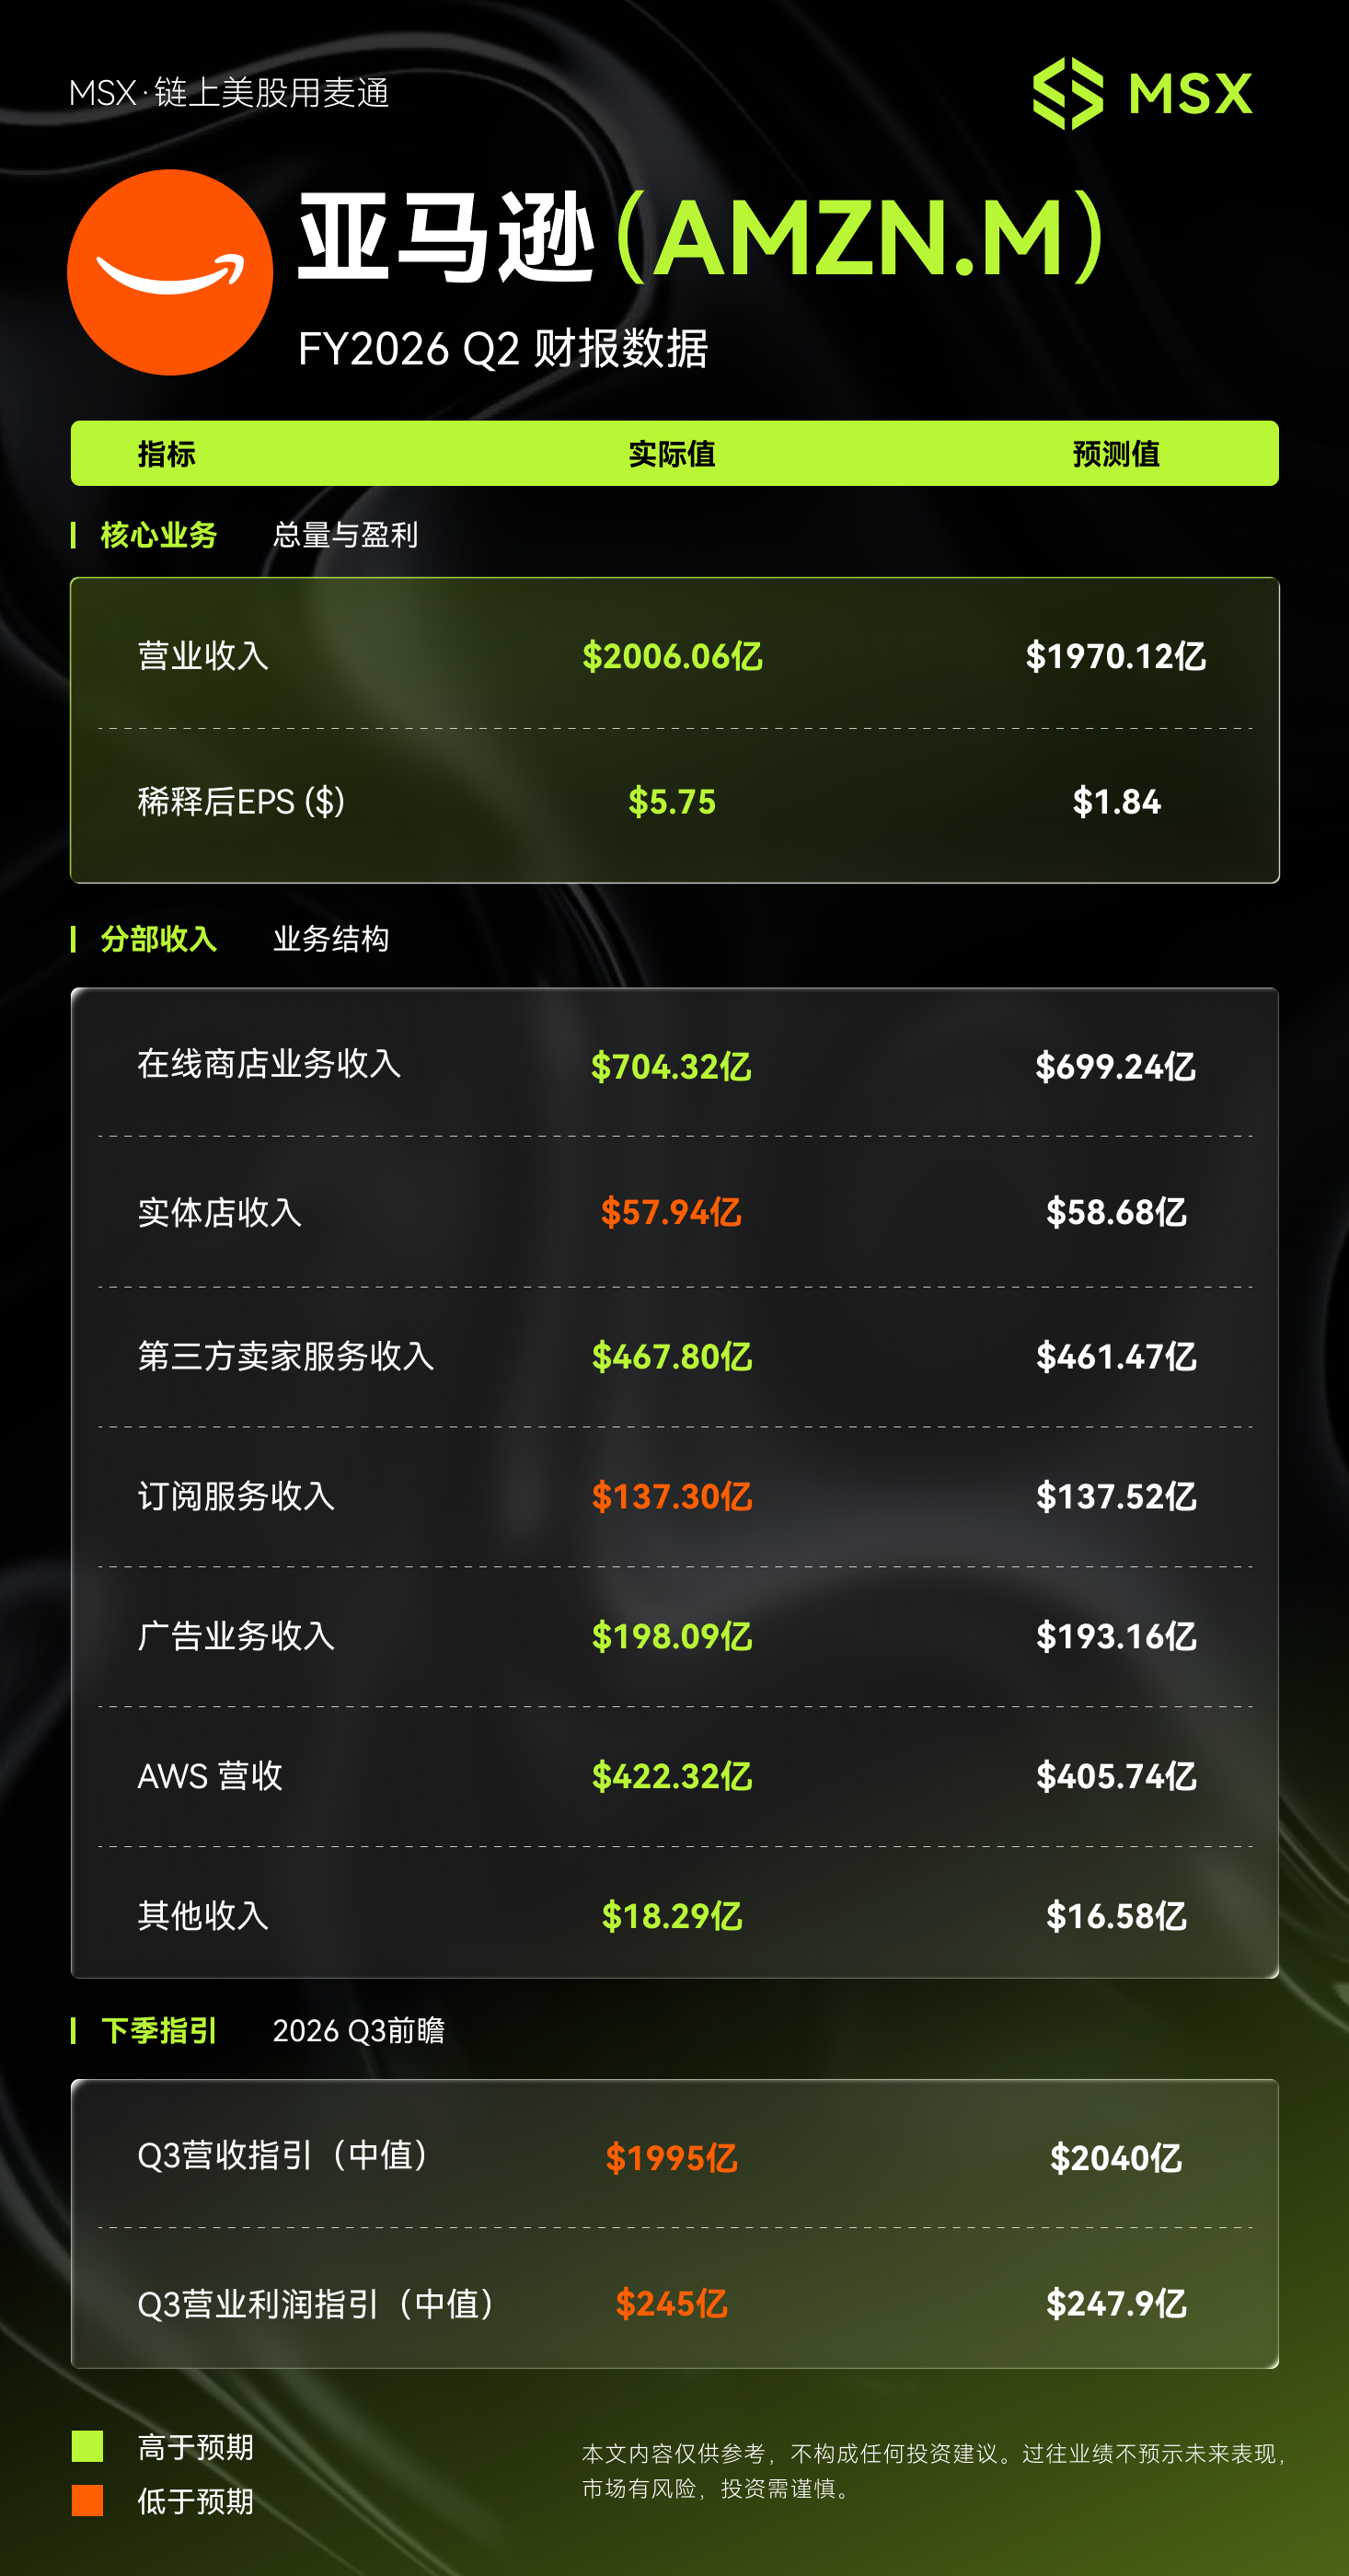
MSX US Stock Daily Insight: Amazon 2026 Q2 Earnings: AWS Records Fastest Growth in Five Years

**MSX Daily US Stock Observation: Amazon's Q2 2026 Earnings: AWS Achieves Fastest Growth in Five Years** Amazon's latest quarterly results exceeded expectations, driven by a strong performance from its cloud computing unit. The company reported revenue of $200.66 billion, surpassing estimates of approximately $197 billion. The key highlight was Amazon Web Services (AWS), which generated $42.232 billion in revenue, surging 37% year-over-year. This marked the segment's fastest growth pace in 18 quarters, indicating robust demand for cloud services. Reported Earnings Per Share (EPS) of $5.75 significantly exceeded the $1.84 forecast. However, this figure included a substantial one-time, non-operating gain of $53.4 billion, primarily from the revaluation of Amazon's investment in AI company Anthropic. Excluding this item, core operating profit was $27.461 billion, a strong increase of 43% compared to the same period last year. Despite the positive results, Amazon provided guidance for the upcoming third quarter that fell short of market expectations. The company's revenue guidance midpoint is $199.5 billion, below the consensus estimate of around $204 billion. Operating profit guidance of $24.5 billion also slightly missed expectations of approximately $247.9 billion. Furthermore, Amazon raised its forecast for full-year capital expenditures to $220 billion, citing rising memory chip costs, which weighed on investor sentiment regarding future profitability. In summary, Amazon's quarter showcased accelerating momentum in its core AWS business. The underlying operational profit growth remains solid. However, cautious forward guidance and increased investment spending present key areas for monitoring in the coming quarters, as the market assesses whether the current growth phase will translate into sustained profit margin expansion.

Odaily星球日报9m ago

MSX US Stock Daily Insight: Amazon 2026 Q2 Earnings: AWS Records Fastest Growth in Five Years

Odaily星球日报9m ago

Cyclical Stock or Growth Stock? Coinbase's Q2 Earnings Report Reveals 'Valuation Disagreement'

Coinbase's Q2 2026 financial results revealed a mixed performance, reigniting debate over whether the company should be valued as a cyclical stock tied to crypto markets or a growth stock with future potential. Total revenue missed expectations at $1.22 billion, down 19% year-over-year. Transaction revenue fell to $599 million, with retail crypto spot trading revenue dropping 30% to $452 million, back to 2023 levels. The company reported a net loss of $359 million, marking its third consecutive quarterly loss. Despite CEO Brian Armstrong's positive commentary on metrics like a 10.3% overall crypto trading market share and 106% growth in prediction markets, the market reacted negatively, with shares dropping over 5% after-hours. A key issue is the decline in core retail trading. While Coinbase touted record market share, this figure includes derivatives and new products. Its traditional crypto spot trading share is likely shrinking. New ventures like prediction markets, while growing, contributed less than $30 million, insufficient to offset the core revenue decline. The valuation debate hinges on perspective. As a cyclical stock, Coinbase remains deeply tied to the crypto bear market, with user attrition and competitive pressures justifying a lower valuation. The company's strategy appears focused on surviving until the next bull cycle. Viewed as a growth stock, however, Coinbase shows promising diversification. Subscription and service revenue reached $555 million, nearly matching transaction revenue. Stablecoin revenue, its second-largest source at $292 million, remains strong through its partnership with Circle. Critically, Coinbase is positioning itself as a leader in the emerging on-chain "agent economy." Over 90% of agent-based stablecoin transactions occur on its Base network, which it believes could handle trillions in future agent transactions. The recent acquisition of Deribit also aims to boost its international derivatives offering. In summary, Coinbase's present struggles are clear, but its future hinges on whether its investments in revenue diversification, stablecoins, and the agent economy can ultimately transform its business model and justify a growth premium.

Odaily星球日报29m ago

Cyclical Stock or Growth Stock? Coinbase's Q2 Earnings Report Reveals 'Valuation Disagreement'

Odaily星球日报29m ago

Global Market Share Survey: Japanese Firms Lead in Semiconductor Materials

Global Market Share Survey: Japanese Firms Lead in Semiconductor Materials According to the 2025 "Major Goods and Services Market Share Survey" by Nikkei, Japanese companies maintain strong positions in semiconductor-related materials. In silicon wafers, Shin-Etsu Chemical ranks first with a 26.3% share, followed by SUMCO at 17.8%. Together, they hold 44.1% of the market, widening their lead over competitors from Taiwan, Germany, and South Korea. In photoresists, Tokyo Ohka Kogyo, JSR, and Shin-Etsu Chemical occupy the top three spots, with a combined share of 60.5%. Despite their strength in materials, Japanese firms have a weaker presence in core semiconductor segments like DRAM and NAND flash memory, where South Korean and U.S. companies dominate. For instance, SK Hynix and Samsung lead in DRAM, while China’s CXMT doubled its share to 6% in 2025. The semiconductor market is projected to grow rapidly, with WSTS forecasting a 90% increase to $1.5112 trillion by 2026. Major players like Samsung, SK Hynix, and Micron are making massive investments to expand capacity. To maintain their edge in materials, Japanese companies must similarly commit to large-scale, risk-taking investments. In contrast, Japan’s automotive sector shows stagnation. Toyota remains the global leader but with only a slight share increase to 12.3%, while Japanese brands are absent from the top five in the EV market. In shipbuilding, Imabari Shipbuilding rose to third place globally with a 7.2% share, benefiting from large container ship deliveries. However, Chinese and South Korean firms dominate the sector, holding the top two positions. Japan aims to revitalize its shipbuilding industry through government and corporate efforts, targeting a near doubling of output by 2035. Addressing labor shortages and adopting advanced technologies like physical AI will be critical for competitiveness.

marsbit54m ago

Global Market Share Survey: Japanese Firms Lead in Semiconductor Materials

marsbit54m ago

Trading

Spot

Hot Articles

Discussions

Welcome to the HTX Community. Here, you can stay informed about the latest platform developments and gain access to professional market insights. Users' opinions on the price of S (S) are presented below.

活动图片