US Debt Approaching $40 Trillion, BofA's Hartnett: Going Long on Gold Is the Optimal Solution Now

marsbitPublished on 2026-08-17Last updated on 2026-08-17

Abstract

U.S. national debt is on the verge of reaching $40 trillion. Bank of America's Chief Investment Strategist Michael Hartnett, in his latest "Flow Show" report, identifies this as the core market narrative and argues that **going long on gold is the optimal solution** currently. He views gold as the best hedge against dollar depreciation, bond market collapse, and asset inflation. Key pressures on the bond market include soaring debt interest payments, nearing $1.4 trillion annually and set to become the federal government's largest expenditure. Simultaneously, a surge in corporate bond issuance, particularly for AI/data center projects (up roughly 12 times historical averages), is structurally steepening the yield curve and crowding out buyers for long-term Treasuries. Hartnett reiterates his asset allocation framework for the 2020s: **ABB (Away From Bonds), ABD (Away From Dollar), and AI (All In AI)**. Within the "ABD" theme, he explicitly recommends going long gold. He suggests policymakers have limited tolerance for significantly higher yields, especially with elections approaching. Under the "ABB" theme, he notes that some previously neglected long-duration assets like REITs, biotech (XBI), regional banks (KRE), and small-cap stocks are quietly outperforming as the market prices in a peak in yields. Conversely, within the "AI" theme, he proposes a counterintuitive trade: **shorting AI-related bonds**, given the sector's massive capital expenditure needs and negative fre...

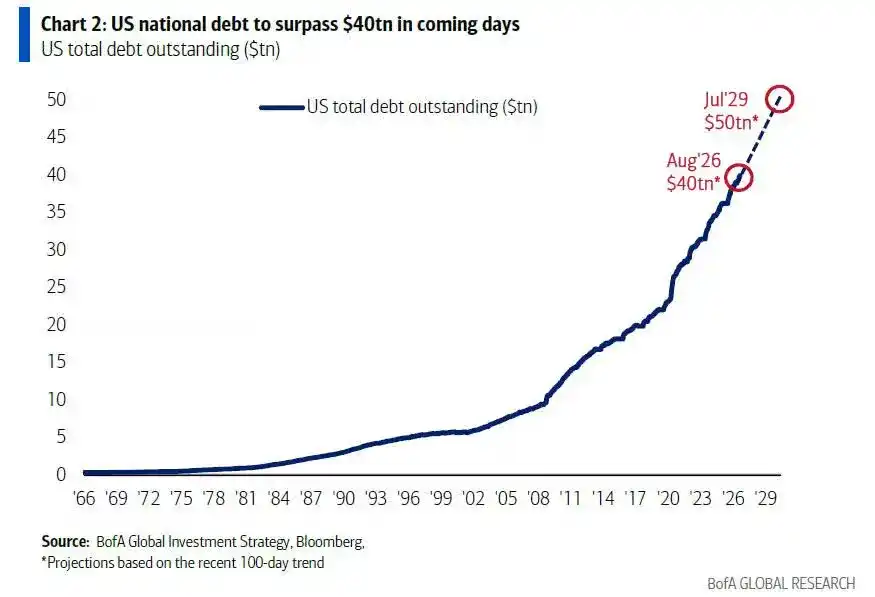
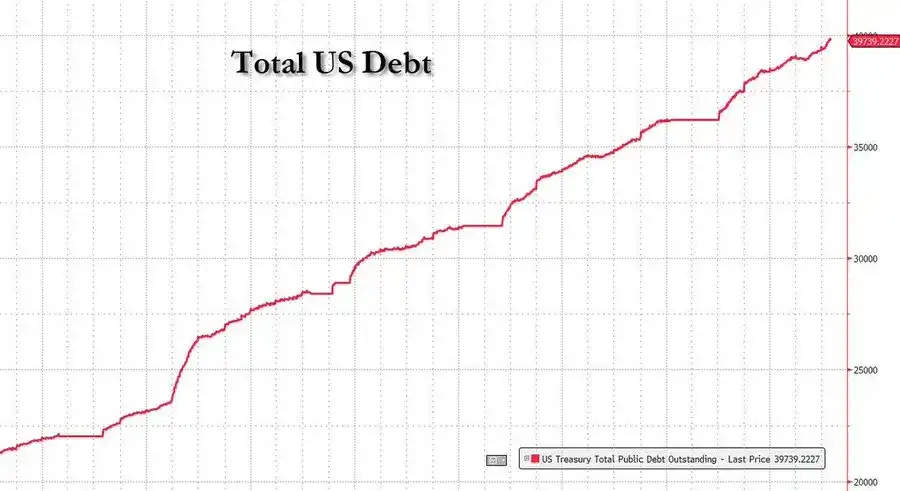
US Treasury debt is only $65 billion away from $40 trillion. As of last Friday's close, this 'largest integer milestone in history' is within reach. In his latest Flow Show report, titled "Strife Begins at Forty," Bank of America's chief investment strategist, Michael Hartnett, identifies this moment as the core narrative for the current market.

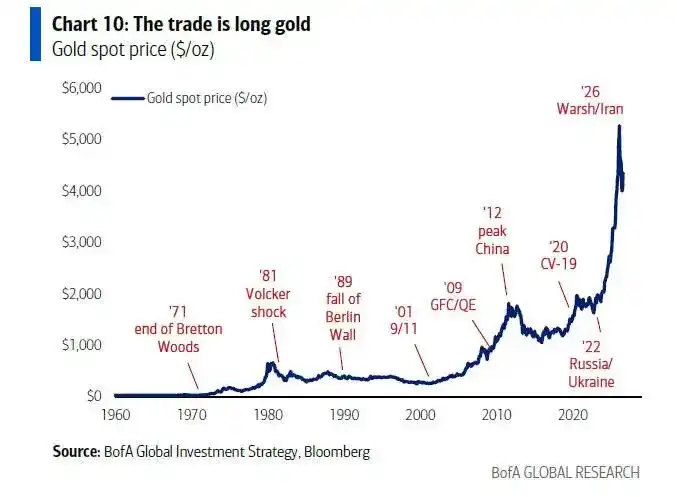
Hartnett points out that not only will US debt exceed $40 trillion in the coming days, but it is also on track to reach $50 trillion around 2029. In such an environment, Hartnett believes that going long on gold is the optimal solution now. Gold remains the best tool to hedge against dollar depreciation, bond collapse, and asset inflation.
Debt Interest Now the "Largest Expenditure," Bond Market Under Pressure

Over the past 12 months, US interest payments on debt have reached $1.4 trillion, nearing the point of surpassing Social Security as the federal government's largest single expenditure.

Hartnett clearly states that this trend will not reverse—unless the 5-year Treasury yield falls below 3.25%. This is almost impossible without a significant deflationary shock or recession.

Meanwhile, the 30-year Treasury was issued last week with a yield of 5.126%, a 25-year high. Hartnett summarizes this absurdity in one sentence: "The stock market hit an all-time high on the same day the Treasury issued debt at a 25-year high yield—that's reality."
AI Funding Frenzy Is "Crowding Out" Treasury Buyers

Pressure on the bond market isn't just from the government. Data from Nomura strategist Charlie McElligott shows:

  • Total corporate bond supply has surged 61% year-over-year.

  • The issuance scale of AI/hyperscale data center/data center-related bonds (investment-grade + loans) has reached approximately 12 times the average annual level of 2015-2024. Year-to-date, it has reached $269 billion, double that of all of 2025.

The flood of corporate bonds into the market is structurally steepening the US Treasury yield curve (bear steepening), crowding out funds that would otherwise buy long-term Treasuries. CTA trend strategies show an overall "short" signal for G10 bonds, with nominal positions at the 12th percentile since 2010 and short-term rate positions at the 10th percentile.

The result is a vicious cycle: credit spreads widen → long-duration buyers are crowded out → yield curve bear steepens → market concerns about "loss of control" intensify.

Asset Allocation Principles: Gold Is the Core Answer

In his report, Hartnett reiterates his key asset allocation frameworks for the 2020s and reinforces them for 2026:

ABB (Away From Bonds), ABD (Away From the Dollar), AI (All In on AI), etc.

These principles share a common underlying logic: policymakers view "nominal GDP prosperity" as the way out of the debt problem and consider the stock market "too big to fail." That's why, as Hartnett wrote last week: "Wall Street is trading without fear."

He summarizes the current market sentiment: "Massive EPS growth, $10 trillion in wealth added in 2026, AI capex over $1 trillion in 2027... The gate for bulls is wide open. The only constraints are bonds (yield spike), voters (socialist waves), and the fact that everyone is already positioned for the upside."

Going Long on Gold: The Optimal Solution Against Dollar Depreciation

Within the "ABD (Away From the Dollar)" framework, Hartnett provides a clear trading direction: go long on gold.

His logic is direct: gold remains the best hedging tool against dollar depreciation, bond collapse, asset inflation, and the political tug-of-war between capitalist populism and socialist populism in the 2020s.

The logic for a weaker dollar is equally clear. The US government has signaled through yen intervention—it does not want the 10-year Treasury yield to break above 5%. With mid-term elections approaching, CPI is expected to operate within the 2.8%-3.6% range, and core CPI within 2.1%-2.6%, leaving policymakers with limited tolerance for further yield increases.

Hartnett believes that the hawkish stance from Warsh at the Jackson Hole meeting on August 28th, combined with the potential Bank of Japan rate hike on September 18th, could jointly signal "mission accomplished," providing the basis for suppressing yields and ending yen depreciation risks.
Under the "Away From Bonds" Framework, Which Assets Are Quietly Outperforming?

Within the "ABB (Away From Bonds)" framework, Hartnett points out an interesting phenomenon: despite higher yields in 2026, long-duration, previously neglected assets—REITs, biotech (XBI), regional banks (KRE), and small-cap stocks—are quietly outperforming the broader market.

The market is "pricing in" a peak in yields through action. Hartnett believes that another significant spike in yields would be "too dangerous to be allowed" by authorities, which is why these assets are finding support.

The Other Side of the AI Trade: Short AI Bonds

Within the "All In on AI" framework, Hartnett offers a counter-intuitive trade: short AI bonds.

The logic: over $1 trillion in capital expenditure plus negative free cash flow means AI companies must continue large-scale bond issuance to finance themselves. This trade, first proposed by Hartnett at the end of 2025, he says, has been "far more profitable" in 2026 than going long AI stocks.

He believes the optimal bubble strategy is to simultaneously go long on "arrogance" (AI) and "humiliation" (neglected cyclical assets). Drawing a historical analogy: Emerging markets during the 1999 dot-com bubble, and oil during the 2007/08 subprime/China bubble, were beneficiaries of "humiliation assets" in the late stages of those bubbles.

Future Key Catalysts: Elections and Policy Are the Biggest Variables

Hartnett lists key market events for the coming months:

  • August 28: Warsh speaks at Jackson Hole

  • September 4: August Nonfarm Payrolls data

  • September 11: August CPI data

  • September 16: FOMC meeting (35% probability of a rate hike)

  • September 18: Bank of Japan meeting (74% probability of a rate hike)

  • September 24: Major US-China diplomatic event

  • October 4: Brazilian election

Hartnett's final judgment is clear: If Republicans retain the Senate and Abbott retains the Texas governorship, he expects the stock market (especially the AI sector) to surge further into bubble territory by 2027. If Democrats win the Senate and the Texas governorship on November 3rd, then stocks, the dollar, and bond yields will face a sharp decline of over 10% before year-end.


Trending Cryptos

Related Questions

QAccording to BofA's Michael Hartnett, what is the optimal trade in the current environment of soaring US national debt approaching $40 trillion?

AAccording to BofA's Michael Hartnett, going long on gold is the optimal trade. He views gold as the best tool to hedge against dollar devaluation, bond collapse, and asset inflation.

QWhat is one reason cited in the article for increasing pressure on the bond market besides government debt?

AOne reason is the massive influx of corporate bonds, particularly those related to AI and data centers. This surge in supply is structurally steepening the US Treasury yield curve (bear steepening) and crowding out capital that would otherwise purchase long-term Treasuries.

QWhat does the 'ABD' in Hartnett's asset allocation framework stand for, and what trade does he explicitly link to it?

A'ABD' stands for 'Anything But Dollars.' Hartnett explicitly links the trade of going long on gold to this framework, presenting it as a hedge against dollar weakness.

QWhat counter-intuitive trade does Hartnett recommend within his 'AI (Anything but Innovation)' framework, and what is the logic behind it?

AWithin the 'AI' framework, Hartnett recommends going short AI bonds. The logic is that AI companies, with massive capital expenditure and negative free cash flow, must continue large-scale debt financing, making their bonds vulnerable.

QWhat is a key political variable that Hartnett identifies as a major catalyst for potential market moves by the end of the year?

AThe US midterm elections are a key variable. Hartnett suggests that if Democrats win the Senate and the Texas governorship on November 3rd, it could trigger a decline of more than 10% in stocks, the dollar, and bond yields by year-end.

Related Reads

Wall Street Morning Report: S&P Earnings Growth Hits 30-Year High, Nvidia Becomes SpaceX's 6th Largest Shareholder

Wall Street Morning Report: S&P 500 earnings growth hits a 30-year high; Nvidia becomes SpaceX's 6th largest shareholder. Market Summary: U.S. stocks ended slightly lower on Friday after record highs, with the S&P 500 posting a weekly gain. Weaker-than-expected July retail sales data significantly reduced market expectations for a September Fed rate hike. Key Themes: * **Macro & Rates:** The probability of the Fed holding rates steady in September rose to ~70%. Geopolitical tensions in the Middle East supported oil prices near $90. Focus this week is on a $16B 20-year Treasury auction testing investor demand amid high yields. * **Corporate Earnings:** S&P 500 Q2 earnings grew 31%, the fastest pace since 1992 excluding recession recoveries, driving a valuation reset. * **AI & Tech Sector Rotation:** The AI investment narrative faces scrutiny over financing and return timelines. Semiconductor stocks saw divergence: memory (SanDisk, Micron) and optical communication (Applied Optoelectronics) surged, while Broadcom fell sharply on credit rating downgrade concerns over AI leasing exposure. * **Notable Moves:** Nvidia disclosed a ~$21B stake in SpaceX. AMD rose 6.5% after a record debt issuance. Reddit rallied ahead of its S&P 500 inclusion. This Week's Highlights: * **Fed Minutes (Thu):** Key for gauging policy divergence and September rate outlook. * **Key Earnings:** Alibaba, Walmart, Nvidia, AMD. * **Events:** Seoul AI Summit, World Robot Conference, potential恒生指数 rebalancing. * **Data:** U.S. jobless claims, Japan core CPI, Korea early export data (a leading indicator for semiconductors).

marsbit14m ago

Wall Street Morning Report: S&P Earnings Growth Hits 30-Year High, Nvidia Becomes SpaceX's 6th Largest Shareholder

marsbit14m ago

BTC in Range-Bound Consolidation, HYPE Daily Rebound Confirmed | Invited Analysis

**Market Analysis: BTC Consolidates in Range, HYPE Shows Daily Rebound Confirmation (Weekly Outlook)** **BTC Analysis:** The market is at a key juncture. Bitcoin is undergoing a daily correction, with a critical focus on whether it can find support and stabilize above the $60,950 level. The adjustment that began from the May 6th high has formed a complex seven-segment structure on the daily chart. Three potential paths are identified: 1. **Continuation of the c-wave rally** (primary scenario), targeting $67,300 initially, then $69,500-$71,000. 2. **Range-bound consolidation** between $60,950 and $65,500, forming an "ascending中枢" before an upward breakout. 3. **Breakdown and secondary探底** if support at $60,950-$61,500 fails. Analysis favors the first two scenarios. The 4-hour chart suggests the current adjustment phase is nearing completion near the strong $60,950-$61,500 support zone. **BTC Strategy:** * **Key Levels:** Support at $62,268, $60,950-$61,500, $57,820. Resistance at $65,500, $67,300, $69,500-$71,000. * **Mid-term:** Current model indicates a bearish structure with ~20% short exposure. Consider adding to shorts (up to 50%) only if price rallies to $69,500-$71,000, shows clear stagnation, and model confirms. * **Short-term (30% capital):** Two tactical plans: * **A) Test shorts** near strong resistance ($69,500-$71,000) upon signs of weakness. * **B) Test longs** near strong support ($60,950-$61,500) upon stabilization signals. **HYPE Analysis:** HYPE has established a daily rebound from the August 2nd low. The 4-hour chart shows a five-segment上升 structure with a formed "ascending中枢". The current (76-77) segment is crucial. Two outcomes are possible: 1. **Breakout (Central离开段):** If price breaks and holds above the $58-$58.5 resistance zone, the uptrend continues. Monitor for momentum背驰 between the initial and breakout segments. 2. **Consolidation (Central Extension):** Failure to hold above $58-$58.5 leads to a return to中枢 consolidation, requiring new signals for direction. **HYPE Strategy:** * **Key Levels:** Support at $50-$52, $45. Resistance at $58.5-$60, descending channel upper rail, $72.97. * **Watch:** Whether price can break/hold above $58-$58.5 to confirm the breakout. * **Action:** * **Existing longs (from $50-$52):** Move stop-loss above entry cost. * **New entrants:** Consider light longs only on a confirmed breakout above $58.5-$60 with a tight stop-loss. Exit quickly if momentum背驰 appears. **General Risk Management:** * Set initial stop-loss immediately upon entry. * Move stop-loss to breakeven at +1% profit. * Trail stop-loss upwards by 1% for every subsequent 1% gain to lock in profits. **Disclaimer:** Market conditions change rapidly. This analysis is for informational purposes only and not investment advice. Trading carries significant risk.

marsbit16m ago

BTC in Range-Bound Consolidation, HYPE Daily Rebound Confirmed | Invited Analysis

marsbit16m ago

Not Chasing AI or Buying Back Shares, Can 'Stingy' Jingdong Still Succeed?

On August 13th, JD.com (JD.US) released its Q2 2026 earnings, delivering a mixed and generally "flat" performance that met low expectations but offered few positives. Overall revenue declined by approximately 3% year-over-year (YoY) to ~¥346.4 billion, aligning with weakened domestic consumption trends. While group operating profit saw a YoY improvement, this was primarily due to reduced losses in the food delivery segment compared to the high-cost "delivery war" period of the previous year. Key details reveal deeper concerns: revenue from JD's core domestic retail segment fell 4.7% YoY. While electronics sales declined less than feared (~12% YoY), growth in daily necessities and advertising services plummeted by about 10 percentage points each, raising doubts about the segment's mid-term growth momentum post-subsidy adjustments. Logistics revenue growth also slowed to 5.9% as the delivery boom faded. Profitability presented a nuanced picture. The retail segment's operating margin edged up slightly YoY but failed to deliver the significant beats seen in past quarters, suggesting efficiency gains may be nearing limits. Losses from the New Businesses segment (including food delivery and overseas ventures) remained elevated at ~¥9.9 billion, as increased overseas investment partially offset reductions in delivery subsidies. Notably, JD's shareholder returns weakened significantly, with share buybacks in H1 2026 annualizing to only about 5% of market cap. The company opted to park cash in short-term investments rather than boost returns, drawing criticism. Looking ahead, JD's performance hinges on a potential recovery in China's e-commerce sentiment in H2 2026 and the scale of ongoing losses in new ventures. While not burdened by massive AI capex like some peers, and offering relative defensive stability, the lack of positive earnings surprises and diminished shareholder returns provide little compelling reason for investors to favor the stock in the near term.

marsbit26m ago

Not Chasing AI or Buying Back Shares, Can 'Stingy' Jingdong Still Succeed?

marsbit26m ago

Trading

Spot

Hot Articles

Discussions

Welcome to the HTX Community. Here, you can stay informed about the latest platform developments and gain access to professional market insights. Users' opinions on the price of S (S) are presented below.

活动图片