BTC in Range-Bound Consolidation, HYPE Daily Rebound Confirmed | Invited Analysis

marsbitPublished on 2026-08-17Last updated on 2026-08-17

Abstract

**Market Analysis: BTC Consolidates in Range, HYPE Shows Daily Rebound Confirmation (Weekly Outlook)** **BTC Analysis:** The market is at a key juncture. Bitcoin is undergoing a daily correction, with a critical focus on whether it can find support and stabilize above the $60,950 level. The adjustment that began from the May 6th high has formed a complex seven-segment structure on the daily chart. Three potential paths are identified: 1. **Continuation of the c-wave rally** (primary scenario), targeting $67,300 initially, then $69,500-$71,000. 2. **Range-bound consolidation** between $60,950 and $65,500, forming an "ascending中枢" before an upward breakout. 3. **Breakdown and secondary探底** if support at $60,950-$61,500 fails. Analysis favors the first two scenarios. The 4-hour chart suggests the current adjustment phase is nearing completion near the strong $60,950-$61,500 support zone. **BTC Strategy:** * **Key Levels:** Support at $62,268, $60,950-$61,500, $57,820. Resistance at $65,500, $67,300, $69,500-$71,000. * **Mid-term:** Current model indicates a bearish structure with ~20% short exposure. Consider adding to shorts (up to 50%) only if price rallies to $69,500-$71,000, shows clear stagnation, and model confirms. * **Short-term (30% capital):** Two tactical plans: * **A) Test shorts** near strong resistance ($69,500-$71,000) upon signs of weakness. * **B) Test longs** near strong support ($60,950-$61,500) upon stabilization signals. **HYPE Analys...

This week, the market is in a critical phase of structural validation: whether BTC's daily adjustment can bottom out and stabilize above $60,950, and whether HYPE can effectively hold above the $58~$58.5 resistance zone to form a breakout segment, are the two core focal points determining the subsequent market direction. The following are this week's core viewpoints and detailed technical analysis.

Summary of This Week's Core Trading Views:

  • BTC Multi-Cycle Trend Structure Analysis (Details in Part 1)
  • BTC Market Forecast and Mid-/Short-term Trading Strategies for This Week (Details in Part 2)
  • HYPE Hourly Trend Structure Analysis (Details in Part 3)
  • HYPE Market Forecast and Short-term Trading Strategy for This Week (Details in Part 4)

Market Verification of Last Week's Trading Strategy and Core Views:

  • Verification of BTC Market Outlook: Last week's article emphasized: The probability of the daily short-term adjustment completing its termination above the $60,900-$61,500 zone is relatively high. Currently, actual market movements align with our forecast.
  • Verification of HYPE Market Outlook: Review from last week's article: A daily-level rebound probability was significant at the convergence of triple technical supports (long-term uptrend line, short-term descending channel lower rail, and the $50~$52 zone). The current actual price action is highly consistent with our analytical view.

I. Bitcoin Multi-Cycle Trend Structure Analysis

1. Bitcoin Daily Level Trend Structure Analysis: (Based on post-May 6th price action)
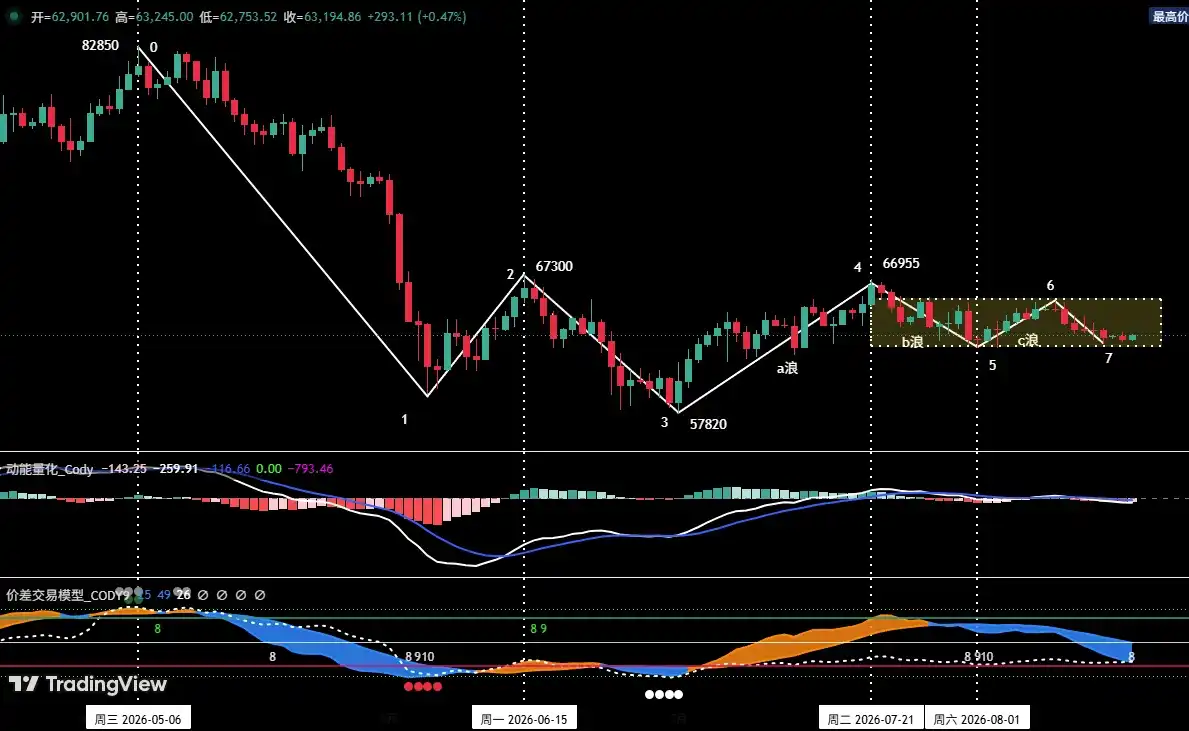
Figure 1 Bitcoin Daily K-line Chart

1. As shown in (Figure 1): The correction initiated from the May 6th high of $82,850 has presented a seven-segment corrective structure on the daily chart: (0-1), (1-2), (2-3), (3-4), (4-5), (5-6), (6-7).

2. Daily Structure Analysis: Regarding the price action since the rebound from the July 1st low of $57,820, the market may evolve in the following three potential paths:

Path One: Maintain the previous view, continue the daily Wave C rebound. Assume the daily Wave B correction ended at the August 1st low of $62,268, and the current price action is in the Wave C rebound phase. The primary target for this path is the $67,300 resistance zone. If effectively broken, the next target is the $69,500~$71,000 zone.

Path Two: Range consolidation followed by a breakout. Price finds support above $60,950, maintaining a range-bound consolidation pattern between $60,950~$65,500 (forming an upward consolidation zone). After the formation completes, price breaks above the range upper rail, testing the $67,300 key resistance again.

Path Three: Breakdown and initiation of a secondary bottom. Price effectively breaks below the strong support zone of $60,950~$61,500, and the market will initiate a secondary bottoming process.

3. Based on analysis from a self-constructed quantitative model, the probability of the market following the first two paths is higher.

2. In-depth Analysis of Bitcoin Hourly Level Trend Structure: (Using the 4-hour cycle as analysis timeframe)
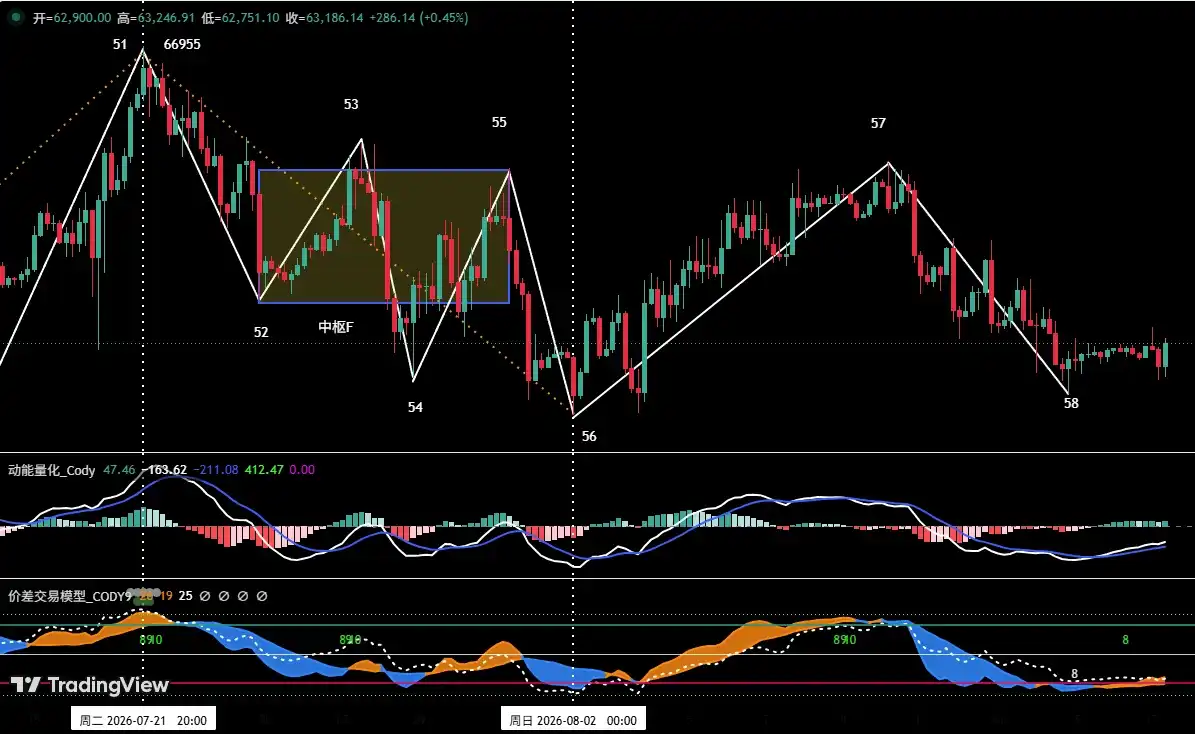
Figure 2 Bitcoin 4-hour K-line Chart

1. The daily adjustment initiated from the July 21st high of $66,955 can be clearly decomposed into seven segments from (51-52) to (57-58) on the 4-hour chart.

2. Based on the 4-hour framework analysis, the correction starting from "Endpoint 51" (approx. $69,550) to "Endpoint 56" (approx. $62,268) has presented a complete five-segment structure. If the subsequent "Endpoint 58" is lower than "Endpoint 56", the correction extends into a seven-segment structure. Considering both the trend structure and the corrective depth, this phase of adjustment is nearing its end. The current price resonates with the strong support zone of $60,950~$61,500, and the probability of the price ending the correction above $60,950 is significantly increased.

II. Bitcoin Market Forecast and Trading Strategy for This Week

1. BTC Market Trend Forecast for This Week:

Core View This Week: Closely monitor whether the daily adjustment can bottom out and stabilize above $60,950.

2. Key Resistance Levels:

• First Resistance Zone: Around $65,500 (previous important resistance area)

• Second Resistance Zone: Around $67,300 (previous important resistance area)

• Third Resistance Zone: $69,500~$71,000 area (previous important resistance area)

3. Key Support Levels:

• First Support Level: Around $62,268 (previous important support level)

• Second Support Level: $60,950~$61,500 area (previous important support level)

• Third Support Level: Around $57,820 (previous important support level)

4. Trading Strategy for This Week (Excluding Impact of Unexpected News)

1. Medium-term Strategy:
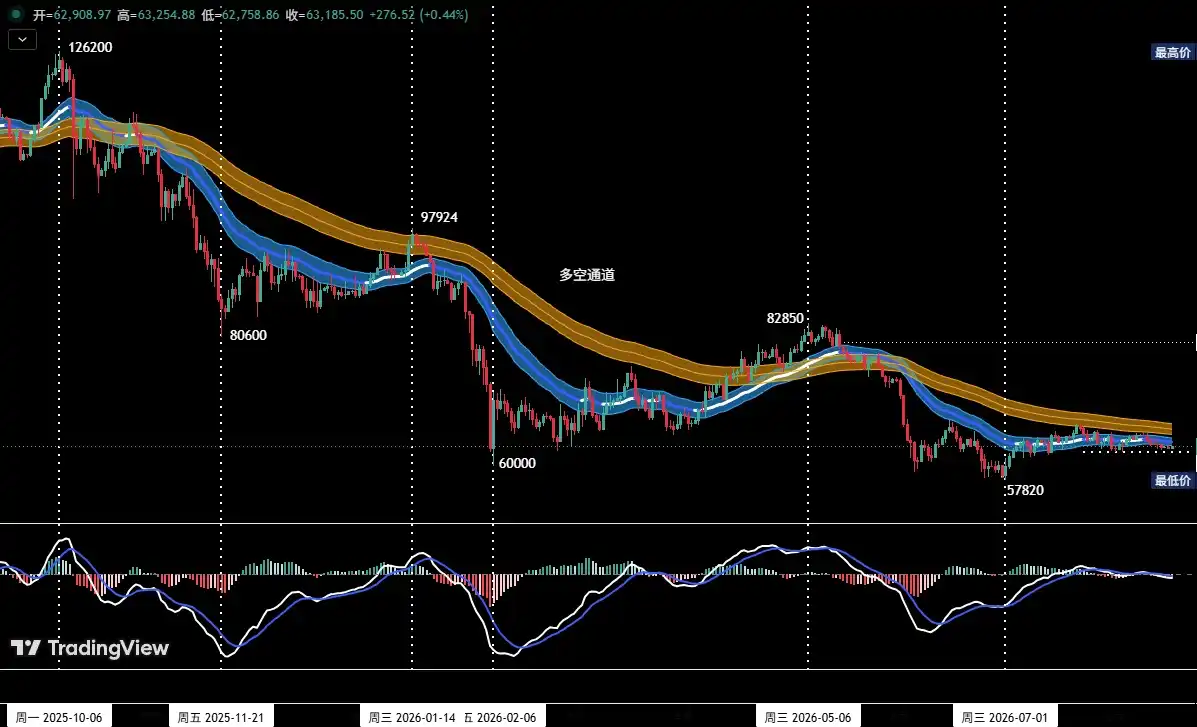
Figure 3 Bitcoin Daily K-line Chart: (Position Monitoring Model)

Position Monitoring Model: As shown in (Figure 3), the current price has effectively broken below the "Bull-Bear Channel", confirming the market structure has shifted to bear-dominated. The current medium-term short position is around 20%.

• If this week the price effectively breaks the $67,300 resistance, continues to rebound to the $69,500~$71,000 area showing clear signs of stagnation, and the quantitative model simultaneously issues a short signal, then increase the medium-term short position to 50%.

2. Short-term Strategy:

Utilize 30% of the position, set stop-loss points, and seek opportunities for "spread trading" based on support and resistance levels. (Use 30-minute/60-minute as the operation cycle).

3. In short-term operations, to dynamically respond to complex market evolutions, we have prepared two specific operation plans in advance, A and B.

• Plan A: Test short selling in strong resistance zones.

• Entry: If this week the price rebound effectively breaks the $67,300 resistance, rises to the $69,500~$71,000 area showing clear signs of stagnation, and combined with the quantitative model signal, a short position of around 30% can be established.

• Risk Control: Set an initial stop-loss level.

• Exit: When the adjustment approaches important support levels and combined with the quantitative model signal, gradually close the position to take profits.

• Plan B: Light long position testing in strong support zones.

• Entry: If the price shows signs of bottoming out and stabilizing above the $60,950~$61,500 area, combined with the quantitative model's bottom signal, a long position of around 15% can be established.

• Risk Control: Set an initial stop-loss level.

• Exit: When the rebound approaches important resistance levels and combined with the model signal, gradually close the position to take profits.

III. HYPE Hourly Level Trend Structure Analysis
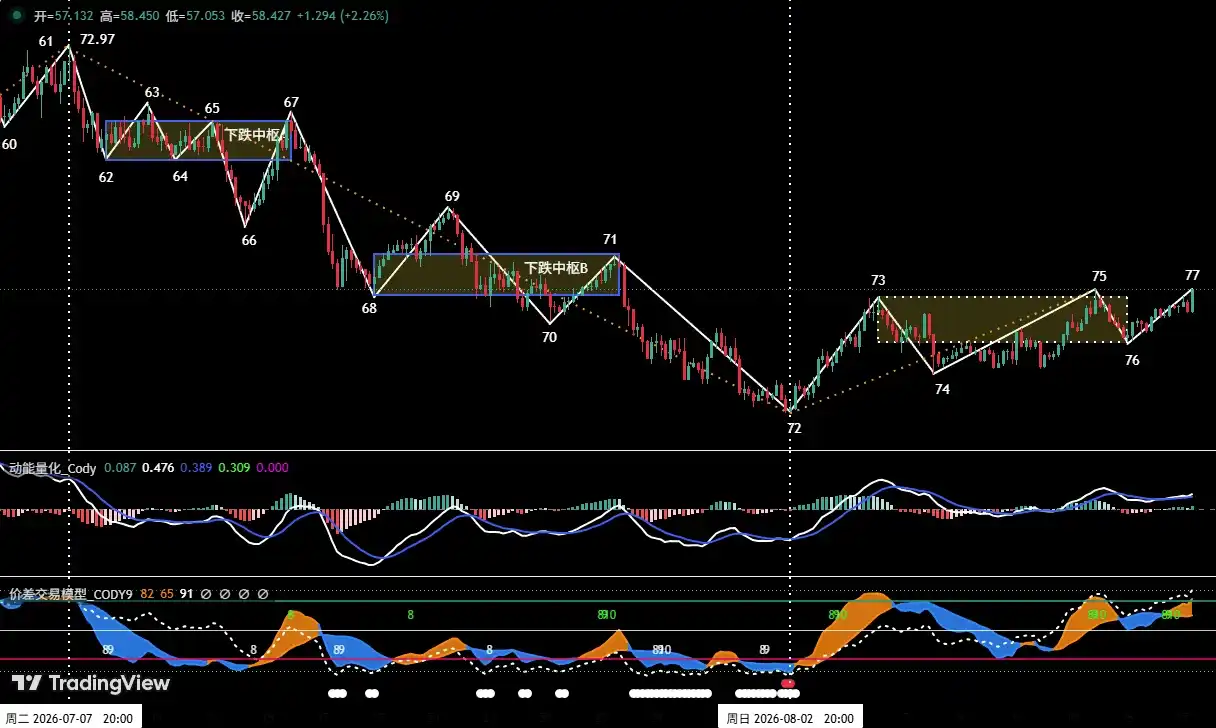
Figure 4 HYPE 4-hour K-line Chart

1. As shown in (Figure 4): HYPE initiated a daily-level rebound from the August 2nd low of $51.11, clearly divided into a five-segment upward structure from (72-73) to (76-77) on the 4-hour chart. Segments (73-74), (74-75), and (75-76) have overlapping ranges, forming an upward consolidation zone.

2. The market is currently running the (76-77) rebound segment. Subsequent price action may evolve in two ways:

Mode One: Formation of the breakout segment. If the price can effectively break and hold above the $58~$58.5 resistance zone and continue to rebound, then (76-77) will constitute the breakout segment. At that point, it's necessary to observe the momentum strength of the entry segment (72-73) versus the breakout segment (76-77) to see if a momentum divergence pattern forms, thereby assessing trend continuation or reversal risks.

Mode Two: Consolidation zone extension. If the price fails to effectively hold above the $58~$58.5 zone, instead falls back into the consolidation zone for continued sideways movement, it indicates the zone will enter an extension phase, potentially constructing a more complex consolidation pattern. The subsequent direction will need to wait for new breakout signals for confirmation.

IV. HYPE Market Forecast and Short-term Trading Strategy for This Week

1. HYPE Market Trend Forecast for This Week:

1. Key Resistance Levels:

• First Resistance Level: $58.5~$60 area

• Second Resistance Level: Near the descending channel upper rail

• Third Resistance Level: Around $72.97

2. Key Support Levels:

• First Support Level: $50~$52 area;

• Second Support Level: Around $45;

Core View This Week: Focus on observing whether the price can effectively break above and hold the $58~$58.5 resistance zone to form the breakout segment. This view determines the subsequent market mode.

2. HYPE Short-term Trading Strategy for This Week:

1. For holders of long positions: If long positions were established in the $50~$52 area according to previous trading plans, it is recommended to move the initial stop-loss above the entry cost and strictly adhere to stop-loss discipline, holding for further gains.

2. For those not in a position: If the price effectively breaks above the $58.5~$60 area and shows signs of stabilization, consider establishing a light long position. A stop-loss must be set, and the principle of "quick entry, quick exit" should be followed. Once signs of momentum divergence appear during the rebound, decisively exit to avoid the risk of a deep correction.

V. Special Reminders:

1. When opening a position: Immediately set the initial stop-loss level.

2. When profit reaches 1%: Move the stop-loss to the entry cost (breakeven point), ensuring capital safety.

3. When profit reaches 2%: Move the stop-loss to the 1% profit level.

4. Continuous tracking: Thereafter, for every additional 1% profit in price, move the stop-loss up by 1% accordingly, dynamically protecting and locking in profits.

Financial markets change rapidly. All market analysis and trading strategies require dynamic adjustment. All views, analytical models, and operation strategies mentioned in this article are derived from personal technical analysis, intended solely for personal trading log purposes, and do not constitute any investment advice or operational basis. Markets involve risks, invest with caution. Do not make decisions based solely on this content.


Trending Cryptos

Related Questions

QBased on the technical analysis, what is the primary condition needed for HYPE to confirm a bullish continuation this week?

AThe primary condition is for HYPE's price to effectively break through and stabilize above the 58~58.5 USD resistance area, which would constitute the central departure segment of its current structure, confirming the continuation of the daily-level rebound.

QWhat are the three possible future evolution paths for BTC's daily chart structure according to the analysis?

APath One: Continue the daily c-wave rebound, targeting 67,300 USD first and then the 69,500~71,000 USD zone. Path Two: Maintain box oscillation between 60,950 and 65,500 USD (forming a rising central), then break upwards. Path Three: Effectively break below the 60,950~61,500 USD strong support zone, initiating a secondary bottoming process.

QWhat is the recommended position management rule when trading based on this article's strategies?

AThe recommended rule is to set an initial stop-loss upon opening a position. Move the stop-loss to the breakeven point (entry price) when profit reaches 1%. Subsequently, move the stop-loss up by 1% for every additional 1% of profit gained to dynamically protect and lock in profits.

QAccording to the analyst's quantitative model, what is the more likely outcome for BTC's current adjustment phase?

ABased on the analyst's self-constructed quantitative model, the market has a higher probability of following the first two evolution paths (continuing the c-wave rebound or forming a box oscillation before an upward breakout), rather than the third path of breaking down for a secondary bottom.

QWhat specific signal does the article suggest for adding to a BTC medium-term short position?

AIt suggests adding to the medium-term short position (increasing to 50%) if the price effectively breaks above the 67,300 USD resistance, continues to rally to the 69,500~71,000 USD area, shows clear signs of stalling (lack of upward momentum), and the quantitative model simultaneously issues a short signal.

Related Reads

Novig Sues Wisconsin as Sports Prediction Market Dispute Heats Up

Novig, a sports event prediction market operator, has filed a lawsuit against Wisconsin's attorney general. The legal dispute centers on whether prediction markets fall under federal derivatives regulations or state gambling laws. The lawsuit, filed in a U.S. district court, seeks a declaratory judgment after Novig began offering event contracts to Wisconsin residents. This case is part of a broader conflict. In April, Wisconsin sued other prediction market platforms like Kalshi and Polymarket, alleging their sports-related contracts violate state gambling laws. Novig argues its contracts are "swaps" regulated exclusively by the federal Commodity Futures Trading Commission (CFTC), under the Commodity Exchange Act. Wisconsin contends they are sports betting. Federal courts have issued conflicting rulings on similar cases, creating legal uncertainty. The outcome is significant as prediction markets are a fast-growing sector, with trading volume reaching $9.5 billion on a single day in August. These markets are also increasingly intertwined with cryptocurrency infrastructure. Simultaneously, Novig is pursuing a nationwide legal strategy, having filed similar lawsuits in four other states. The company also recently secured a marketing partnership with the New York Mets, marking the first such deal with an MLB team. The Wisconsin case's resolution will influence whether prediction markets can operate as national financial products or remain constrained by individual state laws.

cryptonews.ru4m ago

Novig Sues Wisconsin as Sports Prediction Market Dispute Heats Up

cryptonews.ru4m ago

Держатели XRP могут торговать опционами на платформе Derive, используя FXRP в качестве залога

XRP holders can now trade options on the Derive platform using FXRP as collateral, as announced by Flare on August 12. This integration allows users to open positions from self-custody wallets while the underlying XRP backing the FXRP remains on the XRP Ledger. According to DeFi analyst Will Procheska, this provides XRP's dedicated holder base with a permissionless options market for generating yield or hedging. Derive's platform combines protocol-level settlements with an order book managed by Derive Trading Co., enabling users to retain asset control while professional market-makers provide liquidity. XRP options on Derive are cash-settled in USDC, so profits or obligations adjust the trader's USDC balance without transferring XRP or FXRP. The platform's portfolio margin system assesses overall account risk but may still trigger liquidations if margin levels fall below requirements. The launch expands Flare's XRPFi ecosystem. FXRP, introduced via the FAssets system in September 2025, creates an on-chain representation of XRP for use in smart contracts. It has since been integrated into spot trading and, more recently, permissionless lending markets on Morpho. This addition of options on Derive offers XRP holders hedging and premium-earning capabilities comparable to other major assets. While regulated XRP options debuted on CME Group in October 2025, Derive provides a decentralized alternative with USDC settlement and direct wallet access. The platform also supports perpetual futures, offering further trading strategies. Flare and Derive are exploring automated "strategy vaults" to simplify yield-generating options approaches for users.

cryptonews.ru4m ago

Держатели XRP могут торговать опционами на платформе Derive, используя FXRP в качестве залога

cryptonews.ru4m ago

Trading

Spot

Hot Articles

What is $BITCOIN

DIGITAL GOLD ($BITCOIN): A Comprehensive Analysis Introduction to DIGITAL GOLD ($BITCOIN) DIGITAL GOLD ($BITCOIN) is a blockchain-based project operating on the Solana network, which aims to combine the characteristics of traditional precious metals with the innovation of decentralized technologies. While it shares a name with Bitcoin, often referred to as “digital gold” due to its perception as a store of value, DIGITAL GOLD is a separate token designed to create a unique ecosystem within the Web3 landscape. Its goal is to position itself as a viable alternative digital asset, although specifics regarding its applications and functionalities are still developing. What is DIGITAL GOLD ($BITCOIN)? DIGITAL GOLD ($BITCOIN) is a cryptocurrency token explicitly designed for use on the Solana blockchain. In contrast to Bitcoin, which provides a widely recognized value storage role, this token appears to focus on broader applications and characteristics. Notable aspects include: Blockchain Infrastructure: The token is built on the Solana blockchain, known for its capacity to handle high-speed and low-cost transactions. Supply Dynamics: DIGITAL GOLD has a maximum supply capped at 100 quadrillion tokens (100P $BITCOIN), although details regarding its circulating supply are currently undisclosed. Utility: While precise functionalities are not explicitly outlined, there are indications that the token could be utilized for various applications, potentially involving decentralized applications (dApps) or asset tokenization strategies. Who is the Creator of DIGITAL GOLD ($BITCOIN)? At present, the identity of the creators and development team behind DIGITAL GOLD ($BITCOIN) remains unknown. This situation is typical among many innovative projects within the blockchain space, particularly those aligning with decentralized finance and meme coin phenomena. While such anonymity may foster a community-driven culture, it intensifies concerns about governance and accountability. Who are the Investors of DIGITAL GOLD ($BITCOIN)? The available information indicates that DIGITAL GOLD ($BITCOIN) does not have any known institutional backers or prominent venture capital investments. The project seems to operate on a peer-to-peer model focused on community support and adoption rather than traditional funding routes. Its activity and liquidity are primarily situated on decentralized exchanges (DEXs), such as PumpSwap, rather than established centralized trading platforms, further highlighting its grassroots approach. How DIGITAL GOLD ($BITCOIN) Works The operational mechanics of DIGITAL GOLD ($BITCOIN) can be elaborated on based on its blockchain design and network attributes: Consensus Mechanism: By leveraging Solana’s unique proof-of-history (PoH) combined with a proof-of-stake (PoS) model, the project ensures efficient transaction validation contributing to the network's high performance. Tokenomics: While specific deflationary mechanisms have not been extensively detailed, the vast maximum token supply implies that it may cater to microtransactions or niche use cases that are still to be defined. Interoperability: There exists the potential for integration with Solana’s broader ecosystem, including various decentralized finance (DeFi) platforms. However, the details regarding specific integrations remain unspecified. Timeline of Key Events Here is a timeline that highlights significant milestones concerning DIGITAL GOLD ($BITCOIN): 2023: The initial deployment of the token occurs on the Solana blockchain, marked by its contract address. 2024: DIGITAL GOLD gains visibility as it becomes available for trading on decentralized exchanges like PumpSwap, allowing users to trade it against SOL. 2025: The project witnesses sporadic trading activity and potential interest in community-led engagements, although no noteworthy partnerships or technical advancements have been documented as of yet. Critical Analysis Strengths Scalability: The underlying Solana infrastructure supports high transaction volumes, which could enhance the utility of $BITCOIN in various transaction scenarios. Accessibility: The potential low trading price per token could attract retail investors, facilitating wider participation due to fractional ownership opportunities. Risks Lack of Transparency: The absence of publicly known backers, developers, or an audit process may yield skepticism regarding the project's sustainability and trustworthiness. Market Volatility: The trading activity is heavily reliant on speculative behavior, which can result in significant price volatility and uncertainty for investors. Conclusion DIGITAL GOLD ($BITCOIN) emerges as an intriguing yet ambiguous project within the rapidly evolving Solana ecosystem. While it attempts to leverage the “digital gold” narrative, its departure from Bitcoin's established role as a store of value underscores the need for a clearer differentiation of its intended utility and governance structure. Future acceptance and adoption will likely depend on addressing the current opacity and defining its operational and economic strategies more explicitly. Note: This report encompasses synthesised information available as of October 2023, and developments may have transpired beyond the research period.

1.9k Total ViewsPublished 2025.05.13Updated 2025.05.13

What is $BITCOIN

Discussions

Welcome to the HTX Community. Here, you can stay informed about the latest platform developments and gain access to professional market insights. Users' opinions on the price of BTC (BTC) are presented below.

活动图片