Similar Trends? Just an Illusion: Why Bitcoin Today Is Fundamentally Different from 2022

marsbitPublished on 2026-01-20Last updated on 2026-01-20

Abstract

This article argues that comparing current Bitcoin price action to 2022 is a superficial and misleading analogy, as the underlying conditions are fundamentally different across three key areas. First, the macroeconomic backdrop is the complete inverse. 2022 was defined by high inflation, aggressive interest rate hikes, and tightening liquidity environment, forcing capital into risk-off mode. In contrast, the current environment features declining CPI, an impending rate-cutting cycle, and central banks re-injecting liquidity, creating a strong risk-on appetite for assets like Bitcoin. Charts are presented showing Bitcoin's negative correlation with CPI and its positive correlation with US liquidity indices. Second, the technical market structure differs significantly. The 2021-2022 period formed a bearish weekly "M-top" pattern, characteristic of a major cycle top. The recent pullback is framed as a potential "bear trap" within a larger bull market, with the $80,850-$62,000 zone acting as a major area of consolidation that offers a favorable risk-reward ratio for buyers. Third, and most crucially, the investor base has structurally changed. The 2020-2022 market was retail-driven and highly speculative. Post-2023, the approval of Bitcoin ETFs has ushered in an "era of institutionalization," creating a new class of structural, long-term holders. This has locked up supply, drastically reduced volatility from historical highs of 80-150% to a current 30-60%, and provided a stabl...

Original Author: Garrett

Original Compilation: Saoirse, Foresight News

Recently, some analysts have been comparing the current price trend of Bitcoin with that of 2022.

Admittedly, the short-term price movements may appear somewhat similar. However, from a long-term perspective, this comparison is entirely absurd.

Whether in terms of long-term price patterns, macroeconomic context, investor composition, or supply/demand and holding structures, the underlying logic of the two periods is fundamentally different.

In the analysis and trading of financial markets, the biggest mistake is to focus solely on short-term, superficial statistical similarities while ignoring long-term, macro, and fundamental driving factors.

Completely Opposite Macroeconomic Backgrounds

In March 2022, the United States was mired in high inflation and an interest rate hiking cycle, driven by factors including:

  • Excess liquidity during the COVID-19 pandemic;
  • The ripple effects of the Ukraine crisis, which further significantly pushed up inflation.

At that time, risk-free interest rates were continuously rising, liquidity was being systematically withdrawn, and financial conditions were constantly tightening.

In such an environment, the primary goal of capital was risk aversion. The Bitcoin trend we observed was essentially a distribution pattern at high levels during a tightening cycle.
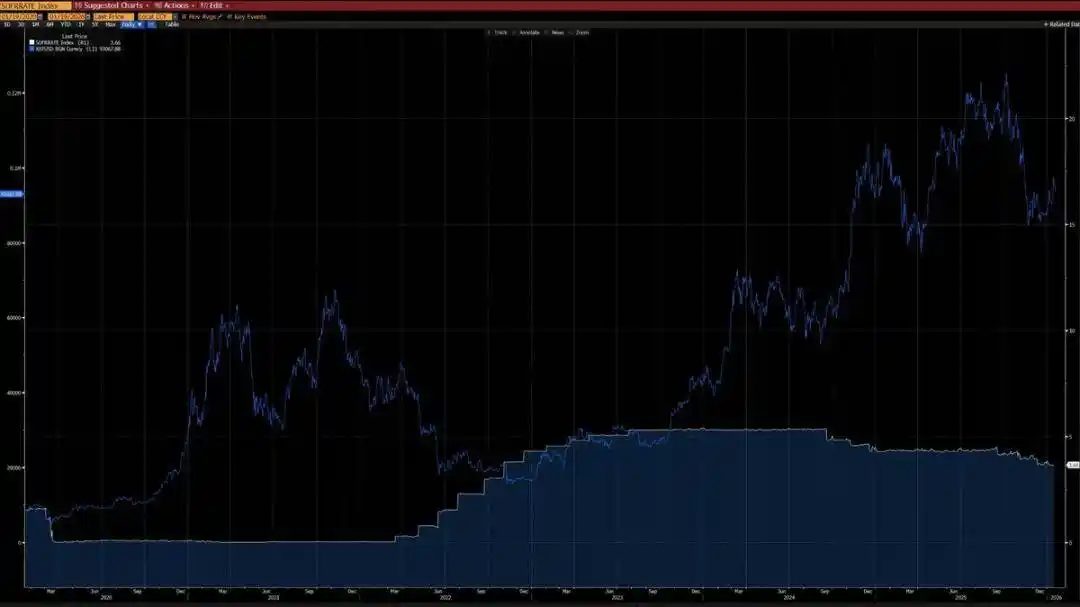
The current macroeconomic environment is precisely the opposite:

  • The situation of the Ukraine conflict is continuing to ease (partly due to U.S. efforts to reduce inflation and lower interest rates);
  • Both the Consumer Price Index (CPI) and U.S. risk-free interest rates are showing a downward trend;
  • More importantly, the AI technology revolution has significantly increased the likelihood of the economy entering a long-term deflationary cycle. Therefore, from a larger cycle perspective, interest rates have entered a rate-cutting phase;
  • Central banks are reinjecting liquidity into the financial system;
  • This means that capital currently exhibits "risk-on" characteristics.

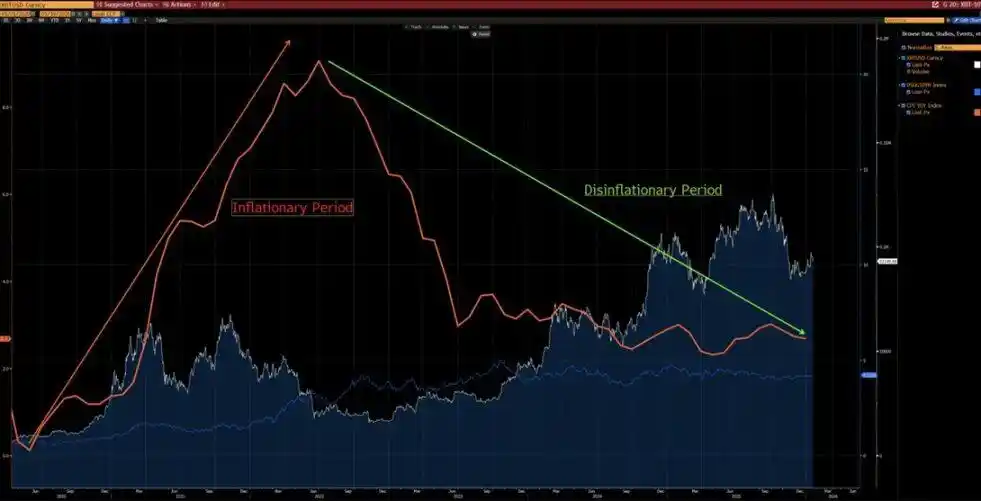
As can be seen from the chart below, since 2020, Bitcoin has shown a clear negative correlation with the year-on-year change in CPI—Bitcoin tends to fall during rising inflation cycles and rise during slowing inflation cycles.

Against the backdrop of the AI-driven technology revolution, long-term deflation is highly probable—a view also shared by Elon Musk, further corroborating our argument.
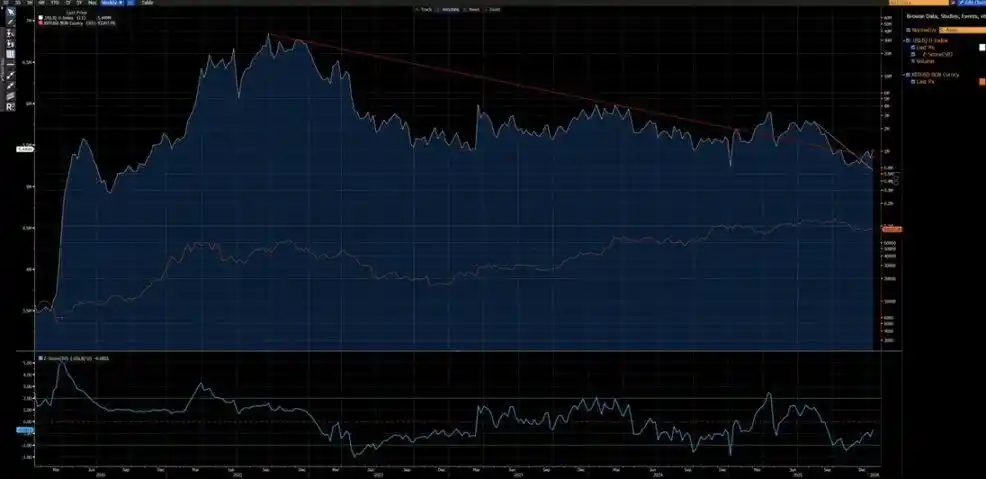
Another chart below also reveals that since 2020, Bitcoin has had an extremely strong correlation with the U.S. Liquidity Index (with the exception of data deviations in 2024 due to ETF inflows). Currently, the U.S. Liquidity Index has broken through both the short-term (white line) and long-term (red line) downtrend lines—a new uptrend is emerging.

Distinctly Different Technical Structures

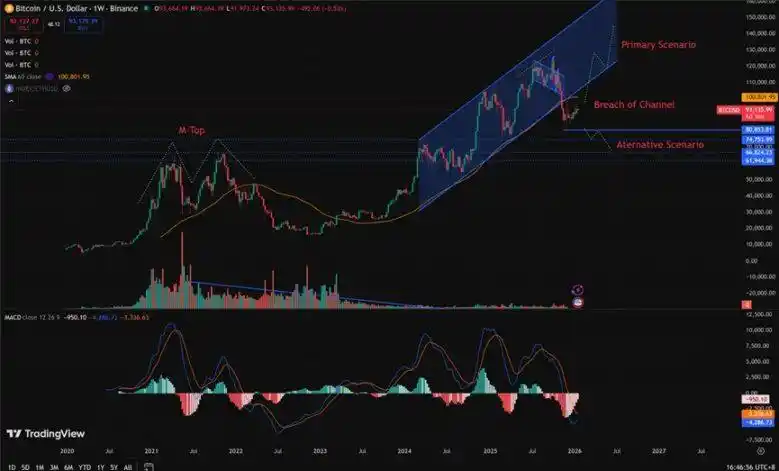
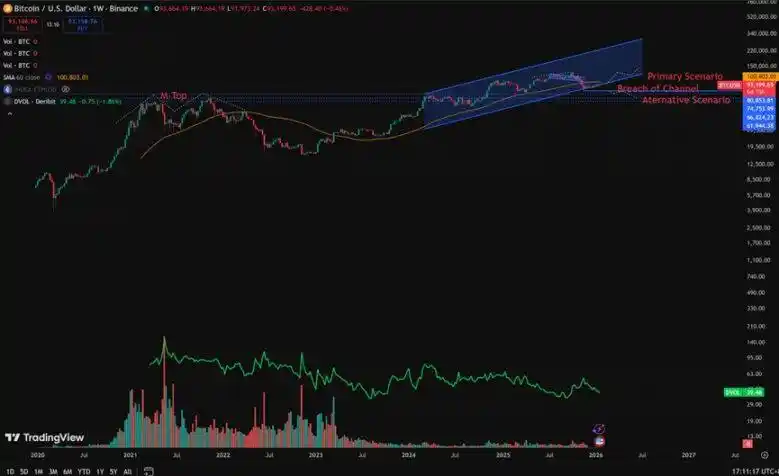
  • 2021-2022: A weekly "M-top" structure, a pattern typically associated with long-cycle market tops, which tends to suppress price movements for an extended period.
  • 2025 (affecting early 2026 trends): A weekly break below the rising channel. From a probabilistic perspective, this is more likely a "bear trap" before a rebound back into the channel.

Of course, we cannot completely rule out the possibility that the current trend evolves into a continuation of the 2022-style bear market. However, it must be noted that the $80,850-$62,000 range has previously experienced large-scale consolidation and筹码 exchange.

This prior process of筹码 accumulation provides a far superior risk-reward ratio for bullish positions—upside potential significantly outweighs downside risk.

What Conditions Are Needed to Repeat a 2022-Style Bear Market?

To repeat a bear market like 2022, the following hard conditions must be met:

  • A new round of inflation shock, or a major geopolitical crisis on a scale equivalent to 2022;
  • Central banks restarting interest rate hikes, or resuming balance sheet quantitative tightening (QT) policies;
  • A decisive and sustained break below the $80,850 level for Bitcoin's price.

Until all these conditions are met, declaring a structural bear market is premature and constitutes a speculative judgment rather than a conclusion based on rational analysis.

Markedly Different Investor Structures

  • 2020-2022: The market was dominated by retail investors, with limited institutional participation, especially from long-term allocation institutions.
  • Since 2023: The launch of Bitcoin ETFs introduced "structural long-term holders," effectively locking up part of the Bitcoin supply, significantly reducing trading activity, and markedly lowering volatility.

2023 marked a structural inflection point for Bitcoin as an asset, both from a macroeconomic and quantitative analysis standpoint.

Bitcoin's volatility range has also undergone a fundamental shift:

  • Historical volatility: 80%-150%
  • Current volatility: 30%-60%

This change signifies a fundamental shift in Bitcoin's asset attributes.

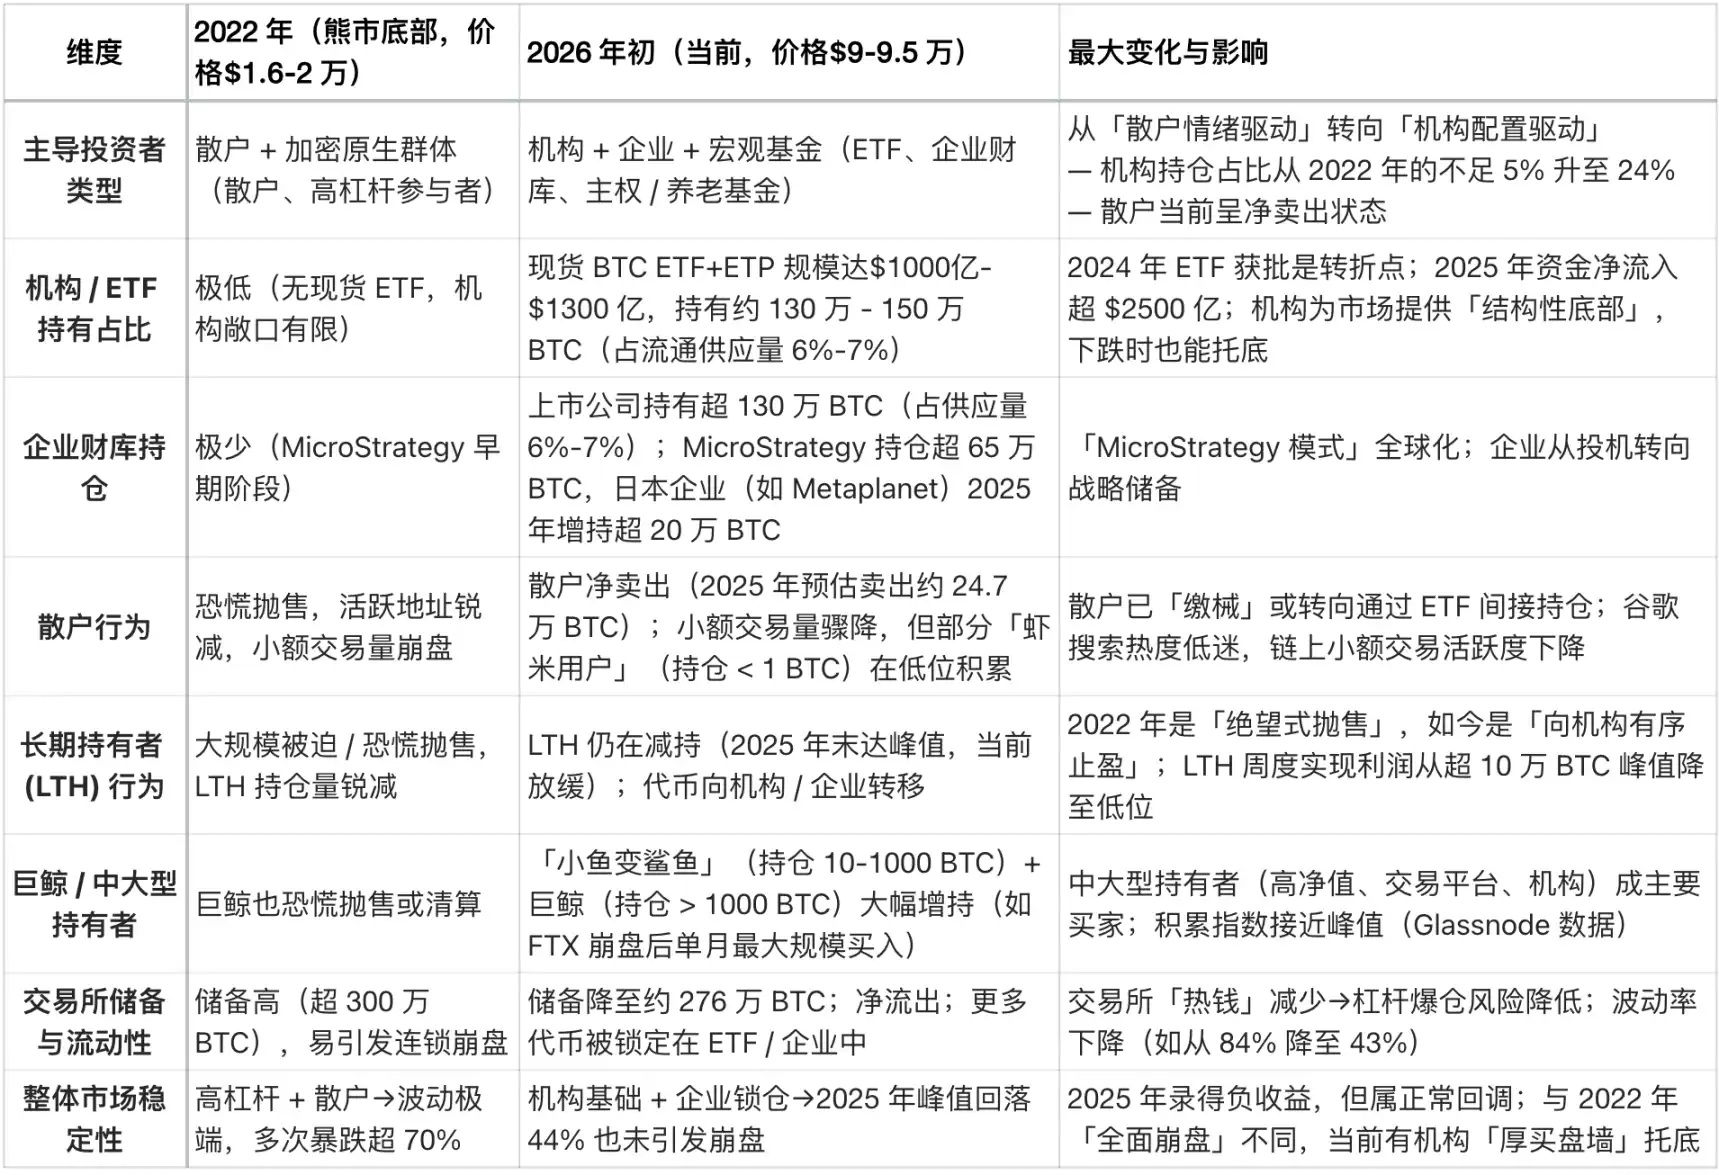
Core Structural Differences (Current vs. 2022)

The biggest difference in Bitcoin's investor structure between early 2026 and 2022 is the shift from a "retail-dominated, high-leverage speculation" market to an "institution-dominated, structural long-term holding" market.

In 2022, Bitcoin experienced a typical "crypto-native bear market," triggered by retail panic selling and cascading leverage liquidations.

Today, Bitcoin has entered a much more mature "institutional era," characterized by:

  • Stable underlying demand
  • Part of the supply being locked long-term
  • Volatility reaching institutional-grade levels

Below is a core comparison by Grok based on on-chain data (e.g., Glassnode, Chainalysis) and institutional reports (e.g., Grayscale Investments, Bitwise, State Street) from mid-January 2026 (when Bitcoin was in the $90,000 - $95,000 range):
Trending Cryptos

Related Questions

QWhat are the key differences in macroeconomic conditions between 2022 and the current period (2026) according to the article?

AIn 2022, the US faced high inflation and a rate-hiking cycle driven by pandemic-era excess liquidity and the Ukraine crisis, leading to tightening financial conditions and risk-off capital. Currently, the CPI and risk-free rates are declining, the AI revolution suggests long-term deflation, central banks are injecting liquidity, and capital is risk-on.

QHow does the technical structure of Bitcoin's price action differ between 2021-2022 and 2025-2026?

AIn 2021-2022, Bitcoin formed a weekly 'M-top' pattern, typical of long-term market tops. In 2025-2026, it broke below an ascending channel on weekly charts, which is more likely a bear trap before a rebound into the channel.

QWhat conditions would need to be met for a bear market similar to 2022 to occur again?

AA new inflationary shock or major geopolitical crisis on par with 2022, central banks restarting rate hikes or quantitative tightening (QT), and a decisive and sustained break below the $80,850 level for Bitcoin.

QHow has Bitcoin's investor structure changed from 2020-2022 to the present (2026)?

AFrom 2020-2022, the market was retail-driven with limited institutional participation. Since 2023, Bitcoin ETFs have introduced structural long-term holders, locking up supply, reducing trading activity, and lowering volatility to 30%-60% from historical 80%-150%.

QWhat is the core structural difference between the current market and the 2022 market, as per the article?

AThe core difference is the shift from a 'retail-driven, highly leveraged speculation' market in 2022 to an 'institution-driven, structural long-term holding' market now, characterized by stable underlying demand, partially locked supply, and institutional-grade volatility.

Related Reads

As Consensus Accelerates, What Are Young Investors Betting On?

Title: As Consensus Forms Faster, What Are Young Investors Betting On? In the rapid evolution of tech investment, a new generation of young investors is navigating a landscape where AI, robotics, commercial aerospace, and quantum computing are advancing simultaneously. Traditional investment logic based on financial models is giving way to a need for deep technical understanding and the ability to act before industry consensus forms. An analysis of trends from the "WAIC FUTURE TECH" list of young investment leaders reveals key shifts in focus. The first major trend is the movement of AI from the digital screen into the physical world. Investment is shifting from large language models and chatbots towards embodied AI, robotics, AI hardware, and edge computing. While demonstrations generate excitement, the real challenge lies in achieving scalable, reliable, and cost-effective delivery in complex real-world environments like factories and logistics. Success depends not just on algorithms but on the integration of sensors, actuators, and control systems. Second, the competitive focus for large models is moving beyond raw capability toward building an "intelligence flywheel." The goal is to create self-reinforcing systems where user interaction generates data, improving the model, which in turn enhances the user experience and attracts more engagement. Companies that successfully embed AI into workflows to create these closed-loop systems can build lasting value that isn't easily erased by the next model upgrade. Third, facing a potential bottleneck in high-quality human-generated data, investors are looking at new underlying technologies. Reinforcement learning and self-play, as demonstrated by AlphaGo Zero, offer paths for AI to generate its own experience. Scientific foundation models, which aim to build general AI capabilities for fields like life sciences and materials discovery, represent a non-consensus direction that could unlock new frontiers of knowledge and data. Finally, in deep-tech areas like quantum computing, commercial aerospace, and space-based infrastructure, patient capital is essential. These fields have long, uncertain development and validation cycles involving complex engineering, supply chains, and regulations. Investment here requires a long-term view, focusing on foundational team capabilities and the eventual emergence of market demand, even if commercial returns are distant. Collectively, these trends illustrate how young investors are adapting to a new era. They are learning to make earlier, technically-informed judgments, balance hype with real-world viability, and provide the patient capital needed to build the deep-tech foundations of the future.

marsbit9m ago

As Consensus Accelerates, What Are Young Investors Betting On?

marsbit9m ago

Can Japan Buy Growth with AI? Will the Bond Market Believe It?

Japan's cabinet has introduced the 2026 Basic Policy on Economic and Fiscal Management and Reform, shifting its primary fiscal target. The new framework moves away from the traditional annual primary balance goal and instead prioritizes a stable reduction of the debt-to-GDP ratio. This change is tied to a strategy of increased "responsible proactive fiscal" spending, aiming to boost long-term growth through investments in strategic sectors like AI, semiconductors, energy, and robotics. The government estimates total public and private investment in 62 key technologies could exceed 370 trillion yen by 2040. The market reaction has been mixed and cautious. While equity markets may respond to policy signals, bond markets are focused on fiscal credibility. Concerns center on whether the weakening of the clear primary balance anchor could lead to looser fiscal discipline. If investors doubt that these strategic investments will generate sufficient productivity gains, tax revenue, and nominal growth to outpace rising interest costs, they may demand higher yields on Japanese Government Bonds (JGBs). Recent volatility in the yen and JGB yields, with the 10-year yield briefly reaching 2.9%, reflects this skepticism. The success of this new framework hinges on two factors: whether Japan can achieve a nominal growth rate consistently higher than its long-term interest rates, and whether future budgets demonstrate disciplined control over bond issuance. The government's narrative is that strategic investment is essential to break Japan's cycle of low growth, aging, and labor shortages. However, the bond market will continuously assess the credibility of this plan, pricing the risk that it may represent fiscal expansion rather than a viable growth strategy.

marsbit46m ago

Can Japan Buy Growth with AI? Will the Bond Market Believe It?

marsbit46m ago

Misjudged A-Shares: Resilience, Expectations, and Confidence

China's A-share market recently faced selling pressure, especially in tech sectors, initially triggered by a global tech sell-off that began in South Korea. However, the article argues this is a case of "mistaken injury" and highlights the market's underlying resilience. This resilience stems from three main pillars: **1) Tech Sector Fundamentals:** Unlike Korea's market dominated by a few memory chip stocks, China's tech sector is diversified across computing, communications, electronics, and semiconductors, supported by dual narratives of global AI supply chains and domestic substitution. Core areas like optical modules and fiber optics continue to show strong earnings growth. **2) "National Team" Support:** State-backed institutions and large corporations have made significant market purchases and announced buybacks, providing liquidity and signaling confidence. This is seen as a stabilizing policy signal, often associated with market bottoms. **3) Broader Market Pillars:** Other major sectors are showing endogenous recovery momentum. Consumer stocks benefit from stabilizing CPI and signs of sector recovery (e.g., liquor price hikes). Cyclical sectors like aluminum have high earnings, potential price increases due to tight supply, and low valuations. The financial sector offers stable dividends and low valuations. The conclusion is that the sell-off was driven by external contagion, not a collapse in fundamentals. With strong policy support and recovering momentum across key sectors, the A-share market possesses the toughness to regain stability.

marsbit1h ago

Misjudged A-Shares: Resilience, Expectations, and Confidence

marsbit1h ago

Trading

Spot

Hot Articles

What is $BITCOIN

DIGITAL GOLD ($BITCOIN): A Comprehensive Analysis Introduction to DIGITAL GOLD ($BITCOIN) DIGITAL GOLD ($BITCOIN) is a blockchain-based project operating on the Solana network, which aims to combine the characteristics of traditional precious metals with the innovation of decentralized technologies. While it shares a name with Bitcoin, often referred to as “digital gold” due to its perception as a store of value, DIGITAL GOLD is a separate token designed to create a unique ecosystem within the Web3 landscape. Its goal is to position itself as a viable alternative digital asset, although specifics regarding its applications and functionalities are still developing. What is DIGITAL GOLD ($BITCOIN)? DIGITAL GOLD ($BITCOIN) is a cryptocurrency token explicitly designed for use on the Solana blockchain. In contrast to Bitcoin, which provides a widely recognized value storage role, this token appears to focus on broader applications and characteristics. Notable aspects include: Blockchain Infrastructure: The token is built on the Solana blockchain, known for its capacity to handle high-speed and low-cost transactions. Supply Dynamics: DIGITAL GOLD has a maximum supply capped at 100 quadrillion tokens (100P $BITCOIN), although details regarding its circulating supply are currently undisclosed. Utility: While precise functionalities are not explicitly outlined, there are indications that the token could be utilized for various applications, potentially involving decentralized applications (dApps) or asset tokenization strategies. Who is the Creator of DIGITAL GOLD ($BITCOIN)? At present, the identity of the creators and development team behind DIGITAL GOLD ($BITCOIN) remains unknown. This situation is typical among many innovative projects within the blockchain space, particularly those aligning with decentralized finance and meme coin phenomena. While such anonymity may foster a community-driven culture, it intensifies concerns about governance and accountability. Who are the Investors of DIGITAL GOLD ($BITCOIN)? The available information indicates that DIGITAL GOLD ($BITCOIN) does not have any known institutional backers or prominent venture capital investments. The project seems to operate on a peer-to-peer model focused on community support and adoption rather than traditional funding routes. Its activity and liquidity are primarily situated on decentralized exchanges (DEXs), such as PumpSwap, rather than established centralized trading platforms, further highlighting its grassroots approach. How DIGITAL GOLD ($BITCOIN) Works The operational mechanics of DIGITAL GOLD ($BITCOIN) can be elaborated on based on its blockchain design and network attributes: Consensus Mechanism: By leveraging Solana’s unique proof-of-history (PoH) combined with a proof-of-stake (PoS) model, the project ensures efficient transaction validation contributing to the network's high performance. Tokenomics: While specific deflationary mechanisms have not been extensively detailed, the vast maximum token supply implies that it may cater to microtransactions or niche use cases that are still to be defined. Interoperability: There exists the potential for integration with Solana’s broader ecosystem, including various decentralized finance (DeFi) platforms. However, the details regarding specific integrations remain unspecified. Timeline of Key Events Here is a timeline that highlights significant milestones concerning DIGITAL GOLD ($BITCOIN): 2023: The initial deployment of the token occurs on the Solana blockchain, marked by its contract address. 2024: DIGITAL GOLD gains visibility as it becomes available for trading on decentralized exchanges like PumpSwap, allowing users to trade it against SOL. 2025: The project witnesses sporadic trading activity and potential interest in community-led engagements, although no noteworthy partnerships or technical advancements have been documented as of yet. Critical Analysis Strengths Scalability: The underlying Solana infrastructure supports high transaction volumes, which could enhance the utility of $BITCOIN in various transaction scenarios. Accessibility: The potential low trading price per token could attract retail investors, facilitating wider participation due to fractional ownership opportunities. Risks Lack of Transparency: The absence of publicly known backers, developers, or an audit process may yield skepticism regarding the project's sustainability and trustworthiness. Market Volatility: The trading activity is heavily reliant on speculative behavior, which can result in significant price volatility and uncertainty for investors. Conclusion DIGITAL GOLD ($BITCOIN) emerges as an intriguing yet ambiguous project within the rapidly evolving Solana ecosystem. While it attempts to leverage the “digital gold” narrative, its departure from Bitcoin's established role as a store of value underscores the need for a clearer differentiation of its intended utility and governance structure. Future acceptance and adoption will likely depend on addressing the current opacity and defining its operational and economic strategies more explicitly. Note: This report encompasses synthesised information available as of October 2023, and developments may have transpired beyond the research period.

972 Total ViewsPublished 2025.05.13Updated 2025.05.13

What is $BITCOIN

Discussions

Welcome to the HTX Community. Here, you can stay informed about the latest platform developments and gain access to professional market insights. Users' opinions on the price of BTC (BTC) are presented below.

活动图片