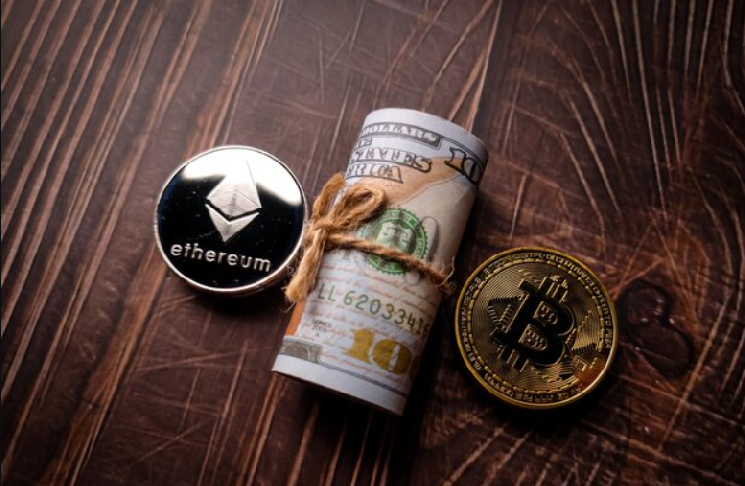
Has Bitcoin Become 'Stable'? Its 2025 Volatility Actually Lower Than Nvidia's

marsbitPublished on 2026-01-05Last updated on 2026-01-05

Abstract

Bitcoin's daily volatility dropped to a record low of 2.24% in 2025, marking its least volatile year on record. Despite significant price swings—including a 36% drawdown in October—the asset's volatility has steadily declined each cycle, now even lower than NVIDIA's. This shift reflects deeper structural maturity: institutional participation via ETFs, corporate treasury adoption, and regulated custodians have increased market depth and stability. Large capital flows now cause smaller price impacts, reducing the cascading liquidations seen in earlier cycles. While absolute dollar volatility remains high, the market absorbs shocks more efficiently, repositioning Bitcoin as a macro asset rather than a speculative instrument. Lower volatility enables broader institutional adoption through retirement funds and investment portfolios, reinforcing a cycle of growing demand and stability.

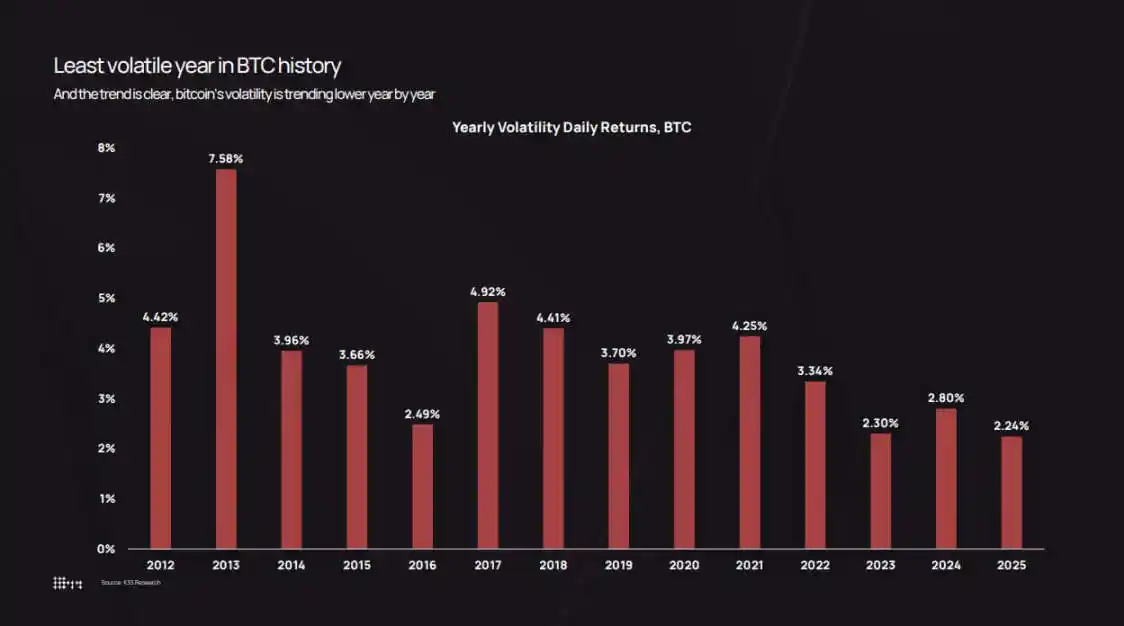
Bitcoin concluded 2025 with a realized daily volatility of 2.24%, marking the lowest annual figure on record for the asset.

K33 Research's volatility chart, which dates back to 2012—when Bitcoin's daily volatility was 7.58%—shows that volatility has steadily decreased each cycle: 3.34% in 2022, 2.80% in 2024, and dropping to 2.24% in 2025.

However, market perception diverges from the data. In October 2025, Bitcoin's price fell from $126,000 to $80,500, a nerve-wracking process; on October 10th, a wave of liquidations triggered by tariff policies wiped out $19 billion in leveraged long positions in a single day.

The paradox lies here: by traditional standards, Bitcoin's volatility has indeed decreased, but compared to previous cycles, it is attracting larger inflows of capital, and the absolute magnitude of price swings is also greater.

Low volatility does not mean "the market has gone quiet"; rather, it indicates the market is now mature enough to handle institutional-scale capital flows without reverting to the "chain-reaction" feedback loops seen in earlier cycles.

Today, ETFs, corporate treasuries, and regulated custodians act as "ballast" for market liquidity, while long-term holders are steadily reallocating assets into this infrastructure.

The end result: Bitcoin's daily returns are more stable, yet market cap fluctuations still amount to hundreds of billions of dollars—swings that would have triggered an 80% crash back in 2018 or 2021.

Volatility Continues to Decline

K33's annual volatility data documents this transition.

In 2013, Bitcoin's average daily return was 7.58%, reflecting the thin order books and speculative fervor of the market at that time. By 2017, this figure had dropped to 4.81%; in 2020, it was 3.98%; during the pandemic bull market of 2021, it saw a slight rebound to 4.13%. In 2022, the successive collapses of Luna, Three Arrows Capital, and the FTX exchange pushed volatility up to 3.34%.

Since then, volatility has continued its downward trend: 2.94% in 2023, 2.80% in 2024, and 2.24% in 2025.

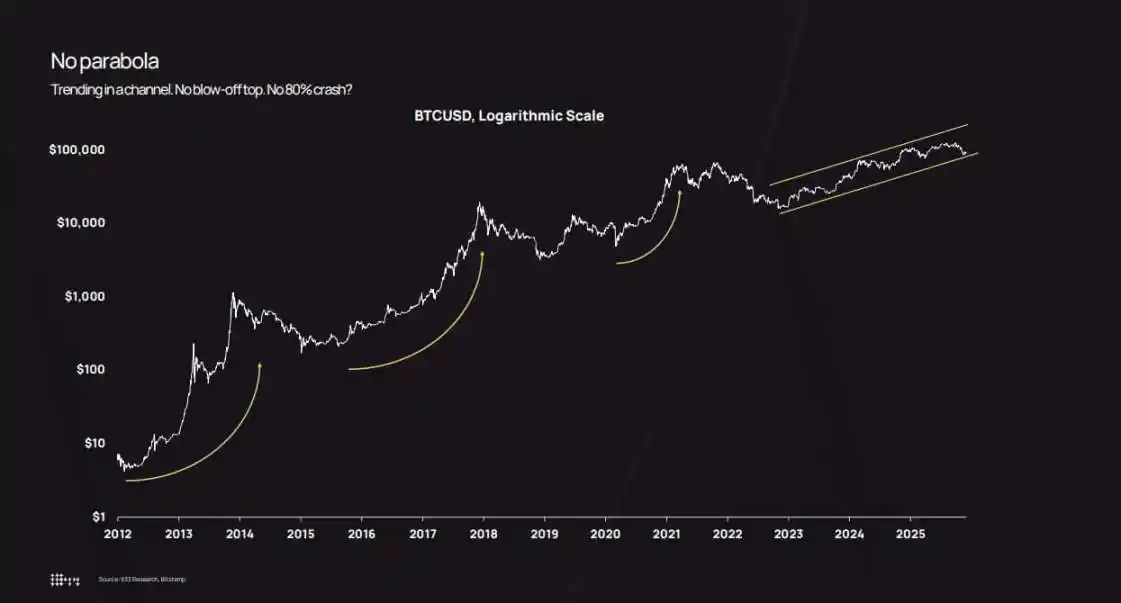
A logarithmic price chart further confirms this trend. From 2022 to 2025, Bitcoin did not experience extreme "pump-and-dump" rallies but instead climbed steadily within an upward channel.

There were pullbacks—the price dropped below $50,000 in August 2024 and to $80,500 in October 2025—but none resulted in a "parabolic surge followed by a systemic crash."

Analysis points out that the approximately 36% decline in October 2025 still falls within the normal range of historical Bitcoin drawdowns. The difference is that previous 36% corrections often occurred at the tail end of high volatility periods around 7%, whereas this one appeared during a low volatility period of 2.2%.

This creates a "perception gap": a 36% drop over six weeks still feels剧烈 intuitively; but compared to early cycles (when intraday 10% swings were the norm), the price action in 2025 was relatively calm.

Asset management firm Bitwise points out that Bitcoin's realized volatility is now lower than Nvidia's, a shift that redefines Bitcoin's positioning from a "pure speculative tool" to a "high-beta macro asset."

Market Cap Expansion, Institutional Entry, and Asset Reallocation

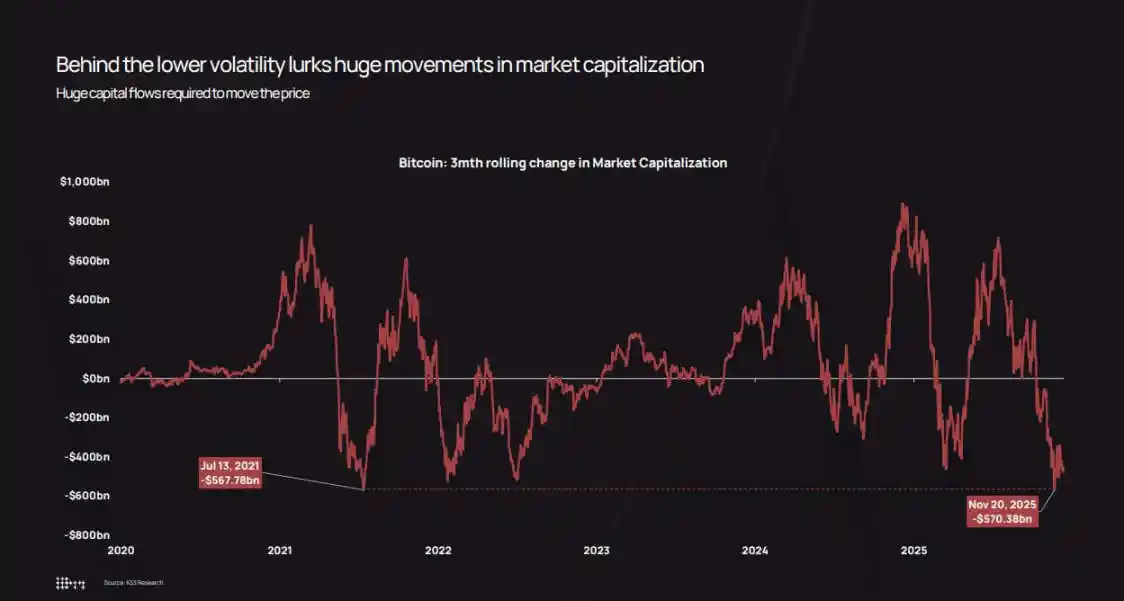
K33's core view is that the decline in realized volatility is not due to reduced capital inflows, but because it now takes much larger capital movements to move the price.

The firm's chart of "three-month changes in Bitcoin's market cap" shows that even during this low-volatility cycle, fluctuations in market cap still amount to hundreds of billions of dollars.

During the October-November 2025 pullback, Bitcoin's market cap evaporated approximately $570 billion, nearly identical to the $568 billion drawdown in July 2021.

The magnitude of the swings hasn't changed; what has changed is the "depth" of the market absorbing these swings.

Three structural factors have driven the decline in volatility:

First, the "accumulation" effect of ETFs and institutions. K33 statistics show that ETFs net purchased approximately 160,000 Bitcoin in 2025 (though lower than the 630,000+ in 2024, the scale remains considerable). ETFs and corporate treasuries combined added about 650,000 Bitcoin, accounting for over 3% of the circulating supply. This capital entered the market through "programmatic rebalancing," not driven by retail FOMO sentiment.

K33 specifically notes that even as Bitcoin's price fell about 30%, ETF holdings only decreased by single-digit percentages, with no panic redemptions or forced liquidations.

Second, corporate treasuries and structured issuance. By the end of 2025, corporate treasuries cumulatively held approximately 473,000 Bitcoin (the pace of accumulation slowed in the second half of the year). New demand came more from preferred stock and convertible bond issuance rather than direct cash purchases—because finance teams execute capital structure strategies quarterly, unlike traders chasing short-term market trends.

Third, the reallocation of assets from early holders to a broader base. K33's "asset holding period analysis" shows that since early 2023, Bitcoin dormant for over two years began steadily "activating"; over the past two years, about 1.6 million long-held Bitcoin entered circulation.

2024 and 2025 were the two years with the largest activation of "dormant assets." The report mentions that in July 2025, Galaxy Digital sold 80,000 Bitcoin, and Fidelity sold 20,400 Bitcoin.

These sales恰好 coincided with the "structural demand" from ETFs, corporate treasuries, and regulated custodians—who build their holdings gradually over months.

This reallocation is crucial: early holders accumulated Bitcoin at prices between $100 and $10,000, with assets often in a few concentrated wallets; when they sell, the assets flow to ETF shareholders, corporate balance sheets, and high-net-worth clients buying small amounts through diversified portfolios.

The end result: lower concentration of Bitcoin ownership, thicker order books, and weakened "chain-reaction feedback loops." In early cycles, a sale of 10,000 Bitcoin into a illiquid market could cause a 5% to 10% price crash, triggering stops and liquidations; but in 2025, such a sale attracts buy-side interest from multiple institutional channels, potentially even pushing the price up 2% to 3%. Feedback loops weaken, and daily volatility decreases accordingly.

Portfolio Construction, Leverage Shocks, and the End of "Parabolic Cycles"

The decline in realized volatility changes the calculus for institutions regarding "Bitcoin allocation size."

Modern Portfolio Theory suggests that asset allocation weights should be based on "risk contribution" rather than "return potential." The same 4% allocation to Bitcoin: if daily volatility is 7%, its contribution to portfolio risk is far higher than when volatility is 2.2%.

This mathematical fact forces asset allocators to choose: either increase the allocation to Bitcoin, or utilize options and structured products (assuming the underlying asset's volatility is more stable).

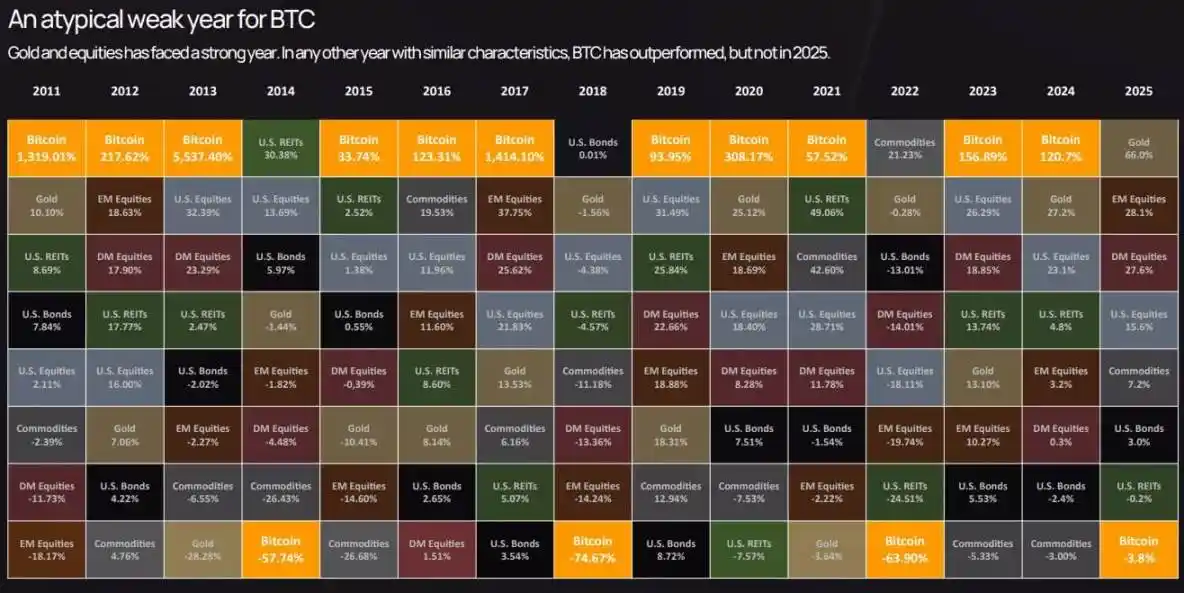
K33's cross-asset performance table shows Bitcoin ranked near the bottom in terms of asset returns in 2025—despite outperforming for multiple years in previous cycles, it lagged behind gold and stocks in 2025.

This "underperformance," combined with low volatility, shifts Bitcoin's定位 from a "speculative satellite asset" to a "core macro asset"—with risk similar to stocks, but return drivers uncorrelated with other assets.

The options market also reflects this shift: recent Bitcoin option implied volatility has declined alongside realized volatility, lowering hedging costs and making synthetic structured products more attractive.

Previously, compliance departments often restricted financial advisors from allocating to Bitcoin due to "excessive volatility"; now, advisors have quantitative grounds: in 2025, Bitcoin's volatility was lower than Nvidia's, lower than many tech stocks, and comparable to high-beta stock sectors.

This opens new investment channels for Bitcoin: inclusion in 401(k) retirement plans, allocations by Registered Investment Advisors (RIAs), and insurance company portfolios with strict volatility limits.

K33's forward-looking data predicts that as these channels open, 2026 ETF net inflows will exceed those of 2025, creating a "self-reinforcing cycle": more institutional inflows → lower volatility → unlocking more institutional mandates → more inflows.

But the market's "calm" is conditional. K33's derivatives analysis shows that throughout 2025, Bitcoin perpetual swap open interest steadily rose in a "low vol, strong uptrend" environment, culminating in the October 10th liquidation event—which wiped out $19 billion in leveraged longs in a single day.

This sell-off was related to President Trump's tariff announcement and broad "risk-off sentiment," but the core mechanism was still a derivatives issue: excessive leveraged longs, thin weekend liquidity, cascading margin calls.

Even with an annual realized volatility of 2.2%, "extreme volatility days triggered by leverage unwinds" can still be hidden. The difference is: such events are now resolved within hours, not weeks; and because现货 demand from ETFs and corporate treasuries provides a "price floor," the market can recover quickly.

The structural backdrop for 2026 supports the view that "volatility will remain low or decline further": K33 expects selling from early holders to decrease as the two-year-old Bitcoin supply stabilizes; additionally, there are positive regulatory signals—the U.S. CLARITY Act, full implementation of Europe's MiCA, and Morgan Stanley and Bank of America opening 401(k) and wealth management channels.

K33's "Golden Opportunity" data predicts Bitcoin will outperform stock indices and gold in 2026—because the impact of regulatory breakthroughs and new capital will outweigh selling pressure from existing holders.

Whether this prediction materializes remains uncertain, but the mechanisms driving it—deepening liquidity, improved institutional infrastructure, regulatory clarity—do provide support for low volatility.

Ultimately, the Bitcoin market is moving away from the "speculative frontier"属性 of 2013 or 2017, closer to a "highly liquid, institutionally-anchored macro asset."

This does not mean Bitcoin becomes "boring" (e.g., low returns or lack of narrative), but rather that the "rules of the game have changed": price paths are smoother, the options market and ETF flows matter more than retail sentiment, and the core market changes are reflected in structure, leverage levels, and the composition of buyers and sellers.

In 2025, despite undergoing its largest-ever regulatory and structural changes, Bitcoin became an "institutionalized,平稳 asset" from a volatility perspective.

The value in understanding this transition is this: low realized volatility is not a signal of an "asset losing its vitality," but a sign that "the market is mature enough to handle institutional-scale capital without crashing."

The cycle hasn't ended; it's just that the "cost" of moving the market has become higher.

Trending Cryptos

Related Questions

QWhat was Bitcoin's daily volatility rate in 2025, and how does it compare historically?

ABitcoin's daily volatility rate in 2025 was 2.24%, which is the lowest annual figure in its recorded history. This represents a steady decline from previous cycles, such as 7.58% in 2012, 3.34% in 2022, and 2.80% in 2024.

QWhat are the three main structural factors identified by K33 Research that contributed to the decline in Bitcoin's volatility?

AThe three main structural factors are: 1) The accumulation effect of ETFs and institutions, which provided programmatic, non-FOMO-driven buying. 2) Corporate treasury purchases and structured issuances, which are based on long-term capital strategies rather than short-term trading. 3) The redistribution of assets from early holders to a broader base of investors, including ETF shareholders and corporations, which increases market depth and reduces concentration.

QHow did the market's reaction to a large sell-off in 2025 differ from earlier cycles, according to the article?

AIn earlier cycles, a sell-off of 10,000 BTC in a thin market could cause a price crash of 5-10%, triggering stop-losses and liquidations. In 2025, the same sell-off was absorbed by multiple institutional buyers, potentially even causing a price increase of 2-3%, demonstrating a weakened feedback loop and greater market depth.

QWhat significant event occurred on October 10, 2025, and what was its impact?

AOn October 10, 2025, a liquidation cascade, triggered by tariff policy concerns and broader risk-off sentiment, wiped out $19 billion in leveraged long positions in a single day. This event highlighted that extreme volatility days from leverage unwinding can still occur even in a low overall volatility environment.

QHow does the article suggest Bitcoin's role in investment portfolios is changing due to its lower volatility?

ALower volatility is shifting Bitcoin's role from a 'speculative satellite asset' to a 'core macro asset.' This change allows it to be considered for inclusion in 401(k) retirement plans, portfolios of Registered Investment Advisors (RIAs), and insurance company portfolios that have strict volatility limits, as its risk profile becomes more comparable to stocks.

Related Reads

The New Cold War is a Tech Stock War

The New Cold War is a Tech Stock War The article argues that the contemporary geopolitical and economic rivalry between the US and China represents a "New Cold War," but one fundamentally fought through technology and financial markets, not physical barriers or conventional trade. Historically, US dominance was secured through financial systems. The Soviet Union, reliant on the rigid "Transferable Ruble," was ultimately undermined by its dependency on the US dollar for oil trade. Later, Japan's semiconductor challenge was countered not just by tariffs (e.g., Plaza Accord, 301 investigations) but by binding it to US Treasury bonds. China presents a more complex, "embedded" challenger. While it holds vast dollar reserves and US debt like Japan, its industrial base is stronger and more diversified than the Soviet Union's. Surviving the initial 2018 trade war phase, the conflict has evolved into a "tech-financial war." The core battlefield is now the stock market. US tech stocks (AI, semiconductors) are treated as sovereign assets, buoyed by bipartisan national will. China is pushing to strengthen its own financial markets to convert industrial strength into financial power and fund its tech ambitions. Companies like ChangXin (semiconductors), Moonshot AI, and DJI compete not just for market share but as financial proxies for their respective systems. The new paradigm is moving from globally efficient monopolies (Apple, Google) towards companies that achieve monopolistic profits within their respective geopolitical spheres. This competition over "pricing power" and financial valuation in segmented markets defines the current era, making the stock market the primary arena for this tech-centric struggle.

marsbit10m ago

The New Cold War is a Tech Stock War

marsbit10m ago

RWA Weekly: Ten European Financial Institutions Establish Tokenized Asset Cooperative; Ondo Launches New Execution Network Ondo Network

RWA Weekly: European Banks Form Tokenized Asset Cooperative; Ondo Launches New Execution Network Ondo Network Covering July 24-31, 2026, the RWA sector saw a steady on-chain total value locked (TVL) of $36.8 billion, with holder count hitting a record high. However, stablecoin transfer volumes fell sharply (~30%), indicating low on-chain settlement demand. Key regulatory moves include South Korea advancing stablecoin legislation and a push to scrap crypto taxes, Kenya lowering capital requirements for stablecoin issuers, and Zimbabwe approving seven projects for its crypto sandbox. In project developments, BIS-led Project Agorá successfully tested cross-border payments with tokenized funds across six currencies. Ten major European financial institutions formed the RL1 blockchain cooperative to build tokenized asset infrastructure. Other notable updates: Aviva launched a tokenized dollar liquidity fund on XRPL, POSCO International tokenized commercial invoices on Injective, and a Brazilian farmer used tokenized cattle as collateral for a loan. Additional progress includes BNY Mellon migrating its core transfer agent operations to blockchain, Securitize gaining SEC investment advisor registration, and Tether’s compliant stablecoin USA₮ launching on Celo. Ondo Finance introduced Ondo Network, a new execution layer focused on speed and privacy, moving away from its initial chain plans. An analysis highlights that despite the growing scale of on-chain RWAs (~$32B), approximately 90% remain underutilized in DeFi, pointing to a critical challenge in unlocking liquidity and fostering real-world application beyond mere issuance.

marsbit10m ago

RWA Weekly: Ten European Financial Institutions Establish Tokenized Asset Cooperative; Ondo Launches New Execution Network Ondo Network

marsbit10m ago

South Korean Stock Market Sees Sharp Rebound After Forceful De-leveraging, SK Hynix Rises 30%

On July 31, South Korean stocks staged a historic rebound. The benchmark KOSPI index surged 18.27%, with chipmaker SK Hynix hitting a 30% gain limit. This followed a brutal, near-40% decline in the KOSPI over the previous month, driven largely by a deleveraging spiral involving leveraged ETFs. Analysts attributed the sharp sell-off to structural liquidity issues rather than deteriorating corporate fundamentals. The rally was triggered by a confluence of positive catalysts. Firstly, strong earnings from U.S. cloud giants Microsoft and Amazon alleviated fears of an "AI bubble burst," boosting global tech sentiment. Secondly, SK Group Chairman Chey Tae-won made a rare personal purchase of SK Hynix shares, seen as a strong vote of confidence. Thirdly, the South Korean government announced a 20 trillion won ($139 billion) AI investment fund. In response to the market turmoil, South Korean regulators are tightening controls on leveraged ETFs, admitting oversight shortcomings. Measures include raising minimum cash保证金 requirements for散户 investors and suspending new product launches. While the rebound signals eased liquidity pressure, analysts note deep structural issues remain. The market's future stability is seen as dependent on global tech capital expenditure trends and memory chip price cycles, with some viewing the surge as a technical correction rather than a definitive trend reversal.

marsbit31m ago

South Korean Stock Market Sees Sharp Rebound After Forceful De-leveraging, SK Hynix Rises 30%

marsbit31m ago

Cryptocurrency Company Wintermute Makes Pessimistic Statements Regarding Expected Altcoin Growth! Here are the Details

Crypto market maker Wintermute has made a pessimistic assessment regarding the anticipated altcoin season, suggesting that any upcoming rally may benefit only a limited number of projects. The company reports a record 72% of its spot OTC trading volume in H1 2026 came from institutional clients, whose capital is becoming more selective and concentrated. Data shows institutional traders act quickly on price spikes, while retail interest lasts longer. This selective behavior indicates the classic altcoin season, where hundreds of tokens rise simultaneously, may be changing. Wintermute believes only projects with strong use cases, high liquidity, and institutional appeal will stand out. Supporting this view, CryptoQuant data shows altcoin trading volume against Bitcoin is near its lowest since 2021, with the top 10 altcoins (excluding stablecoins) holding about 80.5% of the total altcoin market cap. Similarly, Kaiko reports that the top 10 altcoins now account for 63% of total altcoin trading volume, up from ~50% a few months ago, indicating capital concentration. Analysts suggest that in the current cautious institutional climate, projects with advanced technology, liquidity, and robust ecosystems will attract disproportionate attention. Therefore, any potential new altcoin season may be less broad than past bull markets, with gains concentrated in a narrower set of promising tokens.

cryptonews.ru31m ago

Cryptocurrency Company Wintermute Makes Pessimistic Statements Regarding Expected Altcoin Growth! Here are the Details

cryptonews.ru31m ago

Trading

Spot

Hot Articles

Discussions

Welcome to the HTX Community. Here, you can stay informed about the latest platform developments and gain access to professional market insights. Users' opinions on the price of S (S) are presented below.

活动图片