BTC Faces Triple Resistance at $80,000 Milestone, HYPE Hits New Highs Signaling Potential | Invited Analysis

Odaily星球日报Published on 2026-05-26Last updated on 2026-05-26

Abstract

This weekly analysis maintains a structured framework, focusing on Bitcoin (BTC) and HYPE, dissecting their multi-timeframe price action to identify key support and resistance zones and formulate actionable trading plans. The previous week's short position on BTC yielded a 2.78% gain, reinforcing the "signal-driven, disciplined" approach. For Bitcoin, the core scenario revolves around the battle between the 78,500–79,500 USD resistance zone and the 73,500–75,000 USD support area. The daily chart shows BTC within a rising channel; a failure to hold support at the channel's midline could lead to a test of the lower boundary. The 4-hour chart details an 8-segment corrective structure from the 82,850 USD high. Two short-term strategies are proposed: (A) Selling on a failed rally into the 78.5k-79.5k zone, with a stop above 80,600, or (B) Selling a confirmed breakdown below the 73.5k-75k support, with a stop above 76,500. Medium-term positioning remains neutral. For HYPE, the 4-hour chart indicates a five-wave advance from the May 14th low, now showing potential exhaustion and a top warning signal near 65 USD. The core view is to watch for a potential short-term peak formation. The recommended strategy is to avoid chasing the rally and instead look for a long setup upon a pullback to the 47.5–50 USD support zone, provided clear stabilization and model confirmation signals appear. The report concludes with a detailed review of the prior BTC short trade, executed based on model s...

Continuing with our structured analytical framework this week, we dissect the current movements of Bitcoin and HYPE from multiple time dimensions, assess the struggle between buyers and sellers around key resistance and support zones, and formulate specific, actionable operational plans accordingly.

Last week's short position successfully yielded a 2.78% profit, once again validating the trading logic of 'signal-driven, strict discipline'. However, a single profitable trade does not necessarily indicate that the market direction is definitively correct – the market always retains the possibility of exceeding expectations.

The core variable for this week remains the battle between the $78,500–$79,500 resistance zone and the $73,500–$75,000 support zone. The outcome will be answered by the market itself.

Summary of Core Trading Views for This Week:

• Analysis of BTC's multi-cycle price structure. (Detailed in Part I)

• BTC price forecast and mid-term, short-term operational strategies for this week. (Detailed in Part II)

• Analysis of HYPE's hourly chart structure. (Detailed in Part III)

• HYPE price forecast and short-term operational strategy for this week. (Detailed in Part IV)

Market Verification of Last Week's Trading Strategies and Core Views:

• BTC Short-term Trading Results: Bitcoin completed one short-term short position (1x leverage) last week, achieving a profit of approximately 2.78%. (Detailed in Table I)

• Market Verification of BTC Price Forecast: In last week's article, we noted: If the price effectively breaks below the support zone of $78,500–$79,500, it will test the support strength near $75,000. The current market movement verifies our previous forecast.

I. Analysis of Bitcoin's Multi-Cycle Price Structure

1. BTC Daily Chart Structure Analysis

Bitcoin _ Daily Chart:
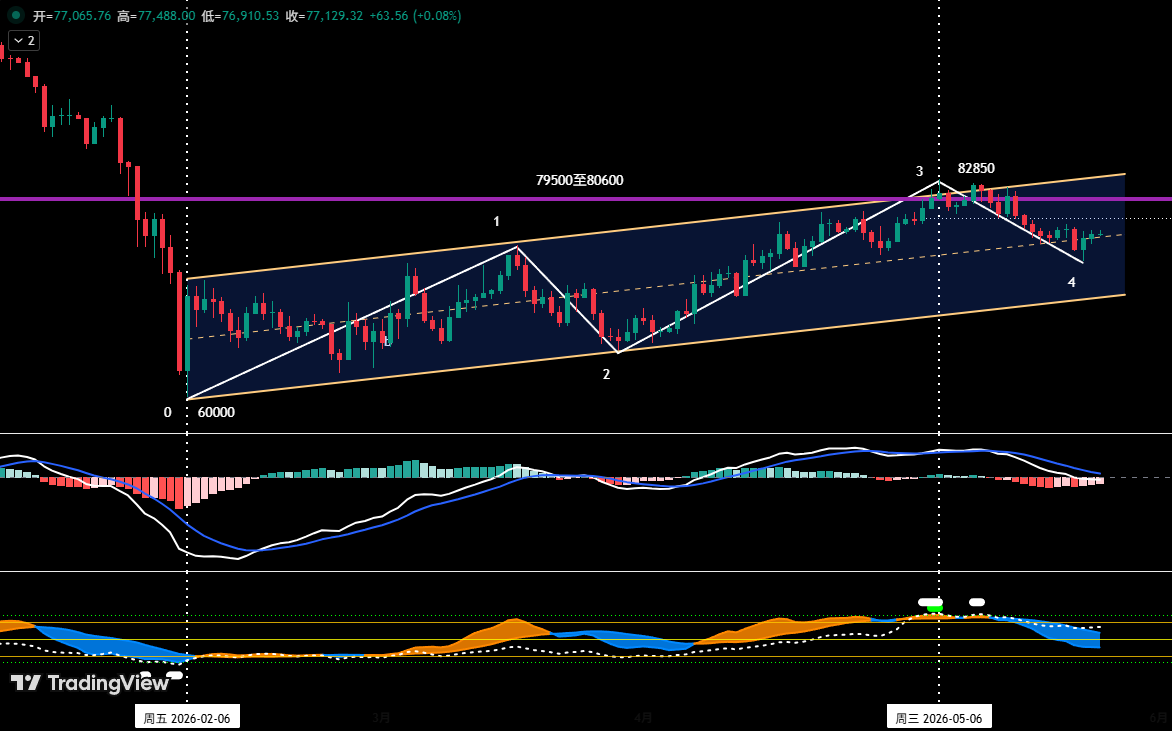
Figure 1

• As shown in (Figure 1), since establishing a stage low near $60,000 on February 6, 2026, Bitcoin's daily chart has constructed and maintained a clearly structured ascending channel: its lower boundary is formed by connecting the lows of February 6 and March 29, while the upper boundary is drawn parallel to the lower boundary through the high of March 17.

• In our April 27th weekly review, we pointed out: "The current price is facing dual pressure from the channel's upper boundary and the $79,500 to $80,600 resistance zone, making a breakthrough likely difficult". Subsequent market action confirmed this assessment. After nearly 20 days of tug-of-war between bulls and bears, although a new rebound high of $82,850 was reached on May 6, it failed to effectively break through this zone's resistance, and the price subsequently began to fluctuate downward.

From the current structure, the price has retraced from near the channel's upper boundary to the mid-channel area. If the price fails to find effective support near the mid-channel and resume its uptrend, the probability of subsequently seeking support at the channel's lower boundary is increasing.

2. In-Depth Analysis of BTC's Hourly Chart Structure

Bitcoin _ 4-Hour Chart
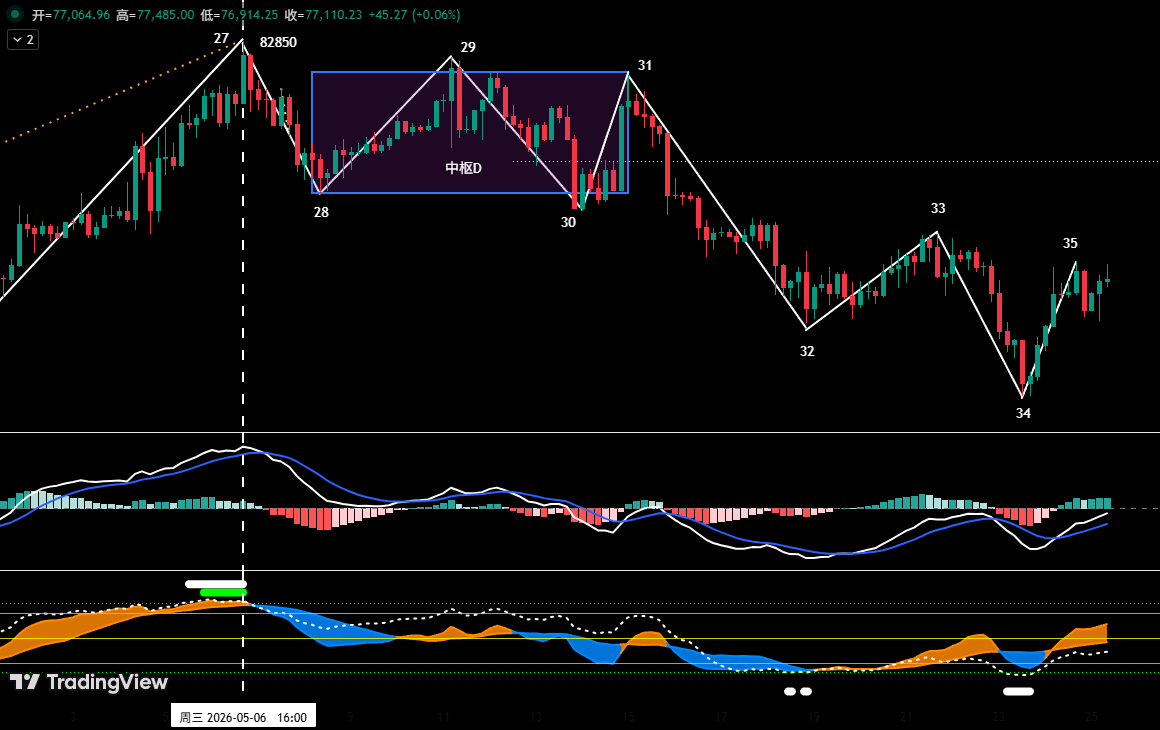
Figure 2

As shown in (Figure 2), from the May 6 high of $82,850 to the ongoing adjustment;

• On the 4-hour chart, it can be subdivided into an 8-segment adjustment structure: from "Segment 27-28" to "Segment 34-35"; Central D: Due to the overlapping of segments 28-29, 29-30, and 30-31, they constitute Central D.

• From the 4-hour chart structure, segment 34-35 is about to rebound to the $78,500–$79,500 zone. If the price faces resistance and falls back after rebounding to this zone, failing to form an effective breakthrough, the market is likely to continue the current fluctuating adjustment pattern and test the core support band of $73,500–$75,000 again.

II. Bitcoin Price Forecast and Operational Strategy for This Week

1. BTC Price Forecast for This Week:

Core View This Week: Focus on the outcome of the battle between bulls and bears for the $78,500–$79,500 resistance zone and the $73,500–$75,000 support zone.

2. Core Resistance Levels:

• First Resistance Zone: $78,500–$79,500 (near the boundaries of two central zones)

• Second Resistance Zone: $83,500–$84,500 (previous dense trading area)

3. Core Support Levels:

• First Support Zone: $73,500–$75,000 (previous key support area)

• Second Support Zone: $69,500–$70,500 (previous key support area)

4. Operational Strategy for This Week (Excluding Impact of Sudden News)

1. Mid-term Strategy:

Bitcoin _ Daily Chart: (Position Monitoring Model)
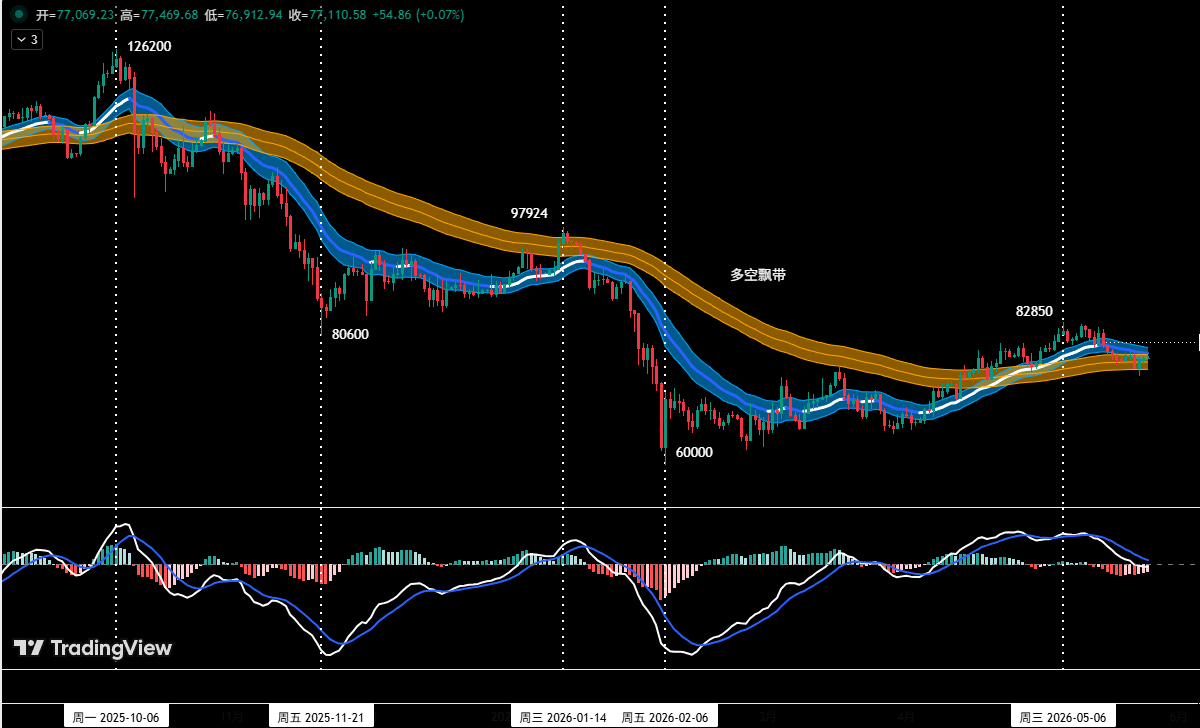
Figure 3

Position Monitoring Model: As shown in (Figure 3), based on trading rules, the market's mid-term direction is not yet clear. This week's mid-term strategy is to maintain a no-position, wait-and-see approach.

2. Short-term Strategy: Utilize 30% of capital, set stop-loss points, and look for "spread" opportunities based on support and resistance levels. (Using 30-minute/60-minute as the operational cycle).

3. In short-term operations, to dynamically respond to complex market developments, we have prepared two specific operational plans in advance: Plan A/B.

Plan A: Rebound Meets Resistance, Sell High.

• Entry: When the price rebounds to the $78,500–$79,500 zone and encounters resistance, combined with a top signal from the quantitative model, a short position below 30% can be established.

• Risk Control: Initial stop-loss set above $80,600.

• Exit: When the price adjusts near important support levels combined with model signals, gradually close the position to take profits.

Plan B: Effectively Breaks Support, Follow the Trend Short.

• Entry: When the price effectively breaks below the $73,500–$75,000 support zone combined with a model top signal, a short position below 30% can be established.

• Risk Control: Initial stop-loss set above $76,500.

• Exit: When the price falls to important support levels combined with model signals, gradually close the position to take profits.

III. HYPE Price Structure Analysis

HYPE_4-Hour Chart
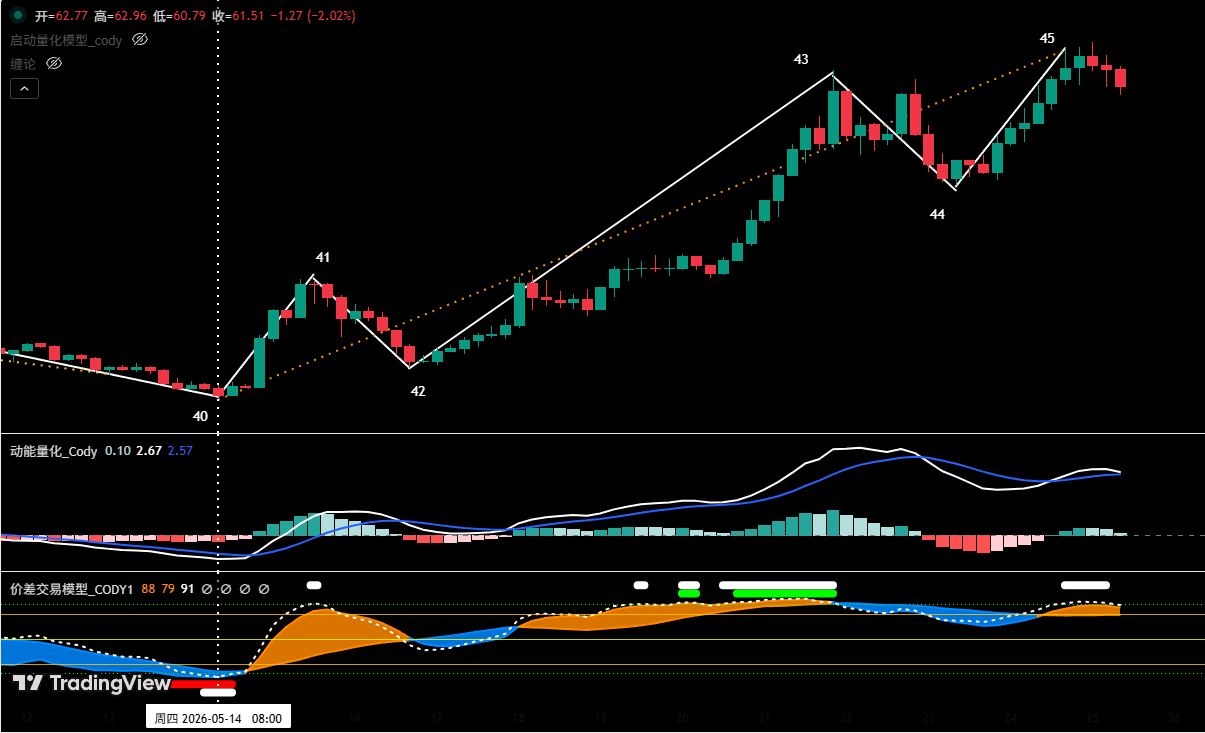
Figure 4

1. As shown in (Figure 4), the uptrend in HYPE starting from the May 14 low of $38.14 can be divided into a five-segment structure on the 4-hour chart: segments 40-41, 41-42, 42-43, 43-44, 44-45.

2. Our proprietary "Spread Trading Model" indicates that near endpoint 45, a top warning signal (white dot) has been triggered.

3. From the "Momentum Quantification Model" perspective, the rising segment (44-45) near $65 has shown signs of weakening upward momentum.

4. If the price forms a momentum bearish divergence state at "endpoint 45" and resonates with the top warning signal from the "Spread Trading Model", the probability of the price forming a short-term high here increases significantly.

IV. HYPE Price Forecast and Short-Term Operational Strategy for This Week

1. HYPE Price Forecast for This Week:

Core View on HYPE This Week:

• Observe whether "endpoint 45" can form a short-term high since the rise began on May 14.

• If a short-term high is formed, subsequently, look for short-term long opportunities when the price retraces to key support areas (e.g., $47.5 to $50) and shows clear signs of stabilization.

2. HYPE Short-Term Operational Strategy for This Week: (Buy on Support)

Currently, the strategy of "avoid blind chasing of highs, buy on dips" should be followed. If the price retraces to the $47.5 to $50 zone, finds support, and shows stabilization signals, combined with bottom signals triggered by both models, consider a light long position. Position size must be controlled below 30%, and strict stop-loss discipline must be maintained.

V. Operational Review

1. Short-Term Operation Review:(See Table I)

We strictly followed the operational plan. Based on trading signals from our proprietary "Spread Trading Model" and "Momentum Quantification Model", we completed one short-term (short) operation last week, achieving a trading profit of 2.78%.

1. Bitcoin Short-Term Trading Details Summary: (Leverage*1x)
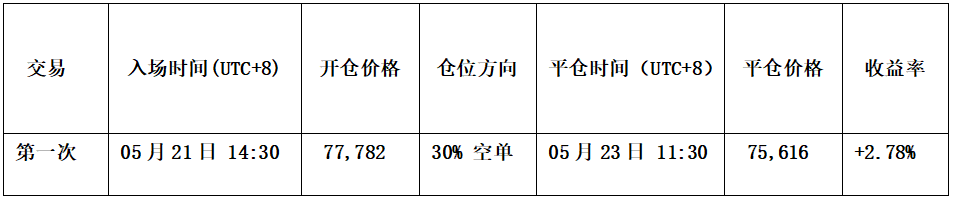
Table I

2. Short-Term Trading Review: (See Figure VI)

• Entry Strategy:

a. When the price rebounded near $78,500, encountered resistance, showed pressure signals, and the candlestick formed a "top reversal" bearish signal;

b. The "Spread Trading Model" triggered a top warning signal (white dot), and the "Momentum Quantification Model" formed a momentum bearish divergence signal.

Therefore, we established a 30% short position at $77,782.

• Exit Strategy:

a. When the price fell near $75,000 and found support, and the candlestick formed a "bottom reversal" signal;

b. The "Spread Trading Model" triggered a strong bottom warning signal (red dot + white dot), resonating with a bottom signal from the "Momentum Quantification Model".

Therefore, we closed all positions near $75,616.

• Summary: This trade successfully yielded a profit of approximately 2.78%.

BTC_30 Minute Chart: (Momentum Quantification Model + Spread Trading Model)
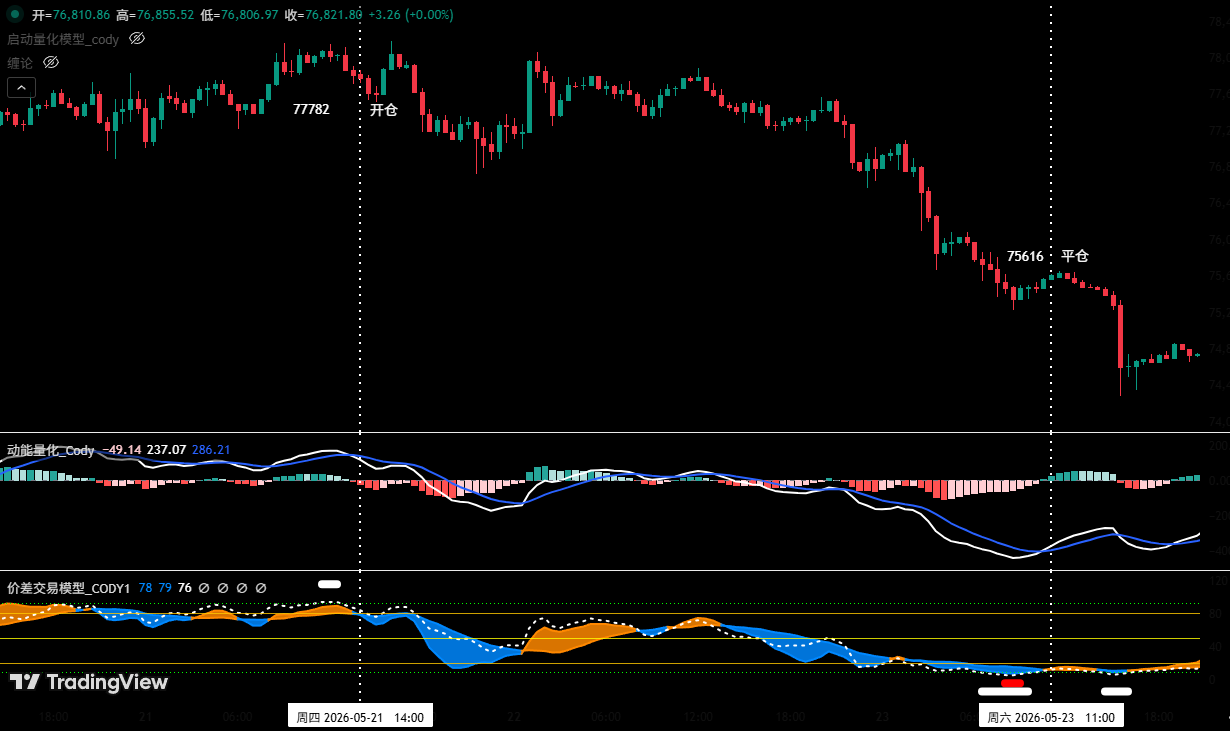
Figure V (Short-Term Trading Illustration)

VI. Special Note:

1. When opening a position: Immediately set the initial stop-loss point.

2. When profit reaches 1%: Move the stop-loss to the entry cost price (break-even point) to ensure capital safety.

3. When profit reaches 2%: Move the stop-loss to the 1% profit level.

4. Continuous Tracking: Thereafter, for every additional 1% profit, move the stop-loss up by 1%, dynamically protecting and locking in profits.

Financial markets are ever-changing; all market analysis and trading strategies require dynamic adjustment. All views, analytical models, and operational strategies mentioned in this article are derived from personal technical analysis, intended solely for personal trading log purposes, and do not constitute any investment advice or operational basis. The market carries risks; investment requires caution. Please do not make decisions based on this.


Related Questions

QAccording to the article's analysis, what are the two main resistance and support zones for Bitcoin this week?

AThe core resistance zone is 78,500-79,500 USD, and the core support zone is 73,500-75,000 USD.

QWhat was the primary technical reason for the author's successful short trade on Bitcoin the previous week?

AThe trade was executed based on a confluence of signals: the price encountered resistance near 78,500 USD forming a top reversal candlestick pattern, and both the author's 'Price Difference Trading Model' and 'Dynamic Energy Quantification Model' triggered top warning signals, including momentum divergence.

QBased on the analysis, what is the key condition for HYPE to present a potential short-term buying opportunity?

AA short-term buying opportunity for HYPE may arise if the price pulls back to the 47.5 to 50 USD support zone, shows clear signs of stabilization, and is confirmed by bottom signals from the author's trading models.

QWhat is the author's current medium-term (midline) strategy for Bitcoin, as indicated by their 'Position Monitoring Model'?

AAccording to the 'Position Monitoring Model', the medium-term market direction is not yet clear. Therefore, the author is maintaining a strategy of staying out of the market (holding no medium-term positions) and observing.

QIn the article's proposed short-term trading plans for Bitcoin, what are the two main scenarios (Plan A and Plan B)?

APlan A: Sell short on rallies if the price rebounds to the 78,500-79,500 USD resistance zone and encounters selling pressure. Plan B: Sell short on breakouts if the price effectively breaks below the 73,500-75,000 USD support zone.

Related Reads

From Power Infrastructure to Token Economy: The 'Seven-Layer Cake' of the AI Industry Chain

From Power Grid to Token Economy: The AI Industry's "Seven-Layer Cake" The AI industry is shifting from a "model-centric" paradigm focused on massive training to a "token-centric" industrial era driven by inference demand. This new phase revolves around the production, distribution, scheduling, and consumption of tokens—the units of computation used by AI agents for every interaction and task. The article proposes a "seven-layer cake" framework for the AI economy: 1. **Power**: The foundational energy source, with competition shifting to securing stable, low-cost electricity. 2. **AIDC (AI Data Centers)**: Large-scale "Token factories." A trend toward smaller, modular, and regionally deployed AI Factories is emerging for efficiency and proximity to users. 3. **GPU**: The core production hardware for tokens. While NVIDIA dominates, competition exists from AMD, ASIC makers, and Chinese chipmakers, with a growing focus on inference efficiency. 4. **LLMs**: The "engines" that generate tokens. The competition is evolving beyond model size to prioritize factors like token cost, inference efficiency, and operational synergy with infrastructure. 5. **Token Distribution**: The "grid" that allocates and rents out compute resources, led by cloud giants and specialized AI-native platforms. 6. **Token Optimization & Intelligent Scheduling**: The critical "brain" layer that intelligently routes tasks (e.g., to local, cloud, or edge models) for optimal cost, latency, and privacy—maximizing the value of each token. 7. **AI Agents & Models**: The end consumers of tokens. The vision involves billions of AI agents working and interacting concurrently, consuming vast amounts of tokens. Currently, the industry faces fragmentation and inefficiencies between these layers. The true "mass adoption era" of AI will begin only when this seven-layer infrastructure is fully integrated and operates as a cohesive, intelligent network—transforming AI from a software tool into a global industrial system spanning energy, hardware, and compute logistics.

marsbit10m ago

From Power Infrastructure to Token Economy: The 'Seven-Layer Cake' of the AI Industry Chain

marsbit10m ago

BTC Thrice Rejected at $80,000 Threshold, HYPE Reaches New Highs Signaling Opportunity | Guest Analysis

**Bitcoin (BTC) Struggles at $80k; HYPE Reaches New Highs | Key Analysis & Strategy** Bitcoin faces continued resistance in the $78.5k - $79.5k zone after failing to sustain a break above its daily chart rising channel. It has retreated to the channel's midline. A failure to hold here could see a test of the $73.5k - $75k support area. The 4-hour chart shows a complex corrective structure. The strategy is neutral for mid-term positions. For short-term trading, two scenarios are outlined: **A)** Selling on a failed rally into the $78.5k-$79.5k resistance, and **B)** Selling on a confirmed breakdown below the $73.5k-$75k support, both with tight risk management. Meanwhile, **HYPE** has posted consecutive highs. The 4-hour chart indicates its current uptrend may be weakening near $65, with models showing potential bearish divergence. The view is that a short-term top could be forming. The strategy advises against chasing the rally and instead looking for a potential long entry on a pullback to the $47.5 - $50 support zone, provided clear reversal signals appear. Last week, a disciplined short BTC trade based on model signals yielded a 2.78% profit. The article emphasizes that all analysis is for informational purposes only and not investment advice, highlighting the importance of strict stop-loss discipline and dynamic position management in a volatile market. *(Note: The text references proprietary models like the "Price Difference Trading Model" and "Momentum Quantification Model" for generating trade signals.)*

marsbit1h ago

BTC Thrice Rejected at $80,000 Threshold, HYPE Reaches New Highs Signaling Opportunity | Guest Analysis

marsbit1h ago

Tether's New Business: Helping Small Countries Issue Stablecoins

Tether has announced a partnership with the Georgian government to issue GEL₮, a Lari-pegged stablecoin, aiming to reduce costs, accelerate settlements, and promote cross-border payments. This move is part of Tether's broader strategy to establish a replicable, standardized business of issuing sovereign currency-backed stablecoins for smaller nations, alongside its flagship USDT and other regional offerings like MXNT (Mexican Peso) and CNHT (Offshore Yuan). Georgia represents an ideal test case due to its high reliance on remittances (~15% of GDP), established digital asset regulatory framework aligned with U.S. standards, and prior engagement with Tether. The country gains accelerated internationalization of its currency by accessing Tether's global distribution network and liquidity pools, where GEL₮ can be swapped directly with assets like USDT. For Tether, the immediate financial gain from Georgia's small market is minimal. The true value lies in creating a template. Successfully navigating the compliance, reserve, and redemption processes for GEL₮ allows Tether to replicate this model swiftly for other nations with similar profiles, such as Azerbaijan or Nigeria. The deeper strategy involves subtly integrating these national currencies into an informal USDT-anchored dollar system, positioning Tether as the essential routing infrastructure. This partnership highlights a potential new model: the outsourcing of sovereign currency globalization to private stablecoin issuers. It offers smaller states a faster path to digital currency integration than developing a Central Bank Digital Currency (CBDC). However, it raises significant questions about monetary sovereignty, financial stability risks, and increased dependency on a private entity. If more countries adopt this model in the coming year, Tether could evolve from a stablecoin issuer into a unique, cross-sovereign financial infrastructure service provider.

marsbit1h ago

Tether's New Business: Helping Small Countries Issue Stablecoins

marsbit1h ago

Trading

Spot
Futures

Hot Articles

How to Buy HYPE

Welcome to HTX.com! We've made purchasing Hyperliquid (HYPE) simple and convenient. Follow our step-by-step guide to embark on your crypto journey.Step 1: Create Your HTX AccountUse your email or phone number to sign up for a free account on HTX. Experience a hassle-free registration journey and unlock all features.Get My AccountStep 2: Go to Buy Crypto and Choose Your Payment MethodCredit/Debit Card: Use your Visa or Mastercard to buy Hyperliquid (HYPE) instantly.Balance: Use funds from your HTX account balance to trade seamlessly.Third Parties: We've added popular payment methods such as Google Pay and Apple Pay to enhance convenience.P2P: Trade directly with other users on HTX.Over-the-Counter (OTC): We offer tailor-made services and competitive exchange rates for traders.Step 3: Store Your Hyperliquid (HYPE)After purchasing your Hyperliquid (HYPE), store it in your HTX account. Alternatively, you can send it elsewhere via blockchain transfer or use it to trade other cryptocurrencies.Step 4: Trade Hyperliquid (HYPE)Easily trade Hyperliquid (HYPE) on HTX's spot market. Simply access your account, select your trading pair, execute your trades, and monitor in real-time. We offer a user-friendly experience for both beginners and seasoned traders.

3.1k Total ViewsPublished 2024.03.29Updated 2026.02.20

How to Buy HYPE

Discussions

Welcome to the HTX Community. Here, you can stay informed about the latest platform developments and gain access to professional market insights. Users' opinions on the price of HYPE (HYPE) are presented below.

活动图片