Bitcoin is struggling to hold the $65,000 level as market sentiment drifts toward apathy following weeks of muted price action and declining participation. Volatility has compressed noticeably, and traders appear hesitant to commit fresh capital while macro uncertainty and liquidity constraints continue to weigh on risk assets. The lack of decisive momentum has left Bitcoin consolidating near a technically sensitive zone, where both bulls and bears seem reluctant to take aggressive positions.
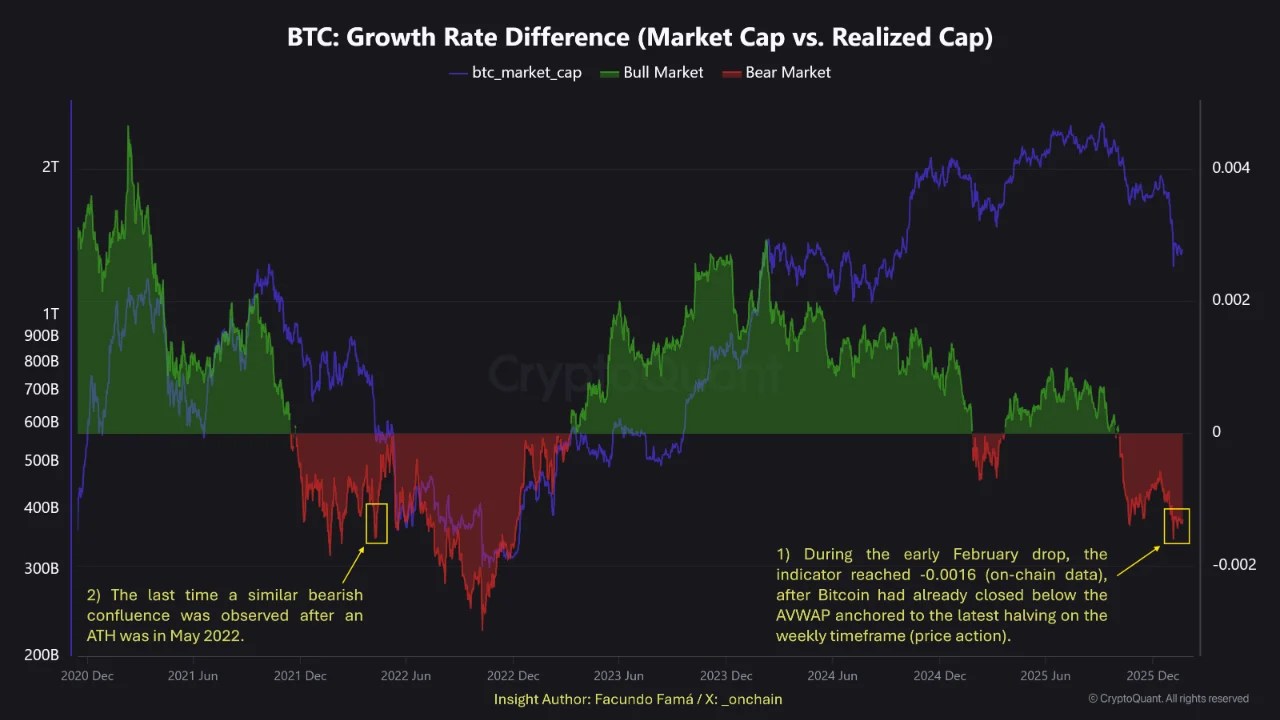
A recent CryptoQuant report provides additional context through on-chain positioning data. According to the analysis, during the early February correction, the indicator dropped to roughly -0.0016, reflecting measurable weakness in underlying network activity. This development occurred after Bitcoin had already closed below the Anchored Volume Weighted Average Price (AVWAP) tied to the most recent halving on the weekly timeframe — a level often monitored as a structural reference for market positioning.
Trading below this anchored metric suggests reduced conviction among market participants and potentially weaker cost-basis support. While such conditions do not necessarily imply imminent downside, they typically correspond with transitional phases marked by uncertainty, subdued participation, and cautious capital deployment as the market searches for directional clarity.
Bearish Confluence Signals Echo Prior Cycle Dynamics
The report highlights that the last comparable bearish confluence following an all-time high occurred in May 2022, a period that ultimately preceded a prolonged corrective phase. According to the analysis, this comparison is based on a combination of structural indicators rather than isolated price action, specifically the BTC Growth Rate Difference between Market Cap and Realized Cap — an indicator developed by CryptoQuant CEO Ki Young Ju — alongside Anchored VWAP levels tied to the third and fourth Bitcoin halvings.
The Growth Rate Difference metric evaluates whether market capitalization expansion is outpacing the underlying realized capitalization, which reflects the aggregated cost basis of coins on-chain. When this gap narrows or turns negative, it often signals weakening speculative momentum and reduced capital inflows relative to existing holder positioning.
At the same time, Bitcoin trading below key halving-anchored AVWAP levels suggests diminished structural support from long-term cost bases. Historically, these levels have functioned as reference zones for institutional and macro-oriented investors.
Together, these indicators do not guarantee further downside, but they do indicate a fragile market structure. Such conditions typically require either renewed liquidity inflows or sustained accumulation before a convincing recovery phase can develop.