Since the sharp pullback in the price of Bitcoin from its all-time high of $126,000, speculations about a bear market phase have significantly stirred up in the community. After weeks of steady downside price action, several key on-chain indicators are beginning to show that BTC has flipped into a bear market phase.
Network Activity Slows Down Amid Waning Bitcoin Price Action
With Bitcoin’s price persistently demonstrating bearish performance, on-chain activity appears to have undergone a crucial shift. What appeared to be a typical decline is now exposing more profound shifts in on-chain activity, long-term holdings, and traders’ behavior.
Presently, Bitcoin’s network activity is entering a noticeably calmer phase, which provides a clear picture of the market’s current status. In the quick-take post, GugaOnChain revealed the BTC Bull-Bear Cycle indicator and the MA_30D below the MA_365D (-0.52%), both of which confirm that the BTC market remains in a bear market.
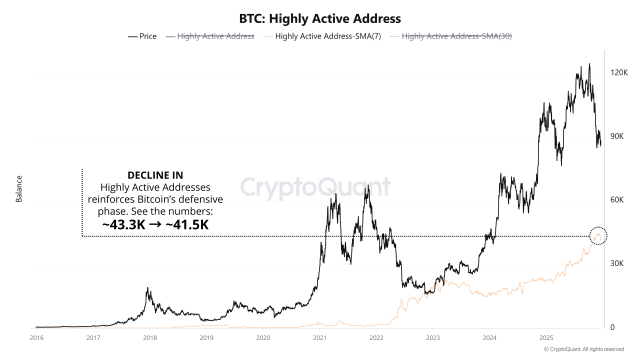
However, the platform’s analysis of the current market state is mainly centered on the Bitcoin Highly Active Address metric. This key metric points to a slowdown in the BTC Network. A look at the chart reveals a steady drop in the highly active BTC addresses, reinforcing lower speculative activity and suggesting that higher volatility lies ahead.
Following the sharp pullback, highly active BTC addresses have declined from 43,300 to 41,500, indicating that large players are exiting the market, consistent with a defensive phase. Historically, whenever highly active addresses shrike, it signals a retreat by traders and institutions, which supports the transition into quiet accumulation phases that lead to future volatility.
Furthermore, the data shows that the total number of transactions on the network has fallen from 460,000 to 438,000 over the past few days. GugaOnChain highlighted that when there is a lower transaction count, there is a reduction in speculative use.
It is worth noting that dropping transaction counts were an obvious symptom of waning speculative interest in previous down cycles, and the Bitcoin network operated at reduced volumes until fresh catalysts emerged.
Another aspect that has experienced a decline is the network fees. Data shows that the fees fell from 233,000 to 230,000, suggesting a less congested network. During previous bear markets, lower fees often coincided with periods of weaker demand, showing that users were not vying for block space and fostering a low-pressure environment.
How Does The Current Trend Go Against The 2018 Market Cycle
According to the platform, the current data from the metric is similar to that observed in the 2018 bear market. During the period, there were also fewer active addresses, fading transactions, lower fees, and the retreat of major players, as seen in the current state of the market.
However, the Bitcoin user base today is larger, with over 800,000 compared to the 600,000 in 2018; a sign of structural resilience. Meanwhile, low activity frequently precedes increased volatility, just as it did in the past.
GugaOnChain stated that the indicators confirm a defensive scenario, and future comparisons with 2018 indicate that periods of low activity typically precede more volatility. Nonetheless, the larger user base of today indicates increased ecological resilience.