Bitcoin whales vs. retail panic: 3 factors define BTC’s next breakout

AmbcryptoPublished on 2026-01-25Last updated on 2026-06-05

Abstract

BTC selling pressure lingers, but the balance beneath the surface is shifting.

Bitcoin’s on-chain data highlighted a sharp behavioral split. As volatility rose, retail panic selling accelerated amid deeper drawdown fears.

Consequently, short-term holders sold below cost, locking in losses and reflecting bearish sentiment. During this phase, Short-Term Holder (STH) supply in loss expanded, confirming capitulation.

By contrast, whales accumulated steadily for several weeks. Wallets holding at least 1,000 BTC increased collective holdings by 104,340 BTC, a 1.5% rise.

That pushed total whale-held supply to 7.17 million BTC, marking a four-month high.

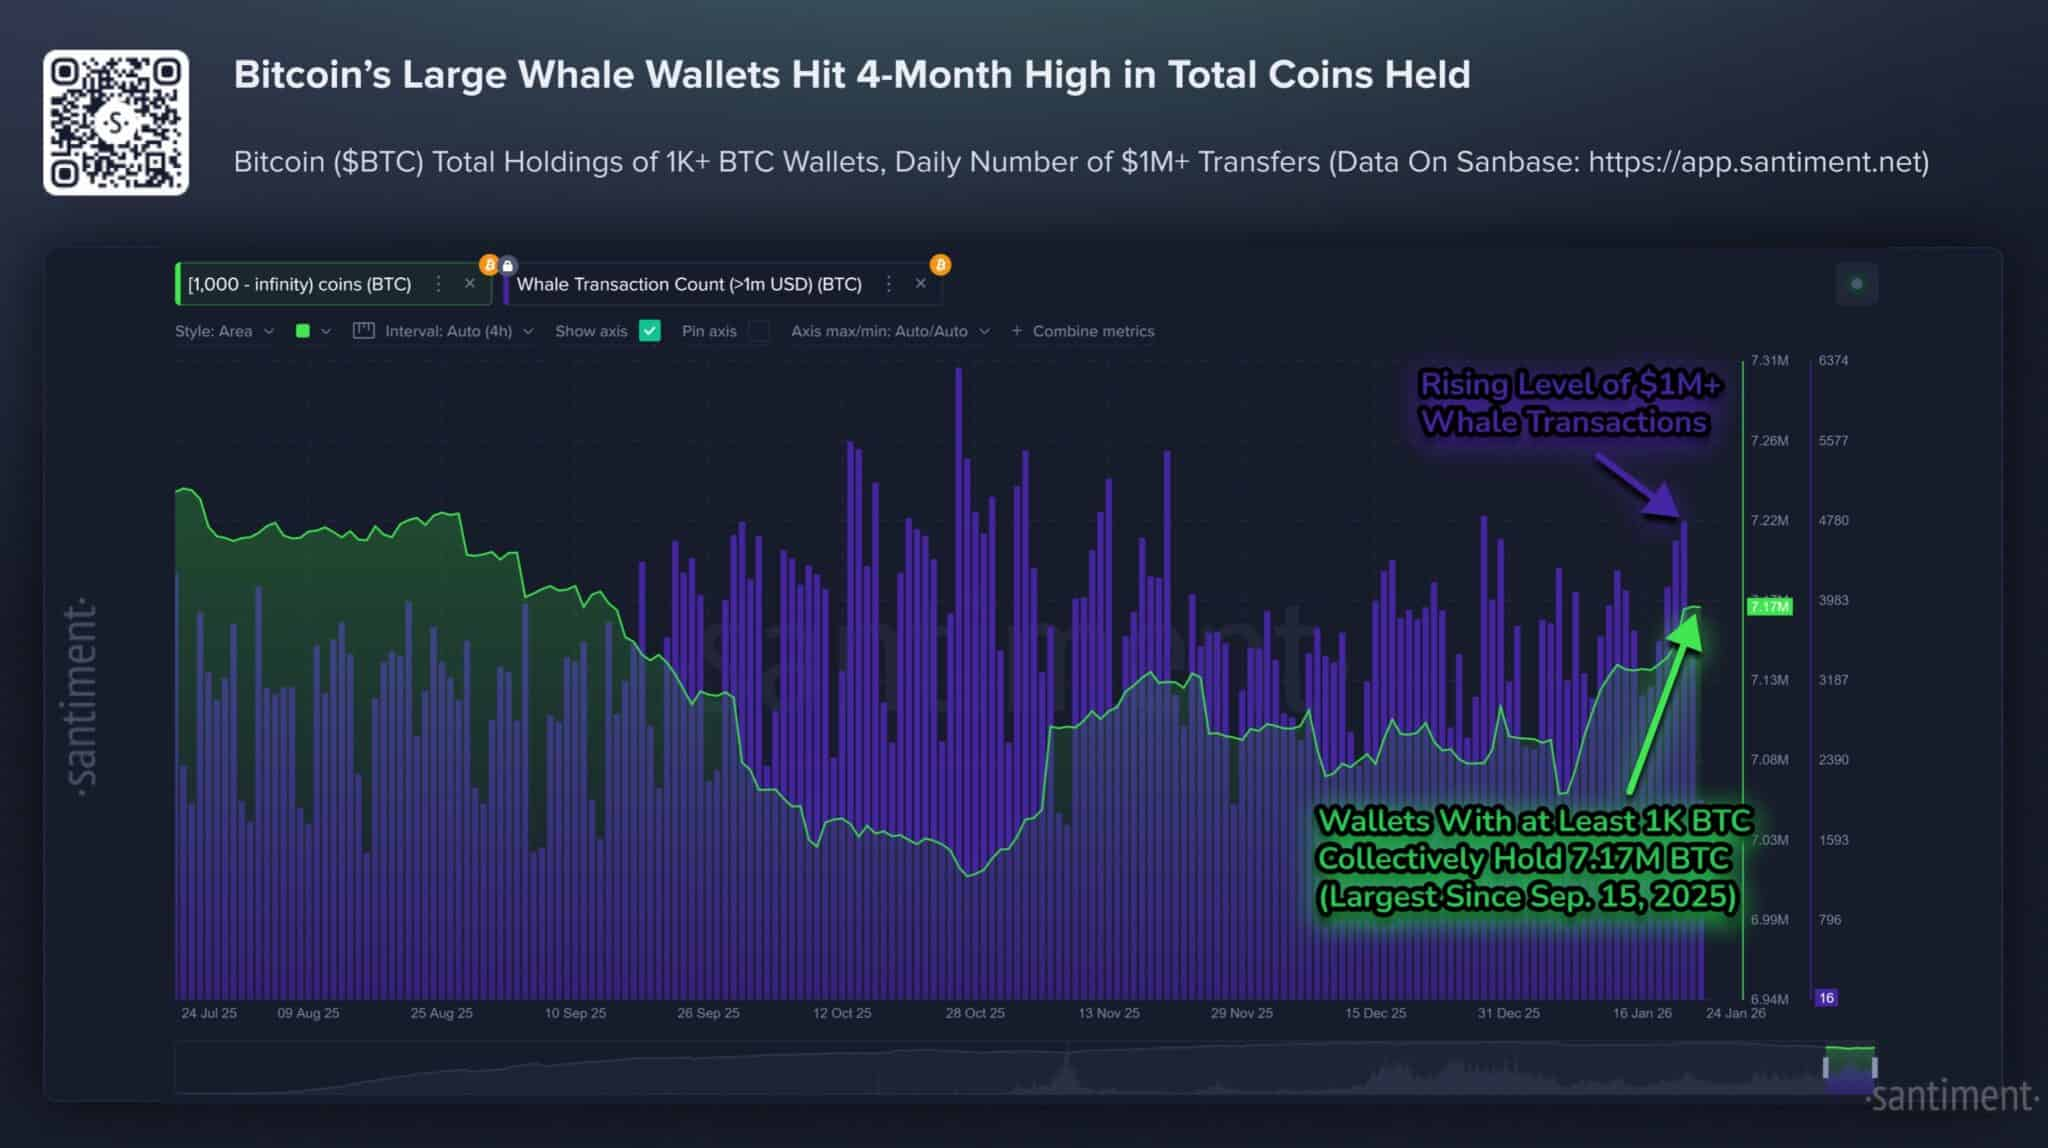
Meanwhile, over $1 million in daily transfers hit a two-month high, signaling active accumulation. This dynamic implies smart-money absorption as retail exits exhaust.

STHs capitulate as realized losses remain elevated

Bitcoin’s [BTC] Net Realized Profit and Loss analysis showed that the $4.5 billion realized loss did not occur in a single print but accumulated through repeated downside spikes.

This indicated prolonged stress rather than a single capitulation event.

As BTC price stalled near highs, distribution intensified. Consequently, losses expanded as short-term holders sold into drawdowns, driven by macro uncertainty, ETF outflows, and fading momentum.

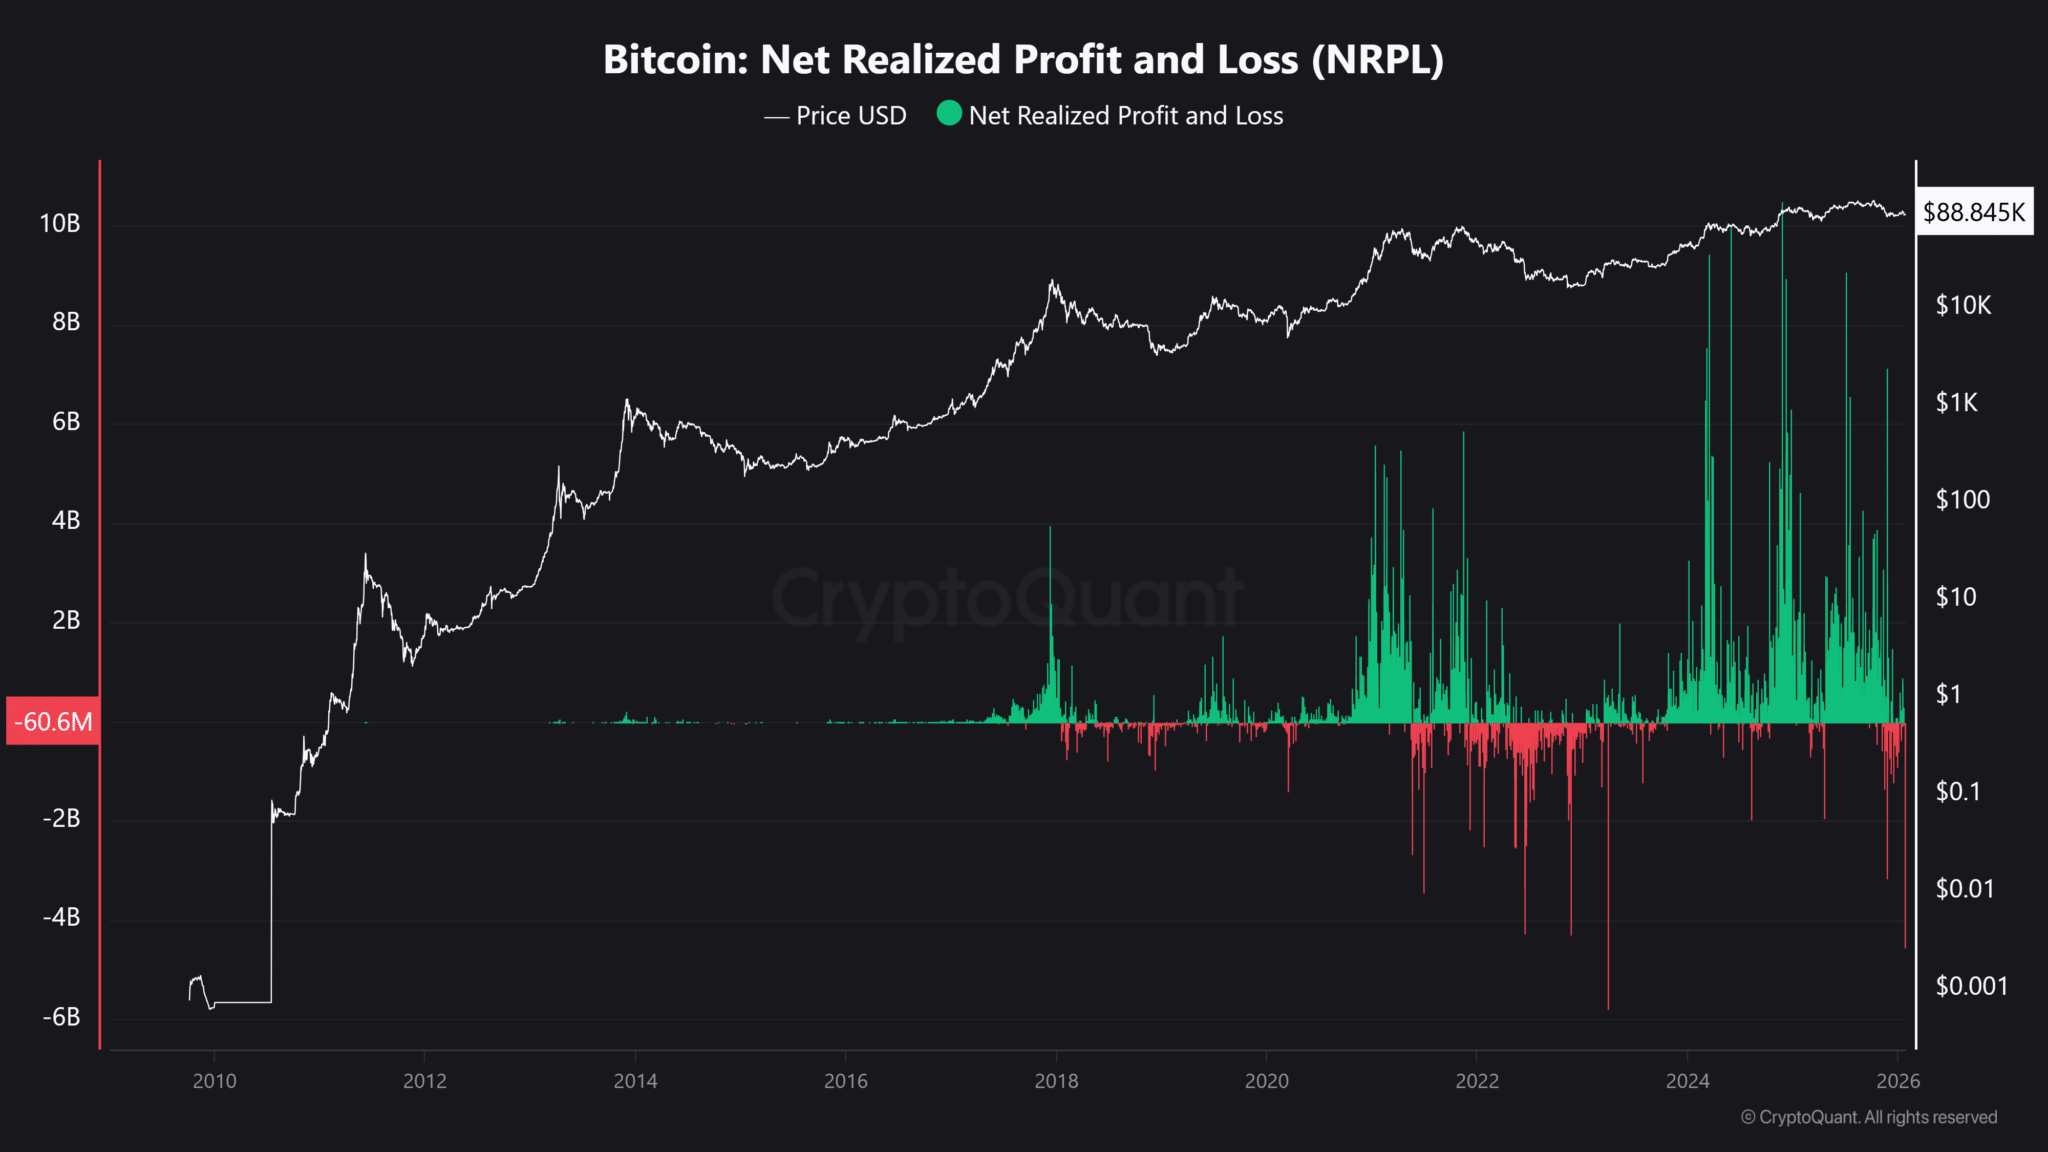
Historically, similar NRPL flushes appeared in 2018, 2020, and late 2022. Notably, the last comparable event saw Bitcoin near $28,000, followed by a long basing phase.

These losses correlate with capitulation. Recovery typically emerges once selling exhausts and accumulation absorbs supply.

Building on the spike in dollar-denominated NRPL, the 30-day realized net profit/loss in BTC terms adds clarity to who is selling and how.

The analysis showed the metric slipping below zero near late 2025, marking the first sustained negative print since September 2023.

Importantly, this selling is gradual, not abrupt, indicating pressure rather than panic.

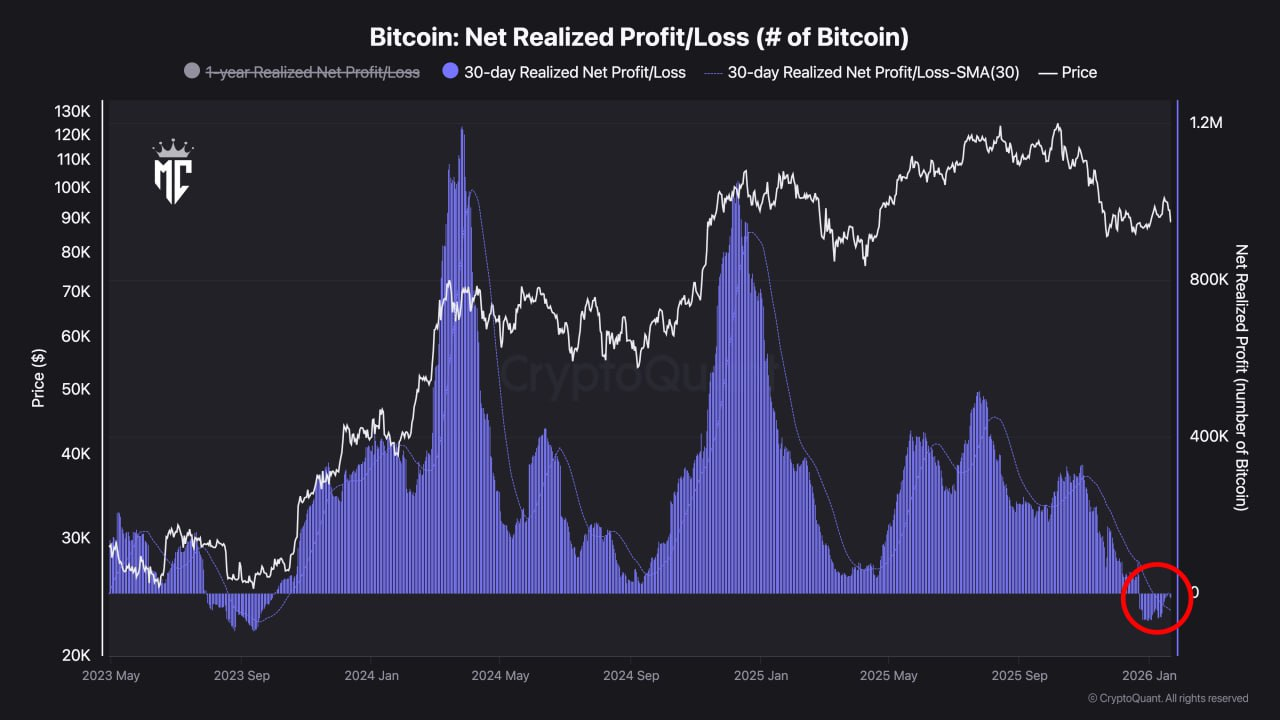
These losses largely come from short-term holders, as recent buyers sell below cost after failed breakouts above $90,000.

Macro uncertainty, ETF flow volatility, and leverage unwinds reinforce this behavior. As a result, supply caps upside and stalls price.

From a positioning perspective, bulls will have to monitor signs of loss and exhaustion, while bears remain focused on the persistence of distribution.

Range holds as losses shape structure

Short-term holder loss realization continued to shape Bitcoin’s structure, keeping the price confined within a wide consolidation range.

Selling below cost added supply during rebounds, which limits breakouts above the $95,000-$100,000 resistance zone.

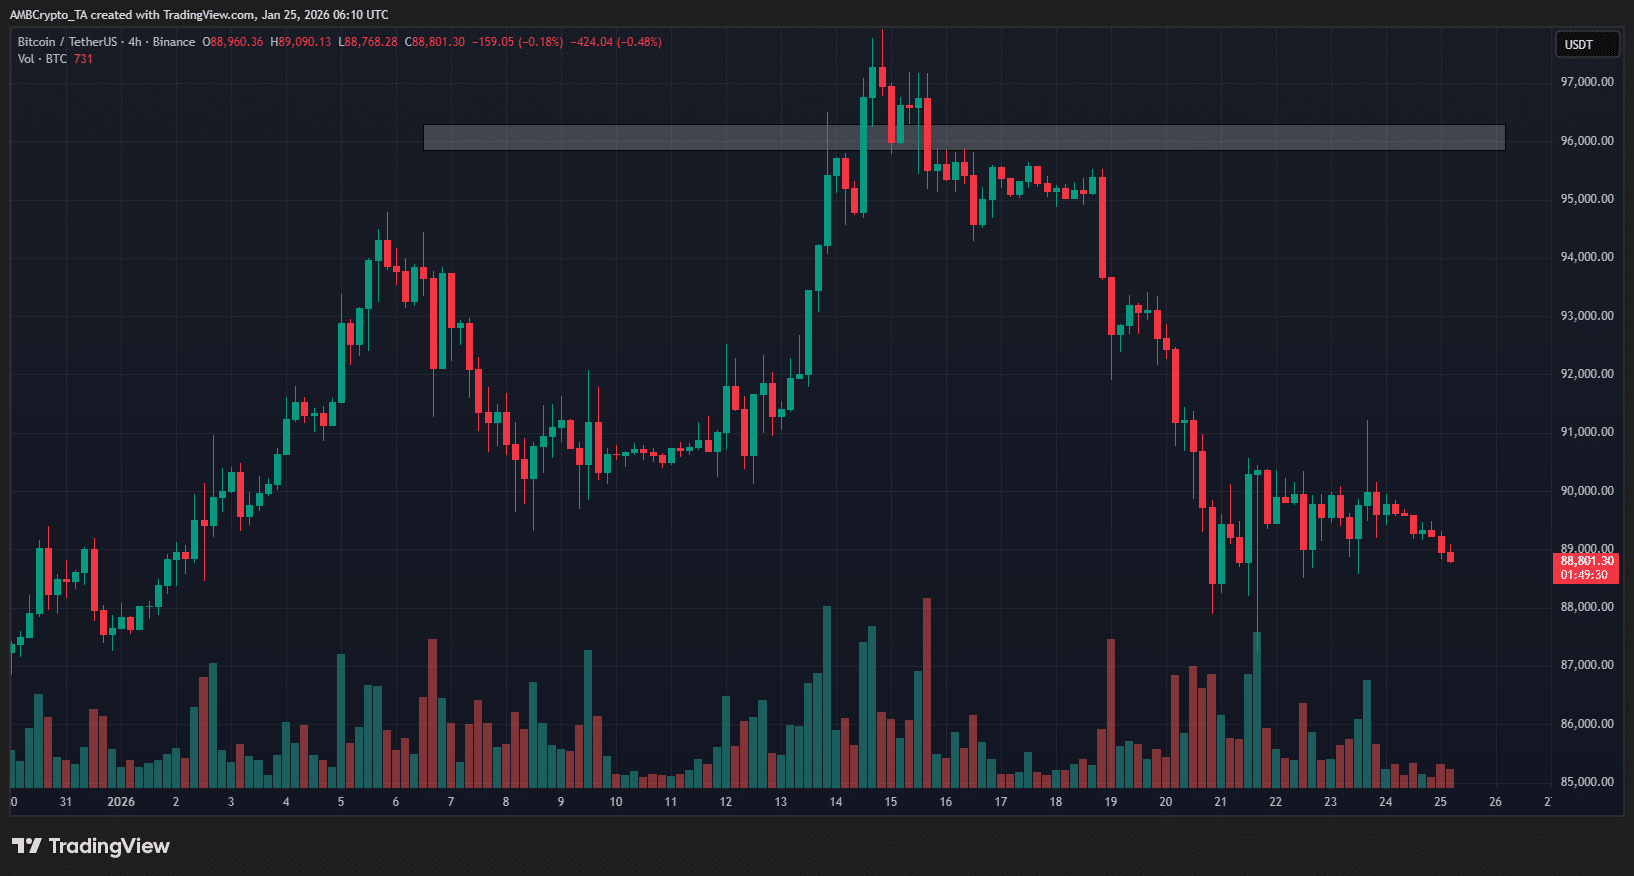
At the same time, selling pressure has eased near $85,000–88,000, where buyers have shown willingness to absorb supply.

This balance favored sideways price action rather than a sustained trend. A breakout would likely require realized losses to decline alongside stronger Spot demand.

On the downside, renewed increases in loss realization could weaken support and trigger another retest of lower levels.

Final Thoughts

  • Bitcoin’s drawdown reflected short-term holder capitulation, with realized losses transferring supply toward whales that continued accumulating despite price stagnation.
  • Persistent selling kept Bitcoin range-bound between $85,000–$88,000 support and $95,000–$100,000 resistance, leaving direction dependent on loss exhaustion and renewed Spot demand.

Related Questions

QWhat behavioral split in Bitcoin's on-chain data is highlighted in the article?

AThe article highlights a sharp behavioral split between retail investors, who engaged in panic selling due to fears of deeper drawdowns, and whales, who accumulated Bitcoin steadily over several weeks.

QHow much did wallets holding at least 1,000 BTC increase their collective holdings, and what was the percentage rise?

AWallets holding at least 1,000 BTC increased their collective holdings by 104,340 BTC, which represents a 1.5% rise.

QWhat did Bitcoin's Net Realized Profit and Loss analysis reveal about the nature of the $4.5 billion in realized losses?

AThe analysis revealed that the $4.5 billion in realized losses did not occur in a single event but accumulated through repeated downside spikes, indicating prolonged stress rather than a single capitulation event.

QAccording to the article, what is the current price range confining Bitcoin's movement, and what are its key levels?

ABitcoin is currently confined within a wide consolidation range, with support at $85,000–$88,000 and resistance at $95,000–$100,000.

QWhat factors does the article suggest are necessary for a Bitcoin breakout from its current range?

AThe article suggests that a breakout would likely require realized losses to decline alongside stronger Spot demand.

Related Reads

Bitcoin's 'Rally Ends,' Officially Entering the Later Stage of a Bear Market?

Bitcoin prices declined 13% this week, reversing the recent rebound and signaling a likely transition into the later stages of a bear market. Key on-chain metrics deteriorated, with the short-term holder cost basis falling below the Realized Price—a pattern last seen in early 2022, characteristic of bear market maturity. The rally to ~$82k proved to be a bear market bounce, as evidenced by the 90-day realized profit/loss ratio failing to sustain above the bullish threshold of 2. Daily realized losses surged to $1.35B, including significant selling from long-term holders who accumulated near cycle tops, indicating ongoing supply redistribution. Price was rejected almost precisely at the aggregate US spot ETF cost basis of ~$83k, turning that level into resistance and leaving the average ETF investor underwater again. Spot market selling pressure intensified, with the 7-day volume delta turning significantly negative to its weakest level since February. While a major long liquidation event cleared over $400M in leverage, spot demand has not yet stepped in to absorb the resulting supply. Options markets continue pricing in higher future volatility (elevated volatility risk premium) and maintain a skew toward put options, reflecting persistent demand for downside protection, though not yet panic. Overall, market structure remains fragile. Sustained recovery likely requires a reclaim of the ETF cost basis, a shift back to positive spot demand, and a slowdown in realized loss-taking. Until then, the market risks further downside or extended consolidation within the broader bear trend.

Foresight News33m ago

Bitcoin's 'Rally Ends,' Officially Entering the Later Stage of a Bear Market?

Foresight News33m ago

How Risky is the "Death Spiral" of MSTR and STRC?

Summary: This article explores the perceived "death spiral" risk between MicroStrategy (MSTR), its Bitcoin holdings, and its perpetual preferred stock (STRC), drawing comparisons to the LUNA-UST collapse. While both systems feature price anchors, high yields for holders, and potential feedback loops, their core mechanisms differ fundamentally. The MSTR-STRC structure relies on continuous financing to sustain its high dividend payouts, primarily through stock ATM offerings. A negative feedback cycle could occur: falling MSTR stock price makes raising equity capital harder, increasing pressure to sell Bitcoin, which undermines STRC confidence and further depresses MSTR. However, unlike LUNA-UST's automated, direct linkage, the MSTR-STRC loop is weaker and has brakes: STRC dividends can be deferred or rates lowered, and STRC holders have a $100/share liquidation preference in bankruptcy, providing a price floor. The company's sustainability hinges on its ability to continue financing. Its current ~$900 million USD reserves cover only about 6.3 months of its ~$1.71 billion annual interest/dividend burden. The next six months are critical, aligning with both the potential bottom in Bitcoin's four-year cycle and the depletion timeline of its reserves. While a LUNA-style catastrophic collapse is deemed highly unlikely due to structural differences, the key question is whether MicroStrategy can navigate this period through healthy deleveraging to restart its capital engine.

Foresight News51m ago

How Risky is the "Death Spiral" of MSTR and STRC?

Foresight News51m ago

How Much Debt Does Strategy Really Have? Is There a Risk of Implosion?

MicroStrategy's Debt Risk: A Turning Point in the "Never Sell" Strategy As of June 3, 2026, MicroStrategy holds 843,706 bitcoins (valued at ~$53.1B) but faces significant financial obligations. Its capital structure includes $6.75B in convertible notes and $15.48B in perpetual preferred stock (led by the $8.5B STRC series), creating an annual payout burden of ~$1.71B. With software revenue at only ~$500M, interest and dividend obligations far exceed operating income. A critical shift occurred in late May 2026 when the company sold 32 bitcoins for ~$2.5M to cover dividends, breaking CEO Michael Saylor's long-standing "never sell" pledge. This symbolic move triggered a sharp decline in both Bitcoin's price and MSTR stock, reflecting market fears about cash flow sustainability. The core of the strain is the STRC perpetual preferred stock, designed as a "permanent loan" with no maturity date but requiring high monthly dividends (currently 11.5%). Its business model relies on a three-part cycle: issuing new STRC shares, using proceeds to buy more Bitcoin and fund a USD reserve, and using that reserve to pay dividends. This cycle depends on continuous investor demand for STRC and Bitcoin's price appreciation. Analysis shows Bitcoin needs to appreciate at least 2.3% annually to cover the $1.71B in yearly obligations at current holdings. With Bitcoin price down ~22% from March 2026 highs, this pressure has intensified. The company's $900M USD reserve can only cover about 7 months of payments if STRC issuance stalls. Key risks are not immediate bankruptcy or forced Bitcoin liquidation (as BTC is not collateral), but rather: 1) The erosion of MSTR's premium to its Bitcoin holdings (mNAV), which would cripple its ability to raise cheap capital; 2) A vicious cycle where stagnant Bitcoin prices reduce STRC demand, draining the USD reserve and forcing BTC sales, further depressing prices. The period from February 2027 to September 2028 is a crucial test, with over $5.9B in convertible notes facing put options or maturity. In essence, MicroStrategy has evolved from a simple Bitcoin holder into a complex financial entity acting like a "private Bitcoin bank," leveraging its BTC holdings to create layered financial products. Its survival depends on maintaining Bitcoin's price trend, its stock premium, and market appetite for its preferred shares. The recent token sale marks not a betrayal of its Bitcoin thesis, but an admission that the leveraged strategy must eventually be paid for.

marsbit1h ago

How Much Debt Does Strategy Really Have? Is There a Risk of Implosion?

marsbit1h ago

Trading

Spot
Futures

Hot Articles

Discussions

Welcome to the HTX Community. Here, you can stay informed about the latest platform developments and gain access to professional market insights. Users' opinions on the price of S (S) are presented below.

活动图片