Bitcoin stuck at a key level: Investors pause to gauge BTC’s next move

ambcryptoPublished on 2026-04-03Last updated on 2026-04-03

Abstract

Bitcoin remains at a critical juncture as investors assess its next potential move. The market faces headwinds from rising oil prices and inflation fears, driving institutional demand for bearish put options. Short-term holders are limiting upside by securing profits or exiting at breakeven levels. On the 3-day chart, Bitcoin’s February bounce from $60k remains incomplete, failing to breach the key 50% retracement resistance at $78.9k. A move into this “premium” zone could trigger another bearish swing. However, the inability to break below recent swing lows at $65.9k and $62.9k suggests underlying bullish strength on lower timeframes. A close below $65,618 on the 4-hour chart would signal bearish momentum, while a break under $60k on the 3-day chart would confirm a continuation of the long-term downtrend. Until then, a bounce toward $78.9k remains plausible, with the market awaiting a catalyst for the next decisive move.

The West Asia crisis resulted in surging oil prices and fears of growing inflation. This meant that institutional traders were hedging against further downside, evident in the increased demand for puts (bearish bets).

Further downside was possible. Short-term holders were intent on protecting their profits or trying to exit the market at a breakeven, capping the potential of any rally.

Yet, the higher timeframe price action was at an interesting place where a price bounce could not be ruled out completely.

Explaining Bitcoin’s trend expectations

Source: BTC/USDT on TradingView

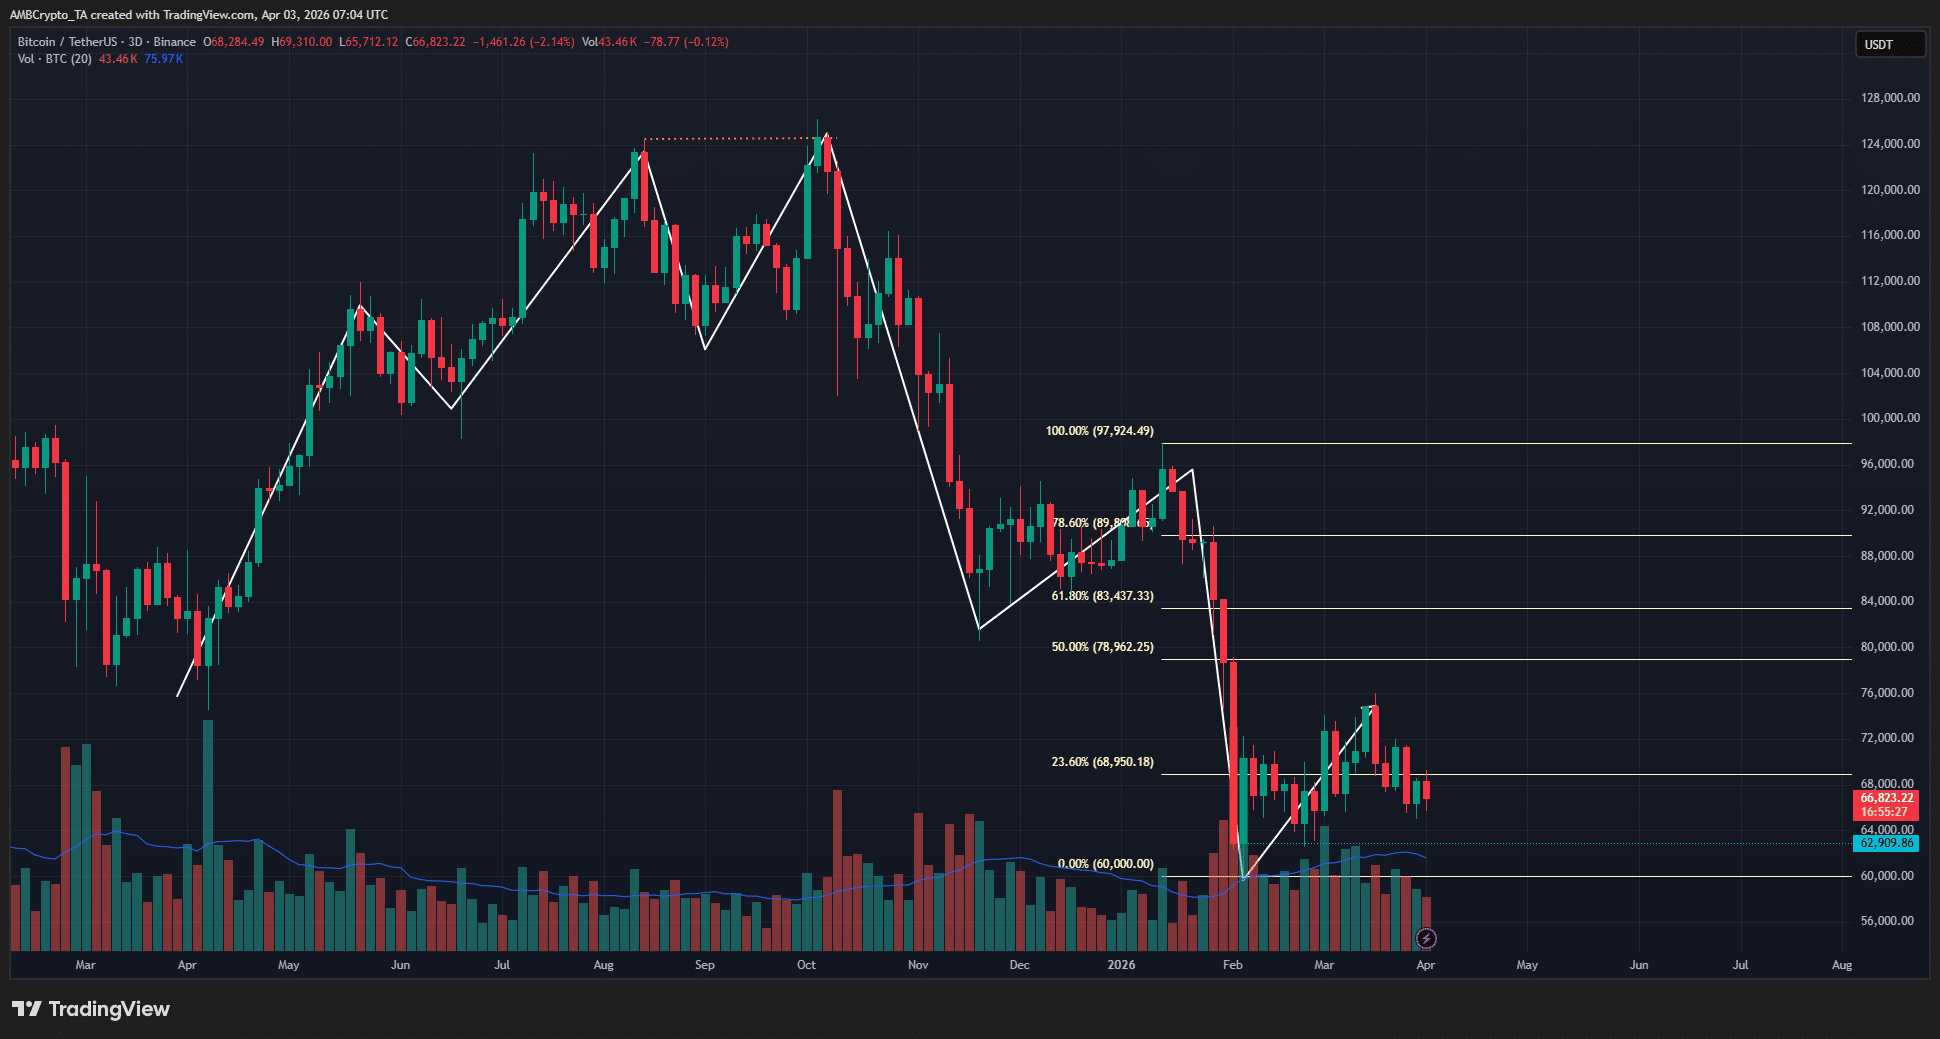
The swing moves on the 3-day timeframe were captured in white. The latest bounce amid the downtrend came in February and was incomplete. There’s a reason why it is considered incomplete.

In October 2025, when the swing structure was bullish, Bitcoin made a double top at $124.4k. This inability to continue the uptrend was an early warning sign of weakness from the bulls.

Subsequently, the swing structure shifted bearishly after the $107.2k low was breached in early November.

Consider the price action since February. The $60k swing low resulted in a bounce that has not climbed above the 50% retracement level.

Many analysts consider the area above the 50% retracement as “premium,” and a move into this area is more likely to result in the next bearish swing move.

The threshold was at $78.9k, and the latest bounce only reached $76k. After this bounce, Bitcoin has not yet climbed below the $60k swing low.

Expectations for Bitcoin’s next move

Source: BTC/USDT on TradingView

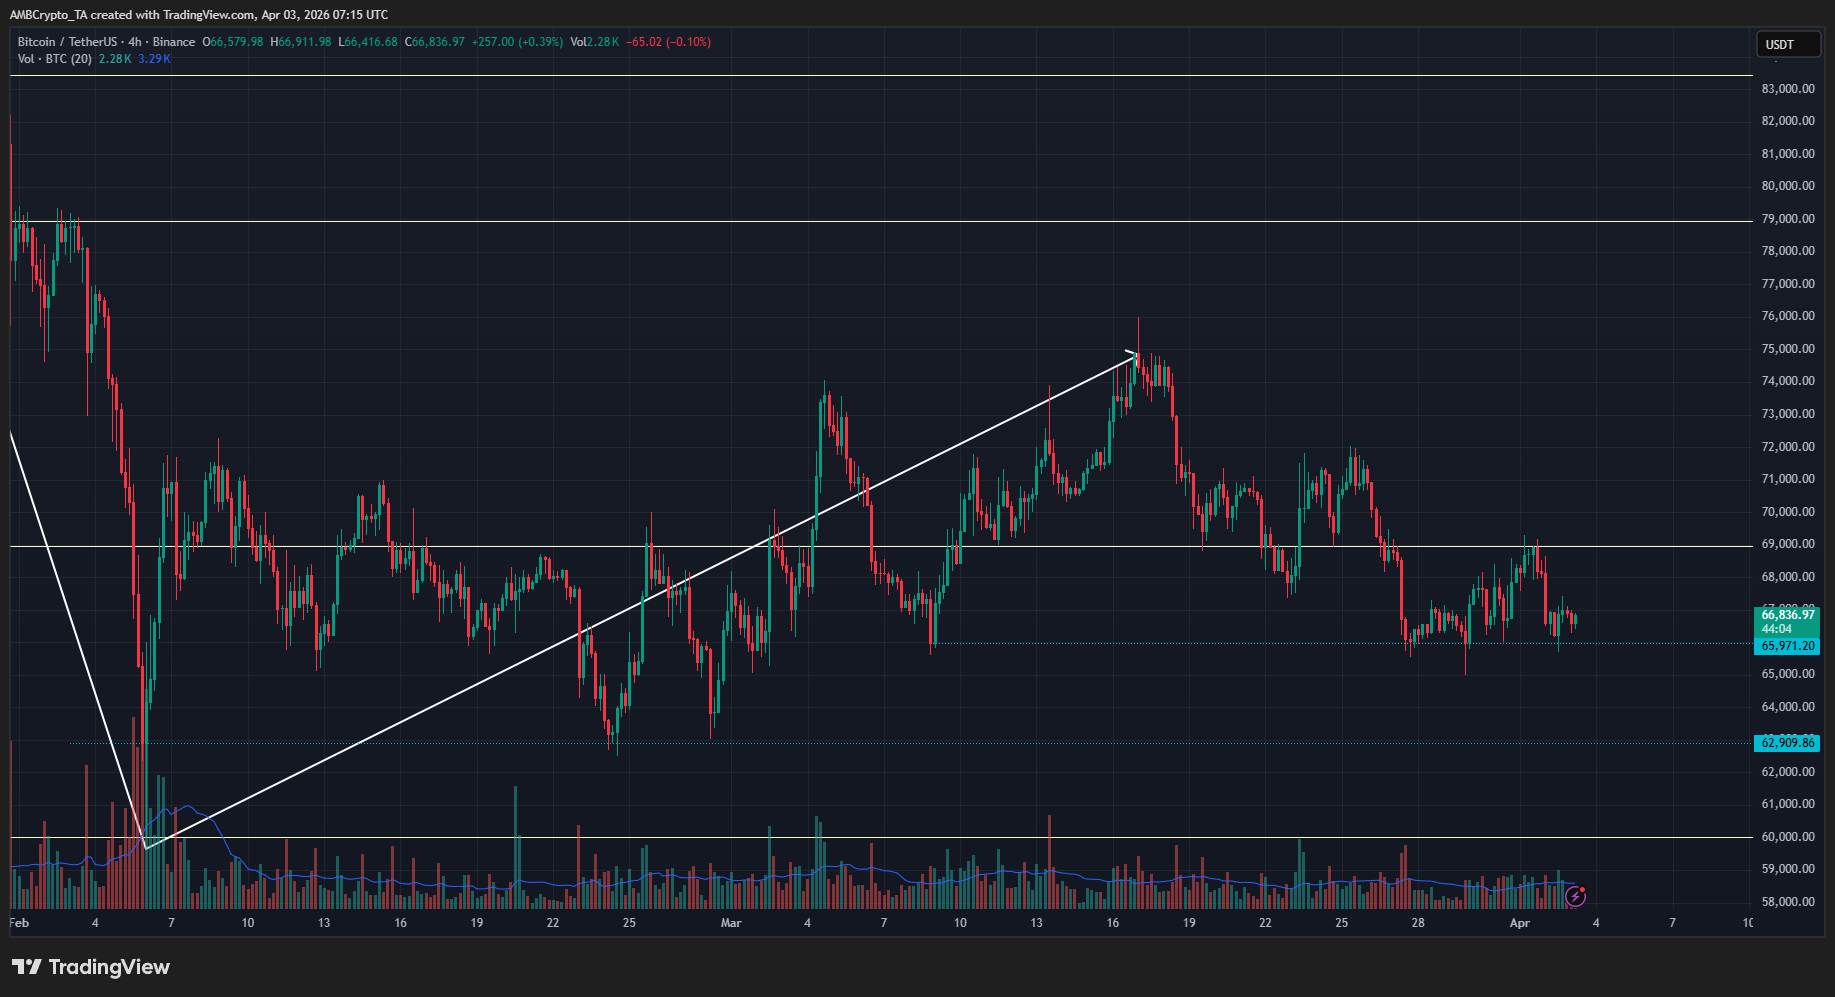
Like the double top in October 2025, Bitcoin’s inability to set new lows in recent weeks was an intriguing development. Consider the $65.9k and $62.9k levels (dotted cyan).

The H4 timeframe’s swing structure was bullish, but the price was resting near the $65.9k swing lows. A session close below $65,618 is needed to flip the H4 expectations bearishly.

Similarly, a 3-day session closing below $60k is needed to show that the long-term downtrend will continue.

Until this happens, expecting a Bitcoin price bounce into the premium value area above $78.9k is valid. As things stand, the market is waiting for a catalyst to drive the next move.


Final Summary

  • The 3-day and 4-hour timeframe price charts of Bitcoin yielded some counterintuitive bullish expectations around the lower timeframe structure.
  • The importance of the swing low at $65.9k and its defense over the past week means that bears weren’t fully in control of the short-term trend.

Related Questions

QWhat were the main factors causing institutional traders to hedge against downside risk in Bitcoin?

AThe West Asia crisis resulted in surging oil prices and fears of growing inflation, which led institutional traders to hedge against further downside, evident in the increased demand for puts (bearish bets).

QWhat key price level on the 3-day timeframe is considered the threshold for the 'premium' value area?

AThe threshold for the 'premium' value area is at $78.9k, which is above the 50% retracement level.

QWhat are the two critical price levels that need to be breached to confirm a bearish trend continuation?

AA session close below $65,618 is needed to flip the H4 expectations bearishly, and a 3-day session closing below $60k is needed to show that the long-term downtrend will continue.

QWhat was the significance of Bitcoin's price action around the $65.9k level in the short-term?

AThe defense of the $65.9k swing low over the past week means that bears weren't fully in control of the short-term trend, indicating potential for a bounce.

QWhat early warning sign of weakness from the bulls was identified in October 2025?

AIn October 2025, Bitcoin made a double top at $124.4k, and its inability to continue the uptrend was an early warning sign of weakness from the bulls.

Related Reads

XRP Ledger Daily Fees Drop Below $400 As Network Activity Question Returns

The XRP Ledger is drawing attention as daily network fees have fallen below $400. While low fees align with XRPL's design for affordable transactions and are often seen as a strength, the metric can also serve as an indicator of network demand and paid transaction volume. This data point of around $3,100 in weekly fee burn highlights the stark contrast with higher-fee chains like Ethereum and Bitcoin. The development fuels an ongoing debate. Proponents view low fees as a sign of efficiency and accessibility, while critics may question if the network is generating sufficient high-value activity relative to its market cap and payments-focused narrative. The article cautions against overstating the finding, noting a single low-fee day does not signify network failure. It instead adds context to discussions about XRPL's usage, especially alongside Ripple's broader initiatives in stablecoins (RLUSD), AI payments, and enterprise infrastructure. The report recommends monitoring for a fee rebound, checking transaction counts for a fuller picture, and confirming the trend via native explorers like Bithomp. It frames the story within a larger market shift where on-chain data, protocol updates, and infrastructure developments are becoming crucial alongside price action. The editorial stance is to present the verified data, explain its significance for assessing network activity, and avoid hype, positioning it as part of the daily crypto conversation.

bitcoinist2h ago

XRP Ledger Daily Fees Drop Below $400 As Network Activity Question Returns

bitcoinist2h ago

Trading

Spot
Futures

Hot Articles

Discussions

Welcome to the HTX Community. Here, you can stay informed about the latest platform developments and gain access to professional market insights. Users' opinions on the price of S (S) are presented below.

活动图片