Bitcoin [BTC] was up 5.44% over the past thirty days, but its bullish momentum has stalled over the past week. Recently, the price has been stuck between the $69k-$71k levels. There were signs of BTC accumulation, but there were also metrics that supported the view that holders were selling into short-term strength.
In the short-term, the weakened spot ETF flows likely reflected the dimmed bullish sentiment behind BTC. From the 18th to the 20th of March, Farside Investors’ data revealed a $305.7 million outflow.
AMBCrypto reported on the ETF outflows and observed that this could trigger a pullback to the $65k support. So far, it has not happened, but it was a possibility swing traders should be prepared for.
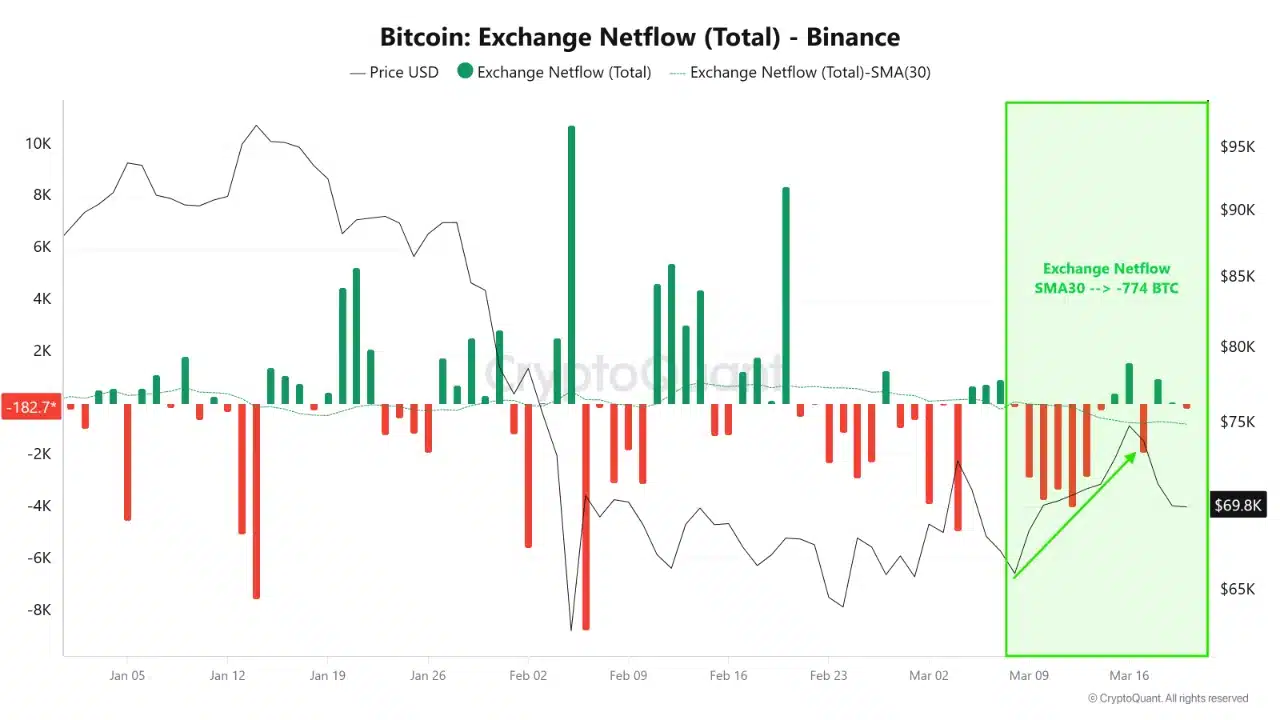

Despite the ETF capital outflows, there was a sign of accumulation. Notably, a CryptoQuant analyst observed that Bitcoin netflow (30-day Moving Average) from Binance was dropping below zero.
The negative netflows indicated accumulation, and Bitcoin rallied from $65k to $74k as a result. While the equities market posted losses, exchange outflows reflected demand that has kept prices around the $70k mark.
Examining the potential for an ‘imminent flush’

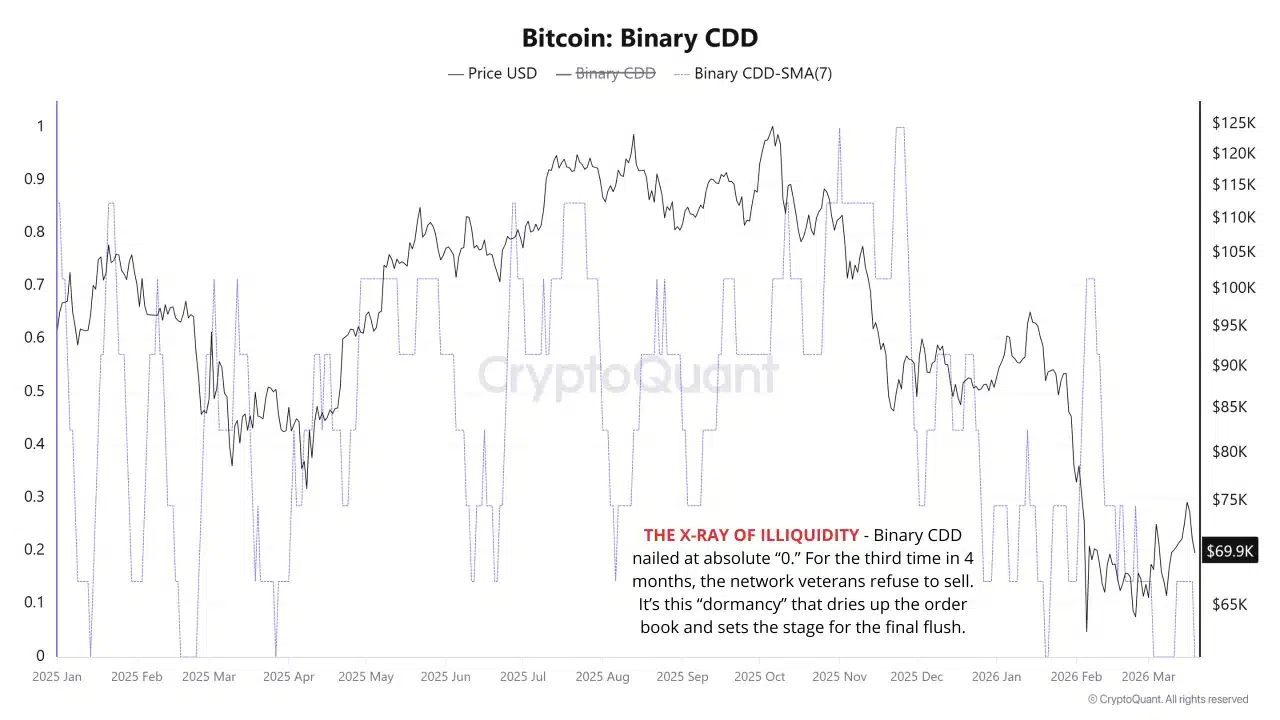
Another crypto analyst wrote that the binary CDD was the”deadliest data point“. The metric measures whether long-term holders’ coin movements are higher or lower than average.
Readings clustered around 1 show that holders are preparing to sell. Using the 7SMA to smooth the metric, the analyst observed that the reading of 0 was seen for the third time in four months.
This can set up the conditions for a violent price flush. The zero reading showed veteran holders were not selling, which could give rise to an illiquid environment and pave the way for a price correction.
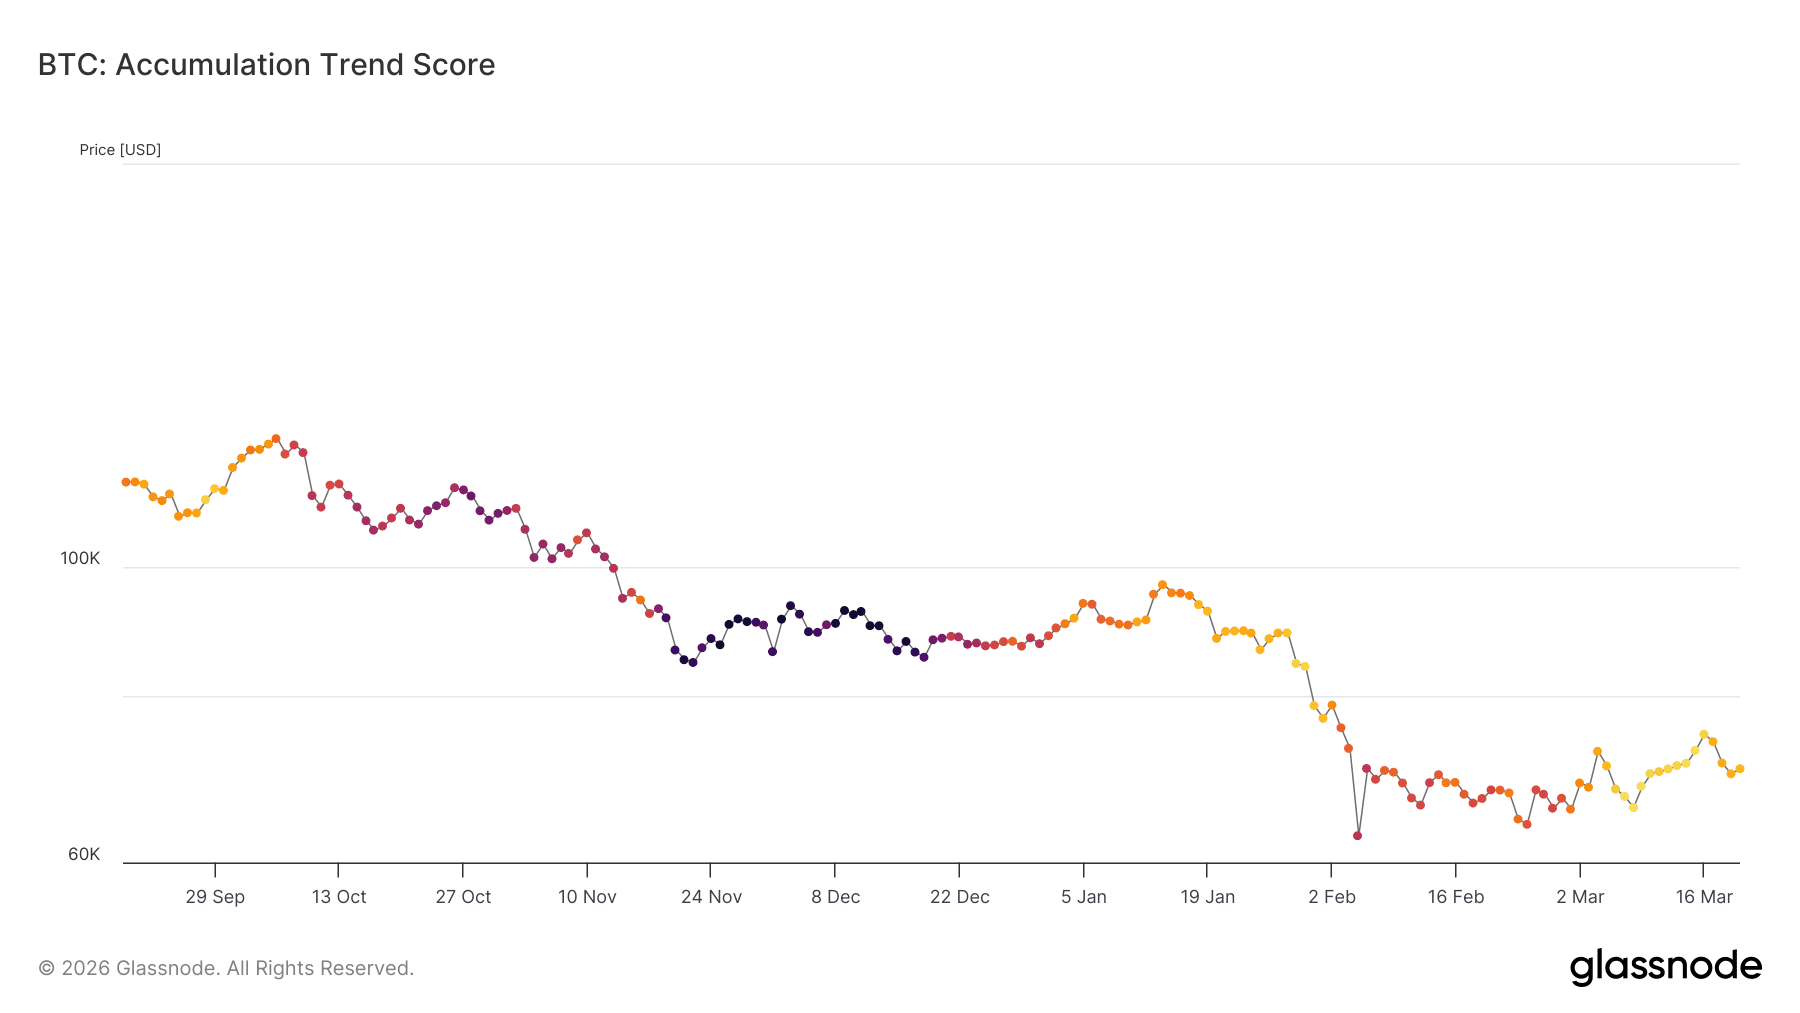

AMBCrypto examined the accumulation trend score metric to understand if larger entities were hoarding or selling BTC. At the time of writing, the trend score was 0.094.
Values closer to zero indicate larger entities were distributing BTC. This meant that it would be harder for momentum to continue to be bullish in the coming weeks.
Overall, the metrics examined have produced mixed signals. In the short-term, a sustained push higher was possible. At the same time, long-term investors should remember that the rally was not the result of aggressive spot demand and position themselves accordingly.
Final Summary
- The exchange outflows in recent days indicated Bitcoin accumulation and helped explain the rally in March.
- Other metrics showed that holders were distributing into the short-term BTC strength, raising questions over how long the rally can be sustained.