大家好,我是 Odaily 的特邀分析师 Cody。
上周我们对 HYPE 与 BTC 的行情预判再度得到市场验证——HYPE 在IV浪低点附近止跌回升,BTC 则维持区间宽幅震荡格局,走势与此前判断高度吻合。
本周,行情走到了一个需要耐心而非冲动的节点,我们将继续围绕 HYPE 与 BTC 展开分析,重点聚焦本周入场节奏与操作策略。
欢迎加入我们Odaily的行情分享交流群,我将在群内每日分享盘面点评与短线思路,与大家实时交流市场动态。
本周交易核心观点摘要:
• HYPE 多周期走势结构分析。
• HYPE 市场动态演变全周期跟踪。
• HYPE 本周行情预判及短线操作策略。
• BTC 当前走势结构分析。
• BTC 本周行情预判及中、短线操作策略。
交易策略及核心观点市场验证:
• HYPE 短线交易成效:HYPE 上周完成二次短线多单操作(1 倍杠杆),累计实现收益约 9.02%。(详解见表一)
• HYPE 行情走势预判市场验证:在上周文章中我们指出:HYPE 的IV浪调整可能在 4 月 2 日低点 34.44 美元附近结束,后续将有上涨趋势。上周我们的核心任务即为捕捉右侧做多买点。当前市场走势验证了我们此前的观点,上周市场反弹最高价已触及 43.18 美元。
• BTC 中期交易成效验证:比特币上周遵循既定中线策略,继续持有于 89,000 美元(1 倍杠杆)建仓的空单,截止上周收盘(约 70,742 美元)盈利约 20.51%,期间最大盈利约 32.58%。(详解见第六部分内容)
• BTC 行情走势预判市场验证:在上周文章中我们指出:市场将维持区间宽幅震荡格局。当前市场走势验证了我们此前预判的观点。
一、HYPE:走势结构分析
1、HYPE 日线级别走势结构划分:(基于 1 月 21 日之后的行情演变)
HYPE_ 日 K 线图
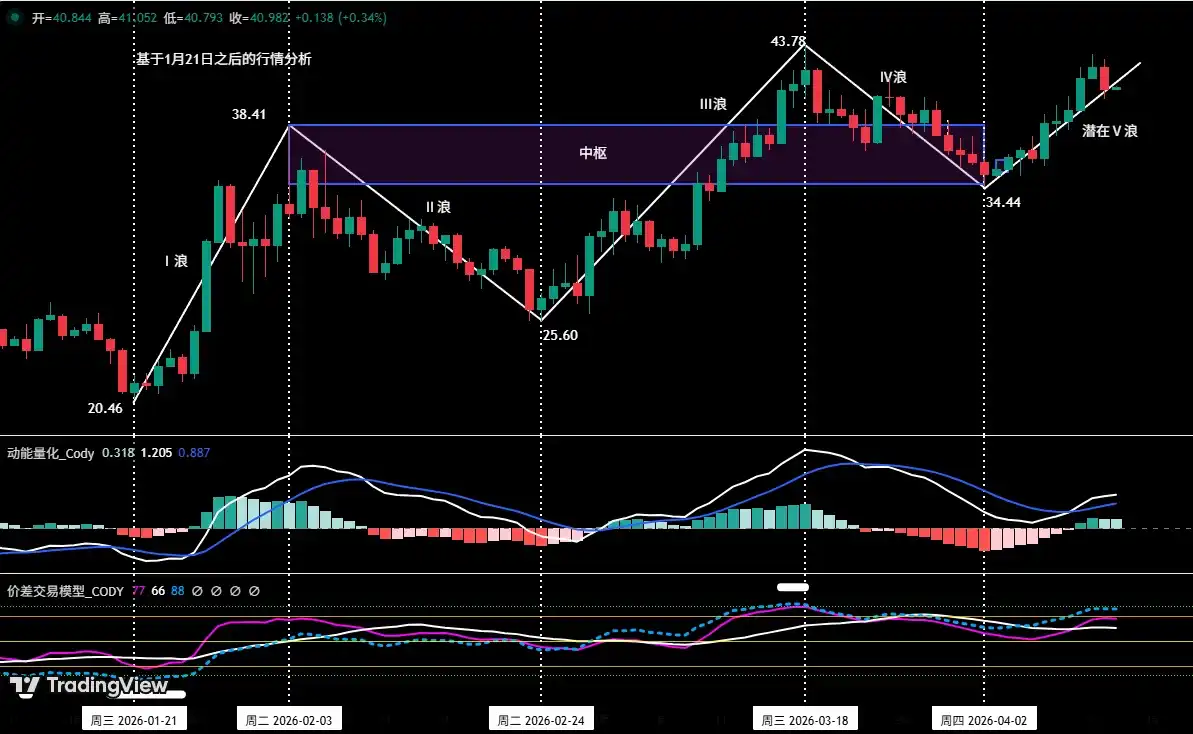
图一
如(图一)所示:
• I浪(驱动浪):自 1 月 21 日低点 20.46 美元至 2 月 3 日高点 38.41 美元,历时 14 天,期间最大涨幅达 87.73%。
• II浪(调整浪):自 2 月 3 日高点 38.41 美元至 2 月 24 日低点 25.60 美元,历时 20 天,期间最大跌幅为 33.35%。
• III浪(主升浪):自 2 月 24 日低点 25.60 美元至 3 月 18 日高点 43.78 美元,历时 23 天,期间最大涨幅达 71.02%。
• IV浪(调整浪):自 3 月 18 日高点 43.78 美元至 4 月 2 日低点 34.44 美元,历时 15 天,期间最大跌幅达 21.33%。
• 潜在V浪(驱动浪):自 4 月 2 日低点 34.44 美元至今,已运行 10 天,期间最大涨幅达 25.38%。由于当前价格尚未突破III浪高点(38.41 美元),所以此走势仍属潜在V浪阶段。
2、HYPE 市场动态演变全周期跟踪
• 2 月 23 日周评:首次提示 HYPE 可能进入投资窗口,指出当时行情在处于II浪回调阶段,并预判随后有望启动III浪主升行情。
• 3 月 3 日周评:判定 2 月 24 日的低点 25.60 美元可能是III浪的启动点,确认趋势转换的潜在位置。
• 3 月 9 日周评:指出价格在日线级别已有效突破多重均线阻力,随后进入回踩整固阶段,预计结束后将迎来快速上涨。
• 3 月 16 日周评:指出当时行情处于III浪趋势中,正在构筑上涨中枢(即中枢 B)。预判构建完毕后,将运行区间宽幅震荡的概率大。
• 3 月 30 日周评:指出整个市场结构仍处于日线级别上涨趋势,当时价格正处于对I浪顶底(38.41 美元)突破后的回踩确认,即IV浪调整阶段。
• 4 月 6 日周评:指出当时市场IV浪调整可能已在 4 月 2 日低点(34.44 美元)结束,后续或将迎来V浪上涨阶段。
3、HYPE 当前走势结构深度解构(以 4 小时为分析周期)
HYPE_4 小时 K 线图
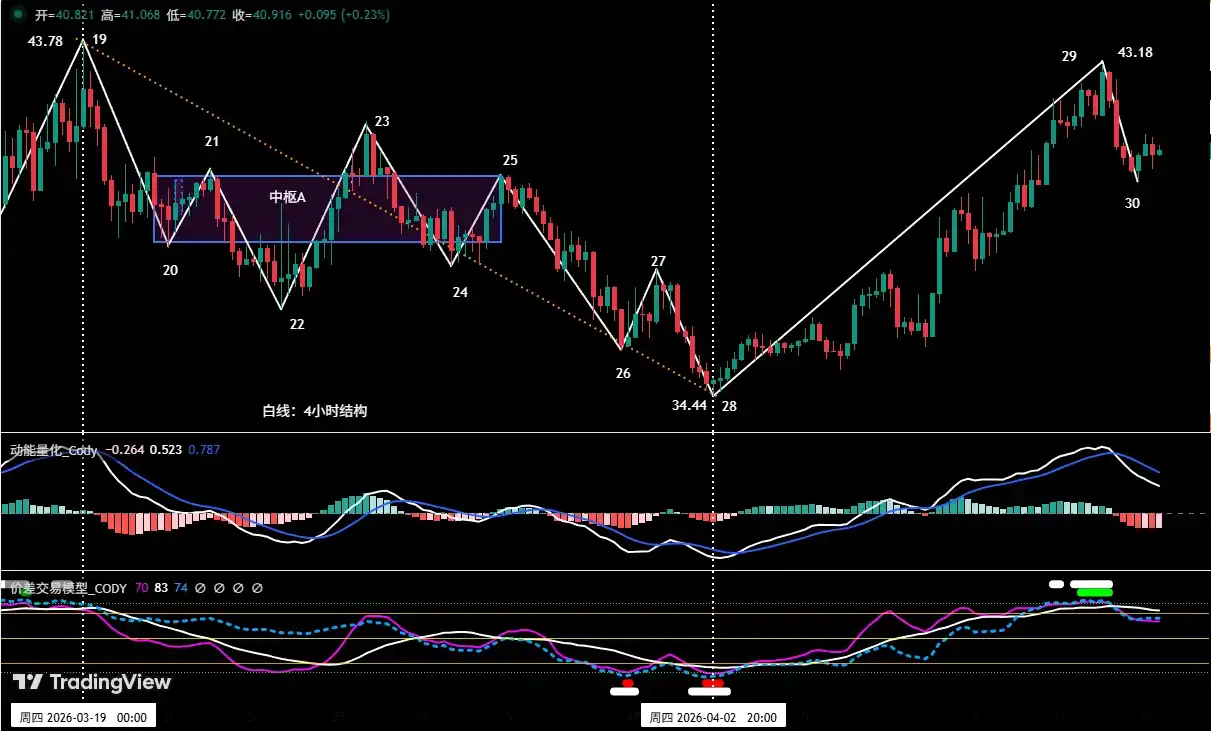
图二
• 基于 4 月 2 日低点 34.44 美元之后的潜在V浪上升走势结构划分。
• 如(图二)所示,潜在V浪可细分为:自端点 28 至端点 30 之间,由 28-29、29-30 共 2 段构成的上涨结构。
• 目前行情正在运行 29-30 段。图中显示,从我们自建的价差交易模型看,端点 29 触发顶部预警信号(图中绿点、白点),意味着技术指标处于超买状态,短期有震荡调整需求。
二、HYPE:本周行情预判及短线操作策略
1、HYPE 本周行情走势预判:
• 本周行情预判:如(图二)所示,自 4 月 2 日低点至今,HYPE 已连续上涨 10 天,非常接近前期III浪高点 43.78 美元。从 4 小时图看,短期技术指标发出超买信号,本周初价格存在震荡风险,建议投资者避免盲目追高,可耐心等待洗盘结束、走势稳定后的低吸机会,并注意严格设置止损。
2、HYPE 本周短线操作策略:
• 基于对整体上涨趋势的预判,应遵循“顺势而为,逢低做多”的策略。
• 依据自主构建的量化模型信号,以 30 分钟/60 分钟作为操作周期,利用 30%仓位,捕捉入场做多机会。
• 开仓策略:HYPE 本周初面临调整需求。若价格在回踩关键支撑区域 37.5~38 美元过程中,出现确认站稳支撑上方信号时,同时结合两大模型触发的底部买入信号,可考虑进场做多,并需严格设置止损。
三、比特币:震荡走势结构剖析
比特币 _4 小时 K 线图
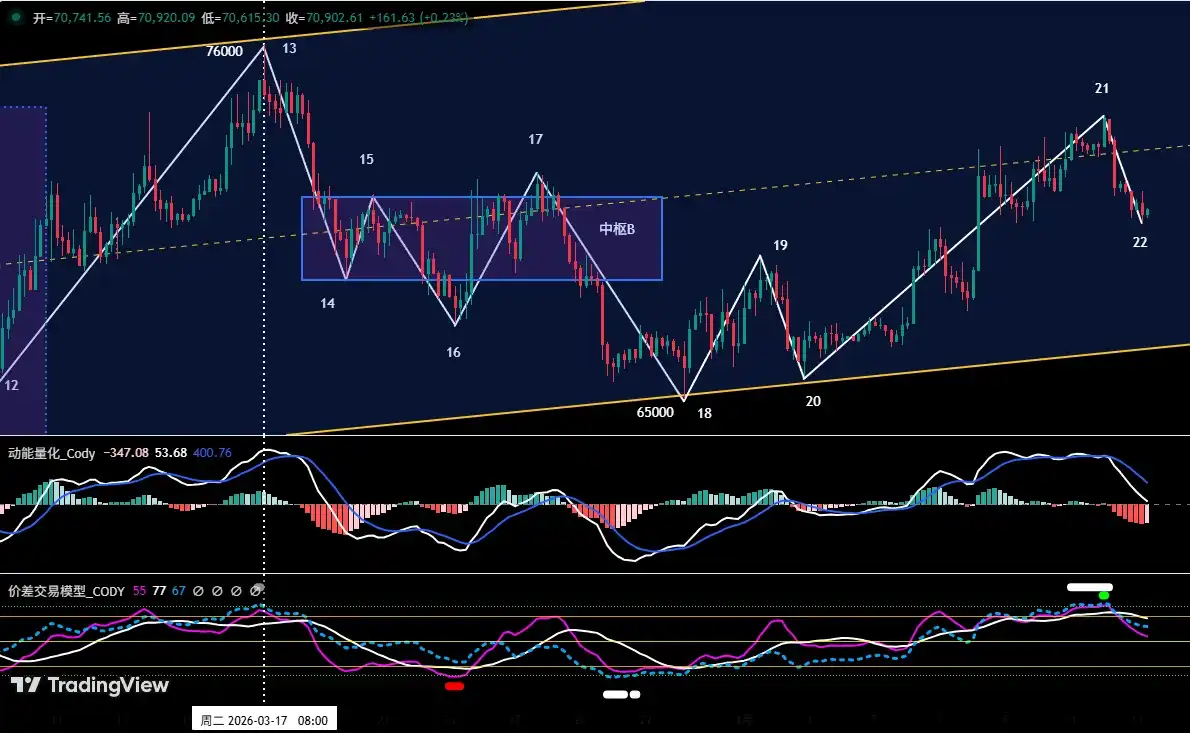
图三
1、基于 3 月 30 日低点 65,000 美元之后的行情演变。
2、如(图三)所示,BTC 自 3 月 30 日低点启动震荡上行走势。自端点 18 至端点 22,共有 18-19、19-20、20-21、21-22 共 4 段式结构组成。
3、 目前,正在运行 21-22 段。图中显示,从我们自建的价差交易模型看,端点 21 附近触发顶部预警信号(图中绿点、白点),意味着技术指标处于超买状态,同时面临 74,500 关键阻力位。因此,市场短期有下跌震荡调整需求。
四、比特币:本周行情预判及操作策略
1、BTC 本周行情走势预判:
• 本周核心观点:
本周预计维持于 65,000~74,000 美元区间宽幅震荡。当前币价正回踩区间中轴线及关键支撑位 69,500 美元附近支撑。若此处支撑有效,市场将维持强势震荡结构:若有效跌破支撑,则震荡结构转弱,币价可能进一步下探 65,000 美元附近的关键支撑。目前市场受消息面主导,情绪敏感且方向不明,建议投资者暂以观望为主。
2、核心压力位:
• 第一压力区:74,500~76,000 美元区域 (2025 年 4 月低点附近)
• 第二压力区:79,000~80,600 美元区域 (2025 年 11 月低点附近)
3、核心支撑位:
• 第一支撑位:69,500 美元附近 (前期重要支撑位)
• 第二支撑位:65,000~66,000 美元区域 (震荡区间下轨附近)
• 第三支撑位:60,000~62,500 美元区域 (2 月 6 日低点附近)
4、本周操作策略(排除突发消息影响):(04.13~04.19)
1、中线策略:
比特币 _ 日 K 线图:(仓位监测模型)
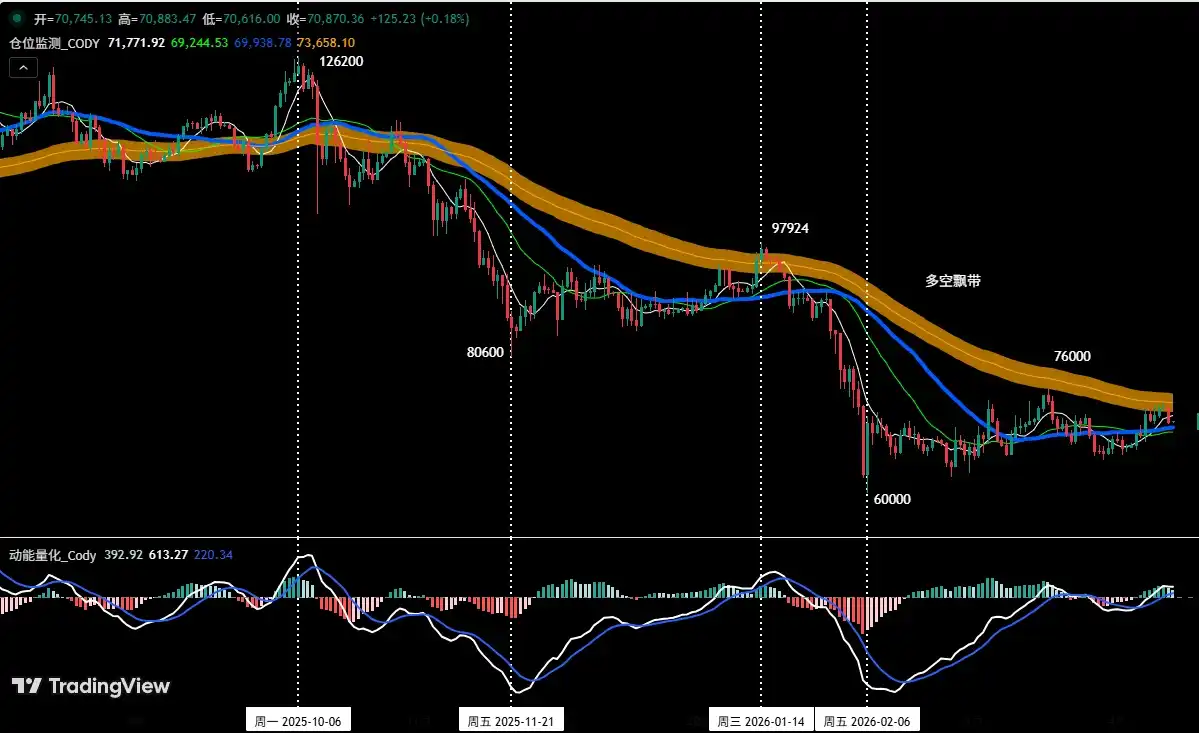
图四
仓位监测模型:如(图四)所示,目前币价位于多空飘带(黄色)下方,空头趋势延续。我们依据策略规则,继续持有于 89,000 美元(1 月 28 日)建立的 60%空单仓位。
• 若币价反弹有效突破多空飘带并站稳其上方,将中线仓位全部清零。
2、短线策略:利用 30%仓位,设置止损点,依据支撑及压力位,寻找做“价差”机会。(以 30 分钟/60 分钟作为操作周期)。
3、基于对市场中期空头趋势的预判,目前应坚持“顺势做空”的操作原则。为动态应对市场复杂演变并结合自建交易模型发出的信号,我们将拟定A/B/C三套短线操作预案:
• 方案 A:反弹遇阻,逢高沽空。
• 开仓:当币价反弹至 74,500~76,000 美元区域触发遇阻信号并结合模型顶部信号,可建立 30%空头仓位。
• 风控:初始止损位设于 76,500 美元上方。
• 平仓:当币价跌至重要支撑位附近并结合模型信号,可逐步清仓获利了结。
• 方案 B:小仓位破位空单。
• 开仓:当币价有效跌破 69,000 美元附近关键支撑,并结合模型顶部信号,可顺势建立 30%空头仓位。
• 风控:初始止损位设于 70,500 美元上方。
• 平仓:当下跌至支撑位并结合模型信号,可逐步清仓获利了结。
• 方案 C:大仓位破位空单。
• 开仓:当币价有效跌破 65,000 美元附近关键支撑,并结合模型顶部信号,可顺势建立 60%空头仓位。
• 风控:空单初始止损设于 66,500 美元上方。
• 平仓:当下跌至支撑位并结合模型信号,可逐步清仓获利了结。
五、HYPE :操作复盘
1、短线操作回顾:(见表一)
我们严格遵循操作预案,依据自主构建的价差交易模型与动能量化模型发出的交易信号,在上周完成二次短线(多单)操作,累计交易盈利 9.02%。
2、HYPE 短线交易明细汇总:(杠杆*1 倍)
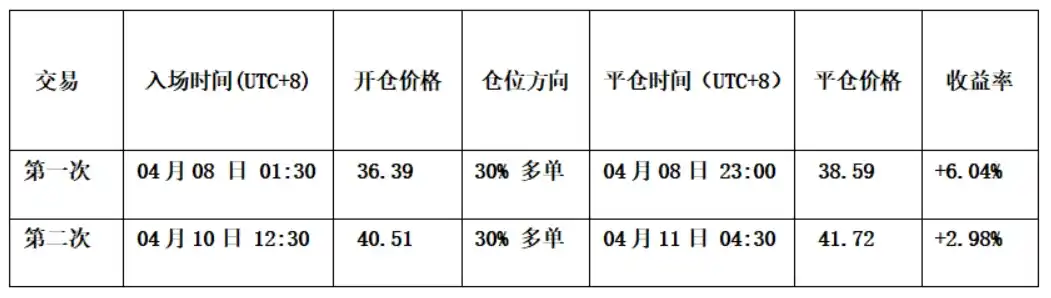
表一
3、第一次短线交易复盘:(见图五)
• 开仓策略:基于对市场IV浪调整已在 34.44 美元附近结束的判定,并结合动能模型发出的底部背离信号,以及价差交易模型处于底部位置,我们制定了逢低做多的计划。因此,当价格回踩该位置并出现止跌站稳信号时,我们于 36.39 美元建立了 30%多头仓位。
• 平仓策略:当价格上涨至 40 美元附近时遇阻,同时价差交易模型触发强烈顶部预警信号(绿点+白点),因此,我们于 38.59 美元附近全部清仓。
• 小结:本次交易成功盈利约 6.04%。
3、第二次短线交易复盘:(见图五)
• 开仓策略:当价格突破 39.5 美元关键阻力并回踩成功,同时 K 线出现“底分型”组合,并结合两大模型发出共振上涨信号。因此,我们于 40.51 美元建立了 30%多头仓位。
• 平仓策略:当价格涨至 43 美元附近时遇阻,同时价差交易模型触发强烈顶部预警信号(绿点+白点),因此,我们于 41.72 美元附近全部清仓。
• 小结:本次交易成功盈利约 2.98%。
HYPE_30 分钟 K 线图:(动能量化模型+价差交易模型)
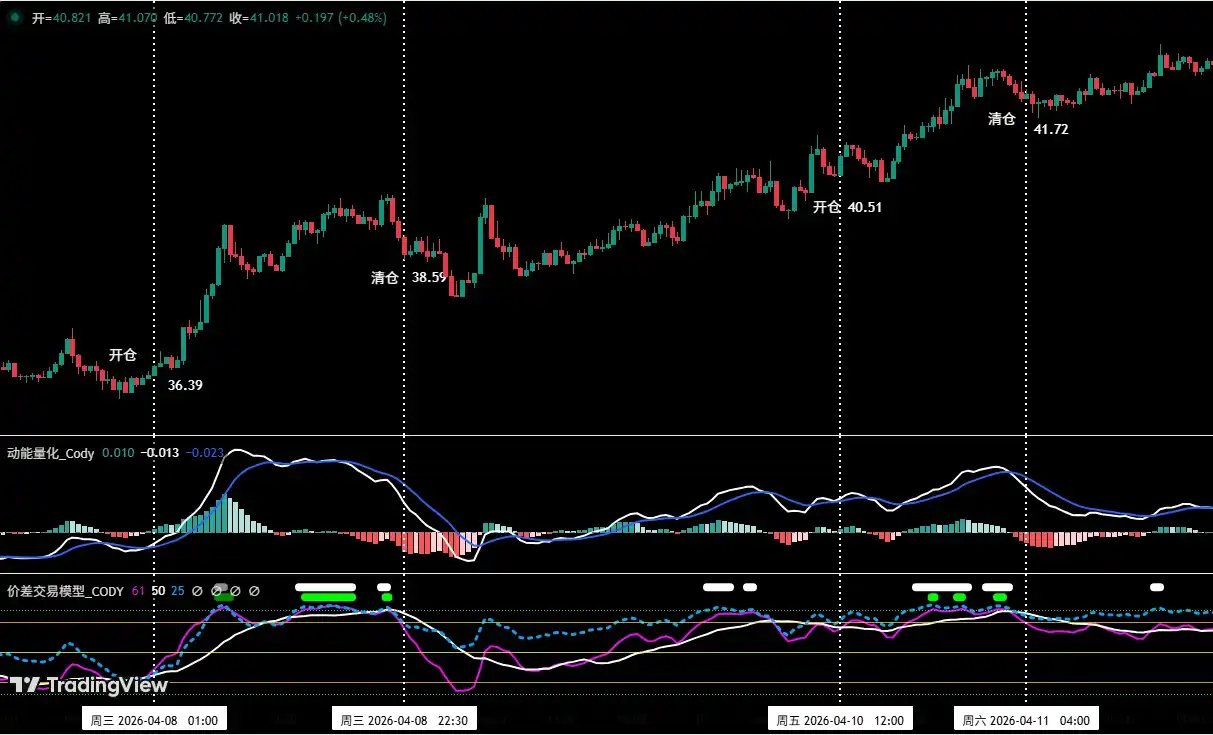
图五(短线交易图示)
六、特别提示:
1. 开仓时:立即设置初始止损位。
2. 盈利达 1%时:将止损位移至开仓成本价(盈亏平衡点),确保本金安全。
3. 盈利达 2%时:将止损位移至盈利 1%的位置。
4. 持续跟踪:此后币价每再盈利 1%,止损位就同步移动 1%,动态保护并锁定。
金融市场瞬息万变,所有行情分析及交易策略均需动态调整。本文所涉及的全部观点、分析模型与操作策略,均源自个人技术分析,仅为个人交易日志之用,不构成任何投资建议或操作依据。市场有风险,投资需谨慎,请勿据此决策。
如需获取每日行情点评与实时交流,欢迎加入Odaily行情分享交流群,我们一起跟踪市场、探讨策略。