The Bitcoin market has recently seen a key development: the amount of Bitcoin in long-term holder wallets has dropped to a cyclical low. This change has drawn widespread market attention—could it be enough to help bullish forces stabilize and prevent further declines toward $70,000?
Long-Term Holder Supply Falls to April Levels
So-called "Long-Term Holders" (LTHs) typically refer to entities holding Bitcoin for at least 155 days. According to the latest data from Glassnode, Bitcoin holdings by these investors have gradually decreased from 14.8 million in mid-July to approximately 14.3 million in December.
Correspondingly, the proportion of Bitcoin held by long-term holders relative to the total circulating supply has also fallen to 71.92%, a level comparable to that of April this year, as shown in the chart below.
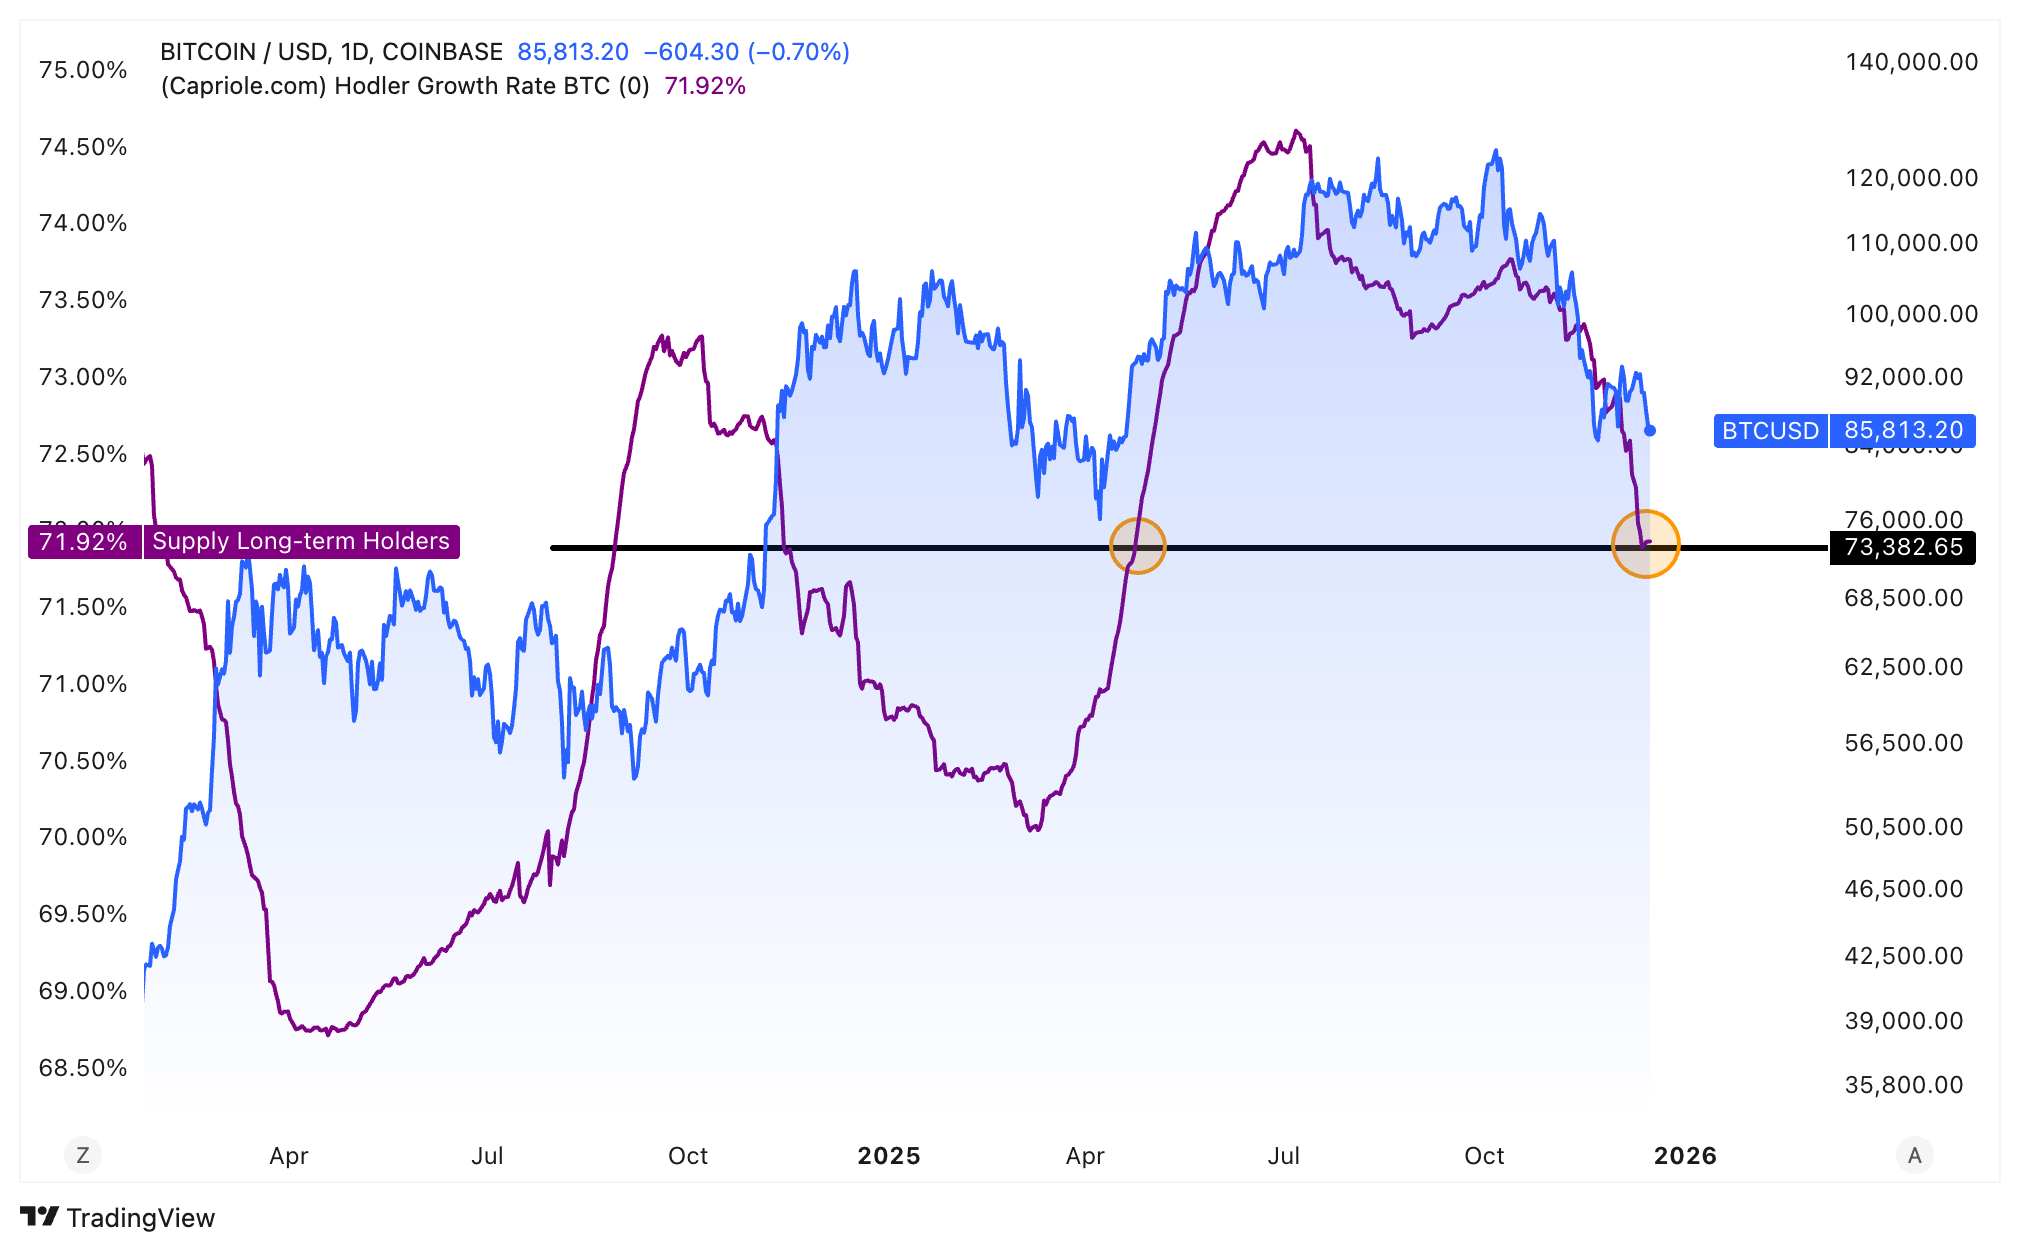
Chart of Bitcoin Long-Term Holder Supply Percentage Change, Source: Capriole Investments
Looking back at the market in April, Bitcoin's price was retreating from its all-time high of $109,000 on January 20, falling to around $74,000 at one point. At that time, long-term holders took the opportunity to buy at lower levels, pushing their holding ratio to around 76% by July. The market then saw a rebound, with Bitcoin's price reaching a new high of approximately $123,000 on July 14, marking a gain of about 65% during that period.
If history repeats itself, current long-term holders are likely to view the recent drop in Bitcoin's price to around $84,000 as another accumulation opportunity, potentially driving the price to challenge all-time highs again in the coming months.
Cyclical Perspective: Patterns in Long-Term Holder Supply Changes
From a broader cyclical perspective, long-term holder supply typically shows significant declines during two phases:
First, during periods of market euphoria dominated by retail investors;
Second, near cycle tops, when long-term holders begin to take profits. This was evident in the bull markets of 2017 and 2021.
Focusing on recent data, CryptoQuant's statistics show that in the 30 days leading up to November 26, long-term holder supply decreased by approximately 1.1 million Bitcoin, the second-largest decline in history. As of December 15, long-term holder holdings have decreased by about 761,000 Bitcoin over the past 30 days. This seems to indicate that, as prices continue to face pressure, some long-term holders are choosing to exit, reflecting increased market concern.
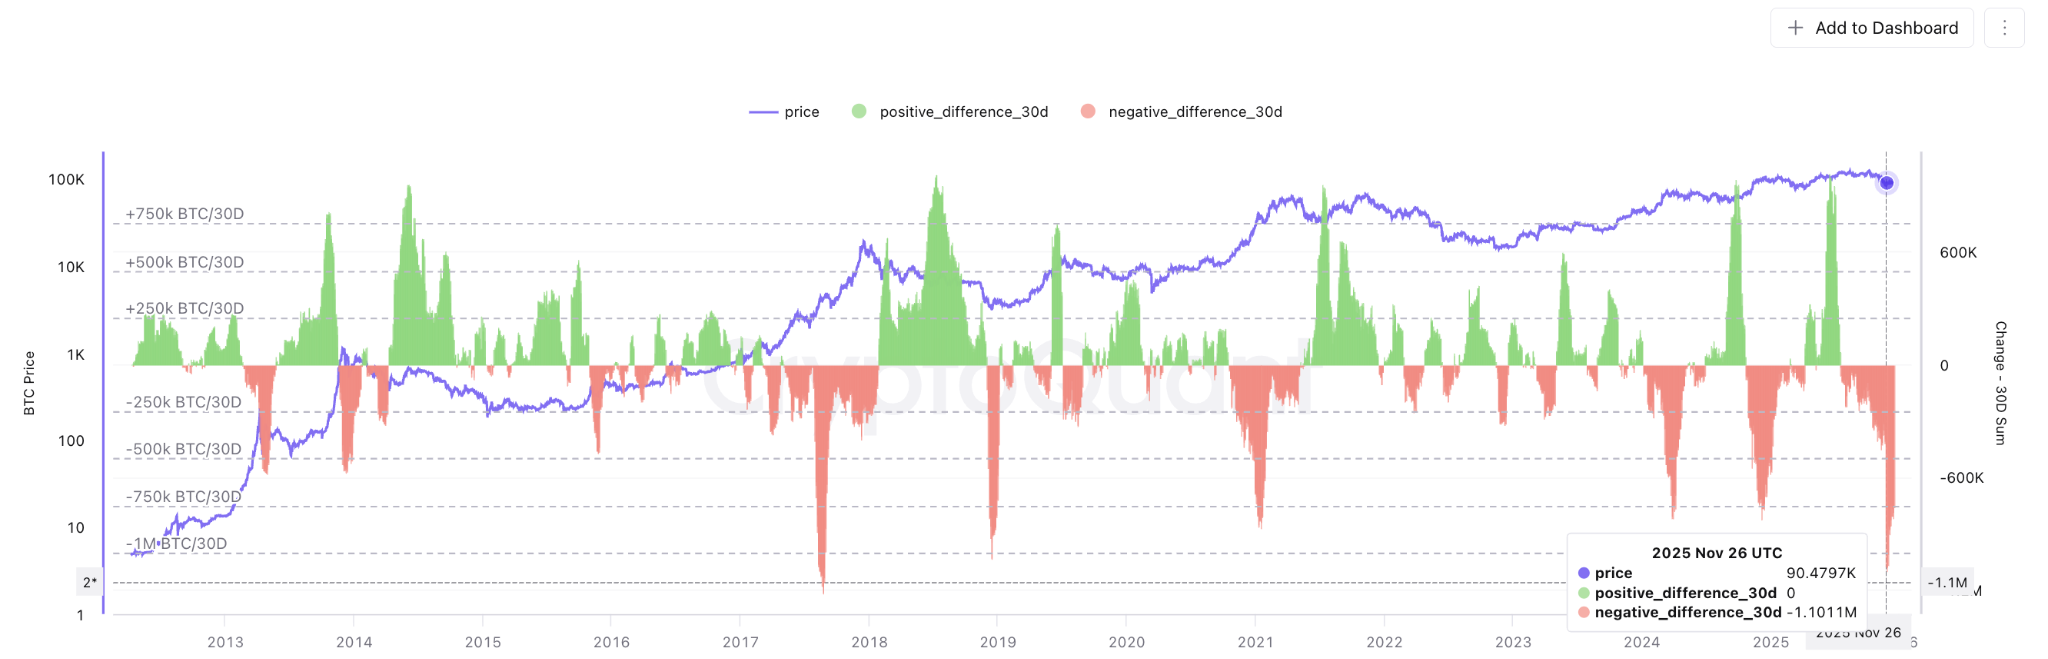
Bitcoin 30-Day Rolling Long-Term Holder Supply Change Chart, Source: CryptoQuant
According to a Marsbit report, over the past month, Bitcoin whale addresses (typically entities holding large amounts of Bitcoin) have collectively sold approximately $2.78 billion worth of Bitcoin, adding sustained downward pressure to the market.
Technical Analysis: Can Bitcoin Hold Key Support Levels?
From a technical structure perspective, Bitcoin's recent performance has weakened, having successively lost support at the 50-week moving average and the year's opening price level of around $93,300.
The chart below shows that the BTC/USD trading pair broke below the lower boundary of the flag consolidation pattern near $92,000 on December 12, confirming a bearish flag pattern. Currently, the first support area of focus lies between the local low of $83,800 on December 1 and the multi-month low of $80,500 on November 21. If this area is breached, Bitcoin could further test the 200-week moving average near $68,500. This potential decline implies a drop of approximately 20% from the current price.
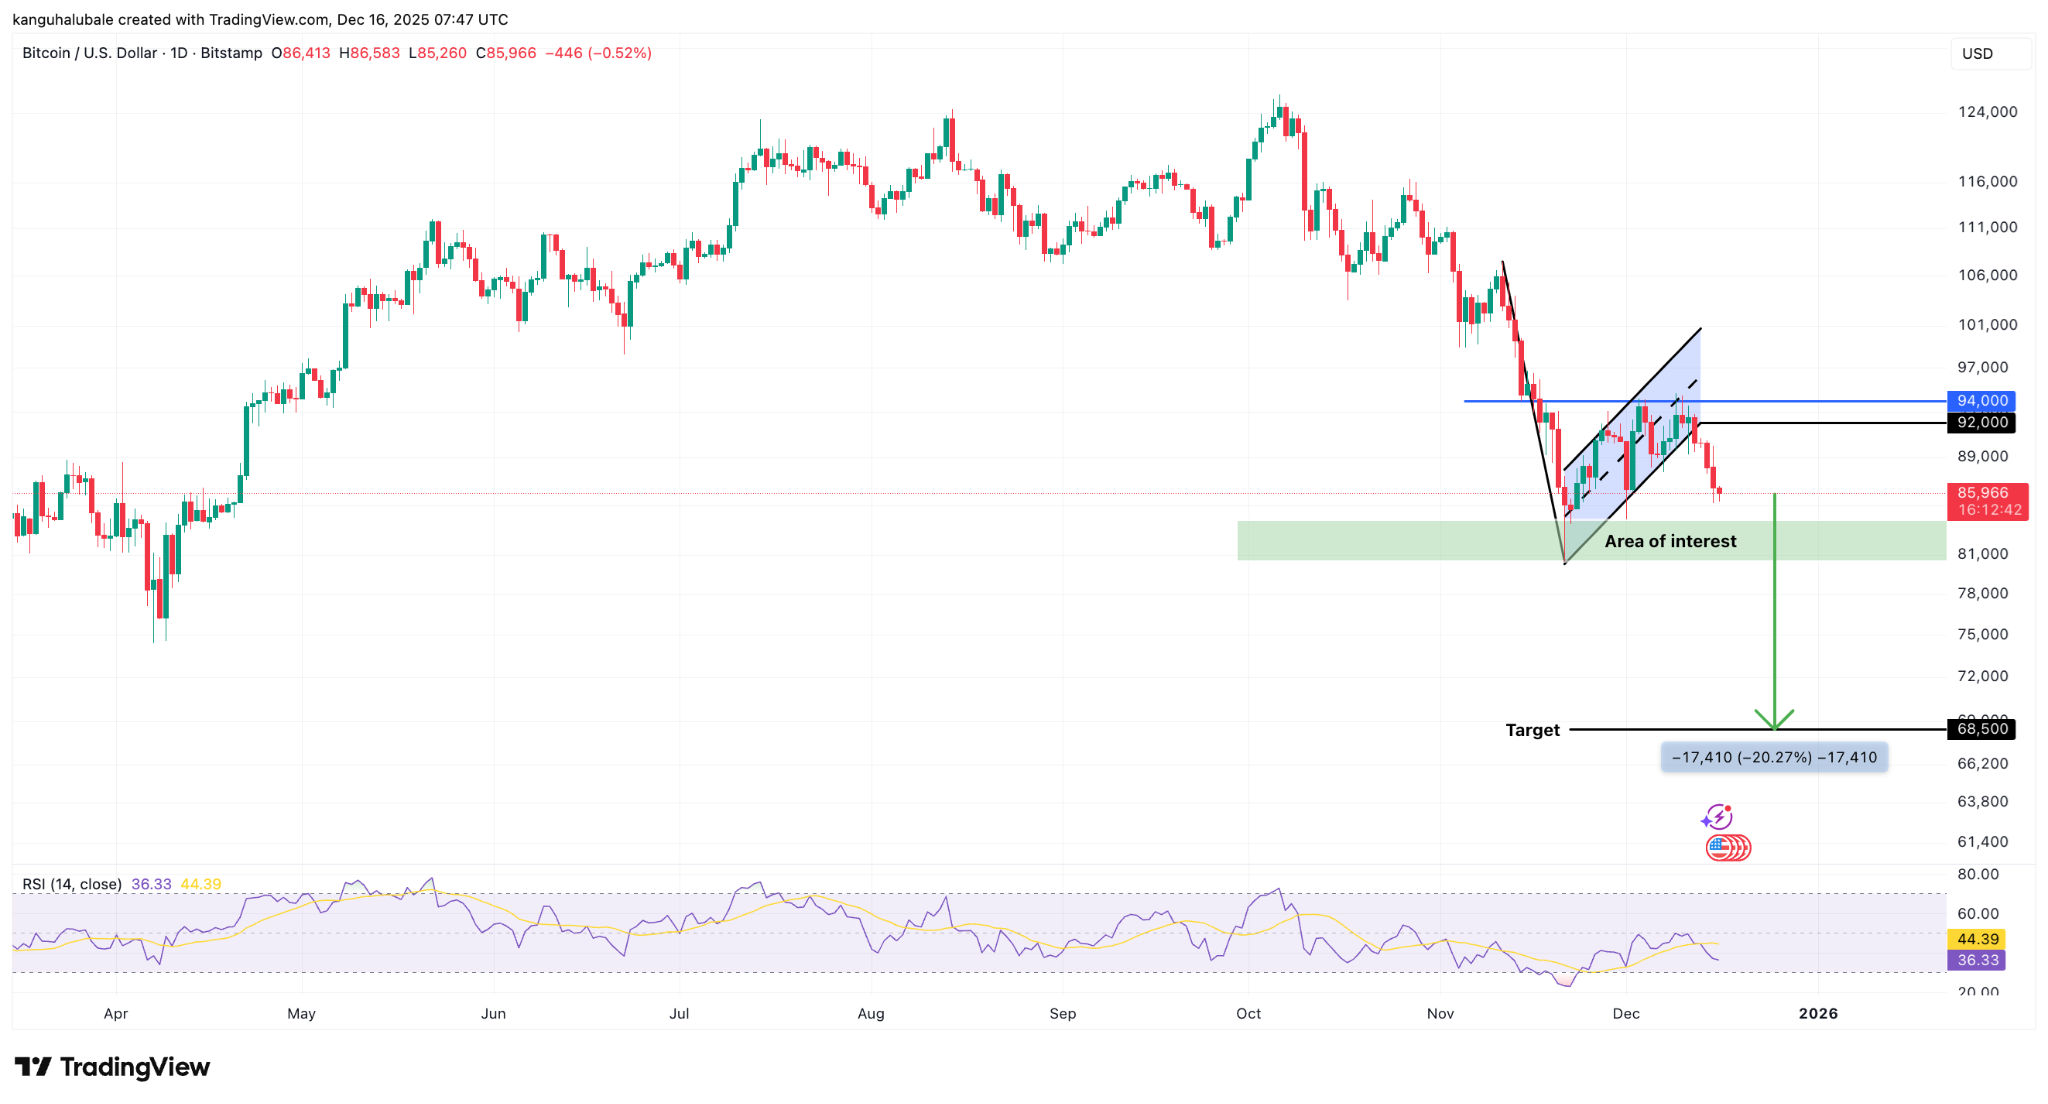
BTC/USD Daily Chart, Source: TradingView
Analyst Nic pointed out via social platform X on Tuesday: "Bitcoin has broken below key levels again, confirming a bearish signal." He added that the next "potential support" is the 100-week exponential moving average, around $85,500.
He further analyzed: "If this level is also broken, subsequent attention should turn to some important on-chain cost levels, such as $83,800 (ETF average cost basis) and $81,200 (realized market average cost), before potentially testing the psychological $80,000 level."
As previously analyzed by Marsbit, Bitcoin's 20-day exponential moving average has begun to turn downward, and the Relative Strength Index (RSI) is also in negative territory, both indicating that bears are dominant in the short term.
Summary and Outlook
The current Bitcoin market is in a delicate phase. The drop in the long-term holder supply ratio to an eight-month low can be interpreted from two angles:
On one hand, this may mean that some steadfast investors are choosing to sell during the price adjustment, perhaps due to concerns about further declines ahead or to take profits, which puts short-term pressure on the market.
On the other hand, historical patterns show that accumulation by long-term holders during price pullbacks often builds momentum for subsequent rallies.
The current decline in holding ratios might also create conditions for them to buy back at lower prices, thus forming new support. However, the market also faces clear short-term challenges: whale selling is adding pressure, technical charts show weakness, and key support levels are being tested one by one. Whether Bitcoin can find effective support in the $80,000 to $84,000 range will be crucial for determining the medium-term trend.