Số liệu cho thấy dòng tiền ròng ETF 30 ngày vẫn âm đối với cả Bitcoin và Ethereum, cho thấy vốn đang chảy ra khỏi các tài sản kỹ thuật số.
Dòng Tiền Ròng ETF của Bitcoin & Ethereum Gần Đây Đã Âm
Như được giải thích bởi nhà phân tích cộng đồng CryptoQuant Maartunn trong một bài đăng mới trên X, các quỹ ETF spot Bitcoin và Ethereum đã phải đối mặt với dòng tiền ròng âm trong tháng qua.
ETF spot là các công cụ đầu tư cho phép nhà đầu tư tiếp cận gián tiếp với biến động giá của tài sản cơ bản. Trong bối cảnh tiền điện tử, điều này có nghĩa là một nhà đầu tư ETF không bao giờ phải tương tác trên chuỗi; quỹ sẽ mua và lưu ký các token thay mặt họ.
ETF spot của Mỹ là một hiện tượng tương đối mới trong lĩnh vực tài sản kỹ thuật số, chỉ được Ủy ban Chứng khoán và Giao dịch (SEC) chấp thuận vào tháng 1 năm 2024 cho Bitcoin và tháng 7 năm 2024 cho Ethereum.
ETF spot có vẻ như là một phương thức đầu tư tiện lợi cho những nhà giao dịch không quen thuộc với ví và sàn giao dịch tiền điện tử. Các thực thể tổ chức, đặc biệt, thích tiếp cận thông qua chúng.
Kể từ khi ra mắt, các công cụ đầu tư này nhanh chóng trở nên phổ biến bằng cách khai thác nhu cầu này từ các nhà đầu tư truyền thống và tự khẳng định mình là một trong những trụ cột của ngành.
Dưới đây là biểu đồ cho thấy dòng tiền ròng 30 ngày liên quan đến ETF spot Bitcoin và Ethereum đã thay đổi như thế nào trong suốt thời gian tồn tại của chúng cho đến nay.
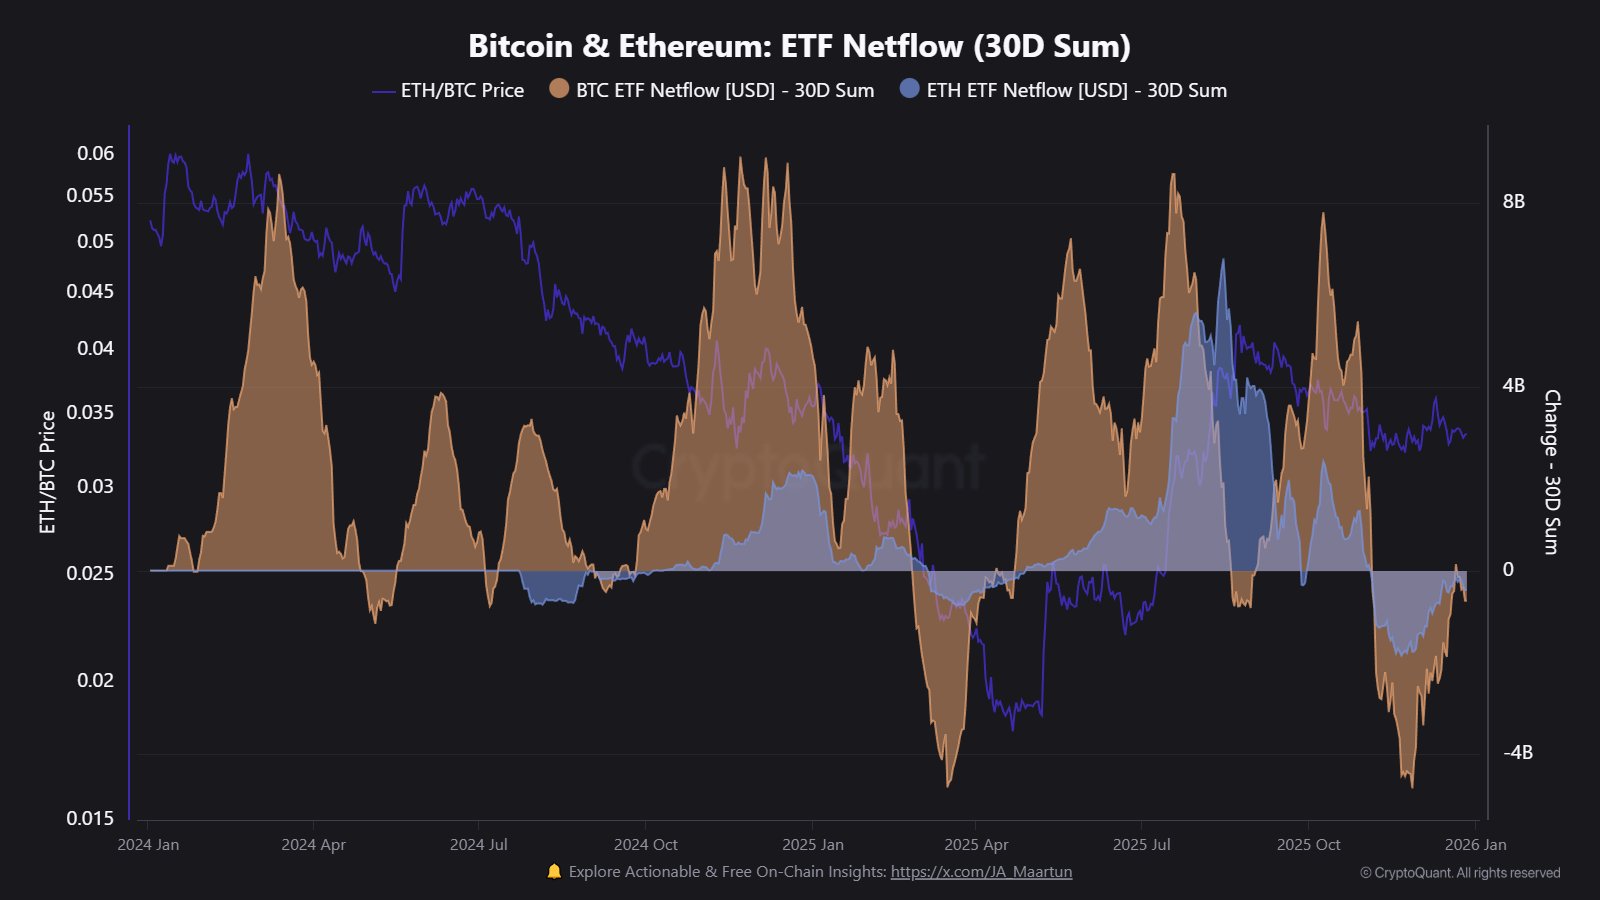
Có vẻ như giá trị của số liệu đã âm đối với cả hai tài sản này trong những tuần gần đây | Nguồn: @JA_Maartun trên X
Như có thể thấy trong biểu đồ, dòng tiền ròng ETF spot 30 ngày đã âm đối với cả Bitcoin và Ethereum từ một lúc nay, cho thấy các quỹ đã chứng kiến dòng tiền ra ròng liên tục.
Tình hình đã được cải thiện một chút gần đây nhất, nhưng chỉ báo vẫn còn màu đỏ cho cả hai tài sản, ở mức -656 triệu USD cho BTC và -422 triệu USD cho ETH. Nhu cầu yếu trên thị trường tương tự như giai đoạn dòng tiền ra từ nửa đầu năm 2025.
Hồi đó, nhu cầu cuối cùng đã quay trở lại một cách bùng nổ, với Bitcoin và Ethereum chứng kiến đà tăng giá mạnh. Giờ đây, vẫn còn phải xem liệu một sự trở lại sẽ xảy ra lần này hay sự chậm lại của nhu cầu sẽ còn ở lại trong lúc này.
Một nguồn cầu tương đối gần đây khác trên thị trường là kho bạc tài sản kỹ thuật số. Như được nêu bật bởi nhà cung cấp giải pháp DeFi tổ chức Sentora trong một bài đăng X mới, kho bạc tiền điện tử hiện vượt quá 185 tỷ USD trên 368 thực thể.
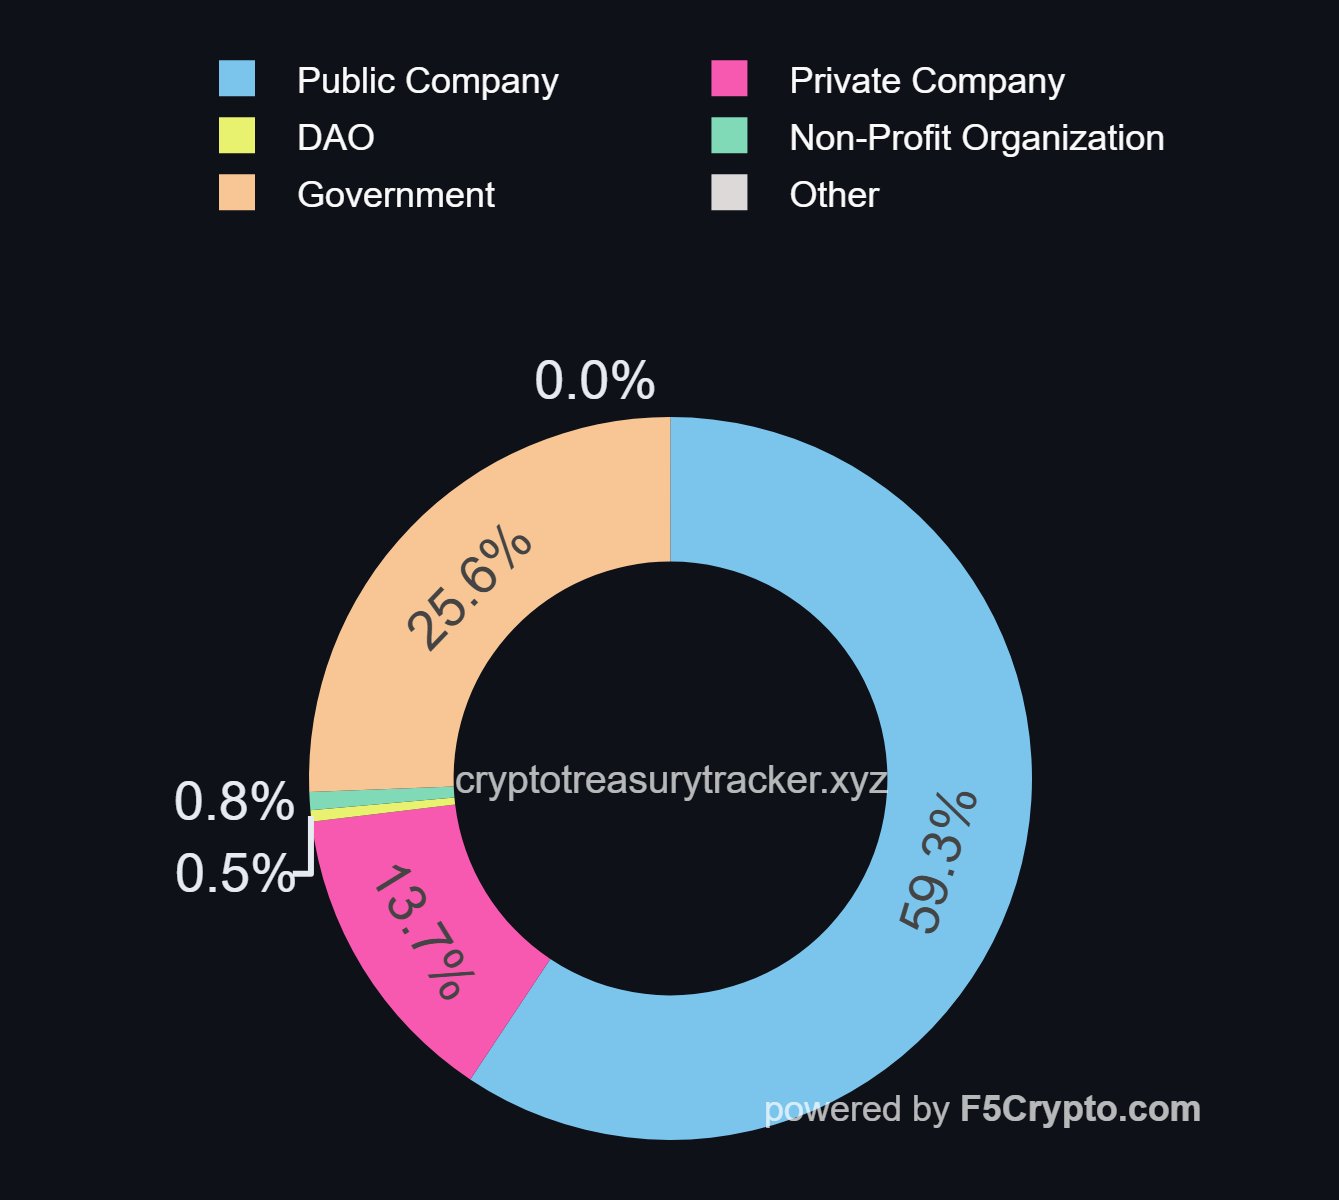
Sự phân bổ kho bạc trên các lĩnh vực khác nhau | Nguồn: Sentora trên X
Trong số này, 73% kho bạc tài sản kỹ thuật số được kiểm soát bởi các công ty, trong khi phần còn lại nằm trong tay các chính phủ.
Giá BTC
Vào thời điểm viết bài, Bitcoin đang giao dịch quanh mức 88.100 USD, không thay đổi so với tuần trước.

Giá của đồng coin dường như đã củng cố gần đây | Nguồn: BTCUSDT trên TradingView