La tendencia del mercado la semana pasada coincidió en general con las expectativas: Bitcoin mantuvo una oscilación débil cerca del riel inferior del canal alcista, y el patrón dominado por la tendencia bajista no cambió; mientras que HYPE completó la confirmación en la zona de soporte de 36~38 dólares, continuando con su lógica alcista independiente.
Este informe semanal, basado en lo anterior, desglosará aún más la estructura actual de la tendencia, actualizará las previsiones de mercado y los planes de operación, y revisará completamente la ejecución de operaciones de la semana pasada.
Resumen de las opiniones centrales de operación de esta semana:
• Previsión de mercado de HYPE esta semana y estrategia de operación a corto plazo. (Detalles en la primera parte)
• Análisis en profundidad de la estructura de tendencia actual de HYPE (nivel horario). (Detalles en la segunda parte)
• Previsión de mercado de BTC esta semana y estrategia de operación a medio y corto plazo. (Detalles en la tercera parte)
• Revisión de operaciones de BTC. (Detalles en la cuarta parte)
Verificación en el mercado de las opiniones centrales de la semana pasada:
• Resultados de la operación a corto plazo de HYPE: HYPE completó una operación de compra (larga) a corto plazo (apalancamiento 1x) la semana pasada, logrando un rendimiento de aproximadamente 5.25%. (Detalles en la Tabla 1)
• Resultados de la operación a corto plazo de BTC: Bitcoin completó una operación de venta (corta) a corto plazo (apalancamiento 1x) la semana pasada, logrando un rendimiento de aproximadamente 6.17%. (Detalles en la Tabla 2)
• Verificación de los resultados de la operación a medio plazo de BTC: Bitcoin siguió la estrategia a medio plazo establecida la semana pasada, manteniendo la posición corta abierta a 89,000 dólares (apalancamiento 1x). Al cierre de la semana pasada (aproximadamente 66,962 dólares), la ganancia era de aproximadamente 24.76%, con una ganancia máxima durante el período de aproximadamente 32.58%.
• Verificación en el mercado de la previsión de tendencia de BTC: En el artículo de la semana pasada indicamos claramente que el mercado mantendría un patrón de ajuste oscilante, observando la lucha entre alcistas y bajistas cerca del riel inferior del canal (formado desde el mínimo del 6 de febrero). La tendencia actual del mercado verifica el punto de vista que previamente prejuzgamos.

一、HYPE: Previsión de mercado y estrategia de operación a corto plazo
1、Previsión de la tendencia de HYPE esta semana: Consideramos que la estructura actual del mercado aún mantiene una tendencia alcista a nivel diario. Actualmente, el precio se encuentra en la etapa de retroceso y confirmación tras superar el punto máximo de la onda I (máximo del 3 de febrero, 38.41 dólares). Esta semana, prestaremos especial atención a la efectividad del soporte en la zona de 36~38 dólares. Si la confirmación del retroceso es efectiva, el mercado continuará con la tendencia alcista.
2、Estrategia de operación a corto plazo de HYPE esta semana:
• Basado en la previsión de la estructura alcista, se debe seguir el principio de "seguir la tendencia y comprar en las caídas".
• Utilizar el período de 30 minutos/60 minutos como ciclo operativo, cumpliendo estrictamente con la disciplina de stop-loss; utilizar el 30% del capital, basándose en los niveles de soporte y resistencia, para buscar oportunidades de hacer "diferencial de precios".
3、Advertencia de riesgo alcista de HYPE: Aunque la tendencia de HYPE es independiente, aún no puede separarse completamente del entorno general de Bitcoin. Si la tendencia de Bitcoin muestra un ajuste significativo posteriormente, podría afectar el impulso de recuperación de HYPE.
二、 HYPE: Revisión de operaciones a corto plazo y desglose de la estructura de tendencia
1、Revisión de operaciones a corto plazo de HYPE (apalancamiento 1x):(23.03~29.03)
Seguimos estrictamente el plan, combinado con las señales de operación capturadas por nuestro modelo de trading de diferencial de precios y modelo cuantitativo de momentum, ejecutamos una operación de compra (larga) a corto plazo en HYPE la semana pasada, obteniendo una ganancia del 5.25%.
• Resumen de detalles de la operación a corto plazo de HYPE:(Apalancamiento*1x)
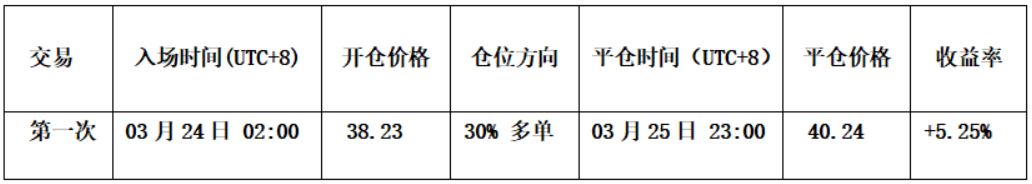
Tabla 1
• Decisión de apertura: La decisión de apertura (ver Figura 1) se basó en el cumplimiento de tres condiciones alcistas. Primero, prejuzgamos que era alta la probabilidad de que el ajuste horario anterior terminara cerca del punto final 34; segundo, el modelo cuantitativo de diferencial de precios activó una fuerte señal de fondo (punto rojo + punto blanco); tercero, el modelo cuantitativo de momentum emitió una señal de divergencia de fondo. En base a esto, ejecutamos la apertura de una posición larga con el 30% del capital a 38.23 dólares.
• Decisión de cierre: Basada en que el modelo cuantitativo de diferencial de precios activó una señal bajista de techo (punto blanco); el modelo de momentum emitió una señal de divergencia de techo; la combinación de velas emitió una señal de "patrón de techo fuerte". Estas tres señales formaron una resonancia técnica, por lo que ejecutamos la operación de liquidación alrededor de 40.24 dólares.
• Resumen de la operación: Esta operación obtuvo una ganancia de aproximadamente 5.25%.
Gráfico de velas de 60 minutos de HYPE (Modelo cuantitativo de momentum + Modelo de trading de diferencial de precios):
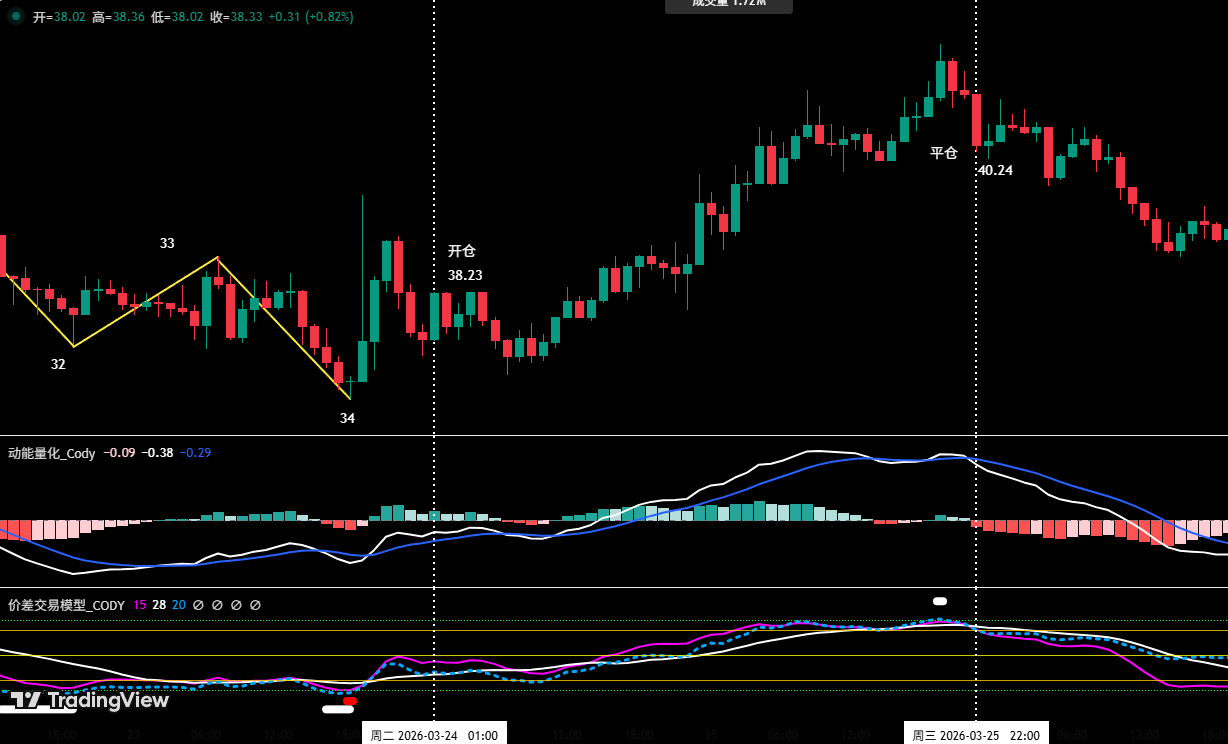
Figura 1 (Ilustración de operación a corto plazo)
2、Análisis en profundidad de la estructura de tendencia actual de HYPE (período de análisis de 1 hora)
• Como se muestra en (Figura 2), al revisar la tendencia a nivel horario de HYPE durante el período del 16 al 22, el precio construyó con éxito una central bajista (central C). Inicialmente prejuzgamos que el mercado podría formar un mínimo cerca del punto final 32 (aproximadamente 37.52 dólares), pero la tendencia real mostró que el mínimo apareció en un punto final 34 más bajo (aproximadamente 36.79 dólares), explorando aproximadamente 0.73 dólares más bajo de lo previsto.
• División de la estructura interna a nivel horario de HYPE la semana pasada:(23.03~29.03)
a、Como se muestra en (Figura 2), desde el punto final 34, la tendencia de HYPE la semana pasada evolucionó en una estructura compleja de oscilación compuesta por 8 segmentos: 34-35, 35-36, 36-37, 37-38, 38-39, 39-40, 40-41, 41-42. En el momento del análisis, el segmento 41-42 estaba en curso.
b、El segmento 34-35 constituye la estructura alcista.
c、Los 7 segmentos 35-36, 36-37, 37-38, 38-39, 39-40, 40-41, 41-42 constituyen la estructura de ajuste. Entre ellos, los 5 segmentos 36-37, 37-38, 38-39, 39-40, 40-41 se superponen mutuamente, construyendo juntos una central bajista (central D).
d、Actualmente, el mercado está ejecutando el segmento de salida (segmento 41-42). Como muestra (Figura 2), el segmento de salida ya ha formado una señal de divergencia de momentum en comparación con el segmento de entrada (segmento 35-36). Si la señal de divergencia persiste después de que finalice la ejecución del segmento de salida, es alta la probabilidad de que el precio se mueva al alza.
Gráfico de velas de 1 hora de HYPE:
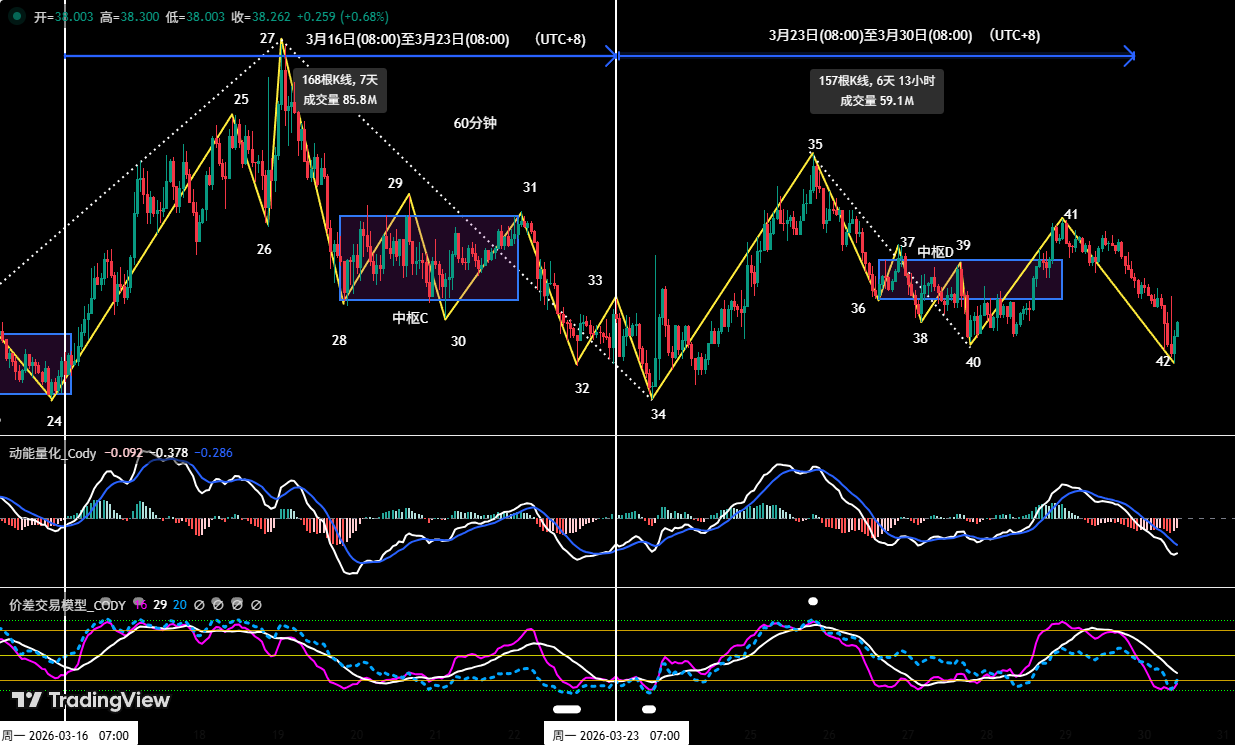
Figura 2
三、Bitcoin: Predicción de mercado esta semana y estrategia de operación
1、Análisis en profundidad de la estructura de tendencia actual de Bitcoin (período de análisis de 4 horas)
• Basado en el mercado posterior al mínimo del 6 de febrero (aproximadamente 60,000 dólares).
• Mantenemos el marco central de investigación anterior: En el análisis semanal del 16 de febrero indicamos claramente que la tendencia alcista de Bitcoin iniciada desde el mínimo del 6 de febrero, en naturaleza, pertenece a un rebote por sobreventa de la onda C-2 interna dentro del ajuste de la onda C de gran nivel, seguido por un行情 de ajuste de la onda C-3.
• Condición para la formación de la onda C-3: Si el precio de Bitcoin cae por debajo del mínimo del 6 de febrero (aproximadamente 60,000 dólares), se formará la onda de ajuste C-3.
• Interpretación del panorama actual de BTC: Como se muestra en (Figura 3), en el período de análisis de 4 horas, Bitcoin rompió efectivamente la línea de tendencia alcista a corto plazo formada desde el mínimo del 24 de febrero la semana pasada, y ha caído cerca del riel inferior del canal alcista formado desde el rebote del mínimo del 6 de febrero, oscilando en un rango estrecho alrededor de esta posición. Una vez que se pierda esta posición, es posible que el mercado posterior vuelva a probar el nivel de 60,000 dólares.
• Análisis en profundidad de la estructura de tendencia a nivel horario de BTC: Como se muestra en (Figura 3), en el período de análisis de 4 horas, Bitcoin inició una corrección desde el máximo de aproximadamente 76,000 dólares del 17 de marzo, evolucionando en una estructura de ajuste de 5 segmentos: 13-14, 14-15, 15-16, 16-17, 17-18. Entre ellos, los 3 segmentos 14-15, 15-16, 16-17 constituyen una central bajista (central B), y luego el segmento de salida (segmento 17-18) ha caído cerca del riel inferior del canal alcista. Actualmente, solo el modelo de trading de diferencial de precios ha activado una señal de alerta de fondo (punto blanco) en esta posición. Por lo tanto, el precio de la moneda muestra un patrón de oscilación débil en esta posición, utilizado para reparar el estado de sobreventa del indicador técnico a nivel de 4 horas.
Gráfico de velas de 4 horas de Bitcoin:
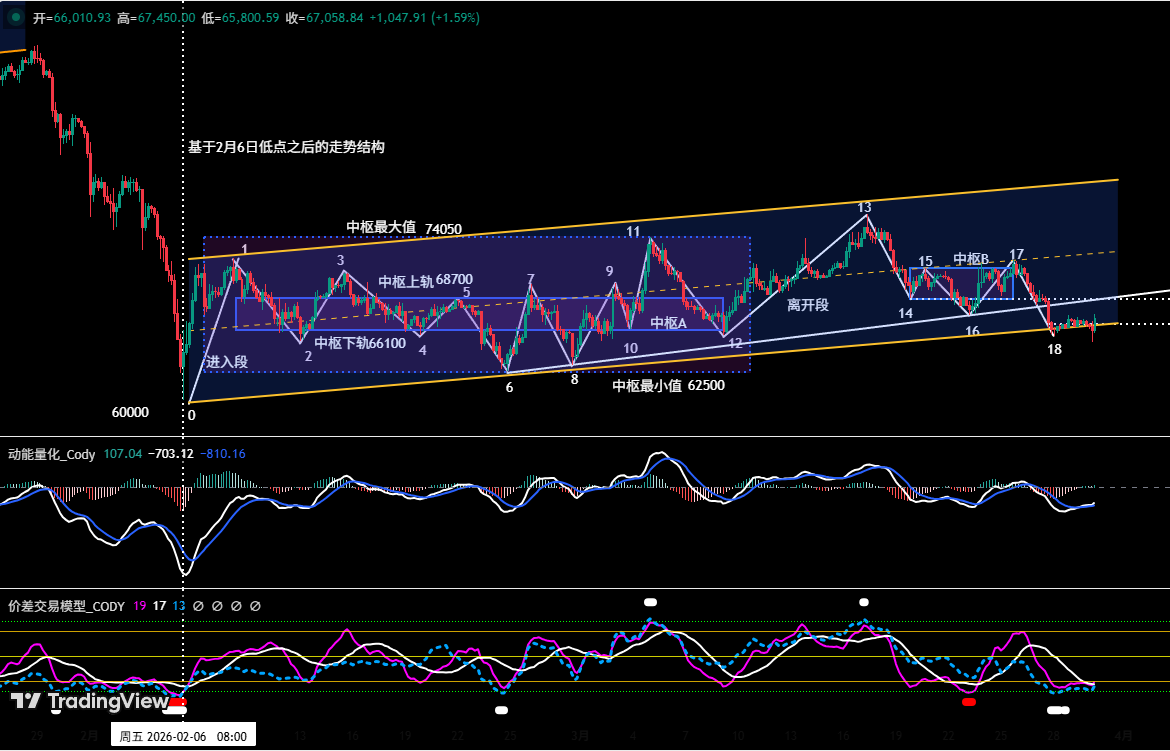
Figura 3
2、Opinión central de esta semana: Mantener el patrón de ajuste oscilante, observar la lucha entre alcistas y bajistas cerca del riel inferior del canal (desde el mínimo del 6 de febrero).
3、Niveles de resistencia central:
• Primera zona de resistencia: Región de 69,500~72,000 dólares (zona de oscilación anterior)
• Segunda zona de resistencia: Región de 74,500~76,000 dólares (cerca del mínimo de noviembre de 2025)
4、Niveles de soporte central:
• Primer soporte: Región de 65,000~66,000 dólares (zona de soporte importante anterior)
• Segundo soporte: Región de 60,000~62,500 dólares (cerca del mínimo del 6 de febrero)
• Tercer soporte: Aproximadamente 57,400 dólares
5、Estrategia de operación esta semana (excluyendo el impacto de noticias突发):(30.03~05.04)
1、Estrategia a medio plazo:
Gráfico diario de velas de Bitcoin: (Modelo de monitoreo de posiciones)
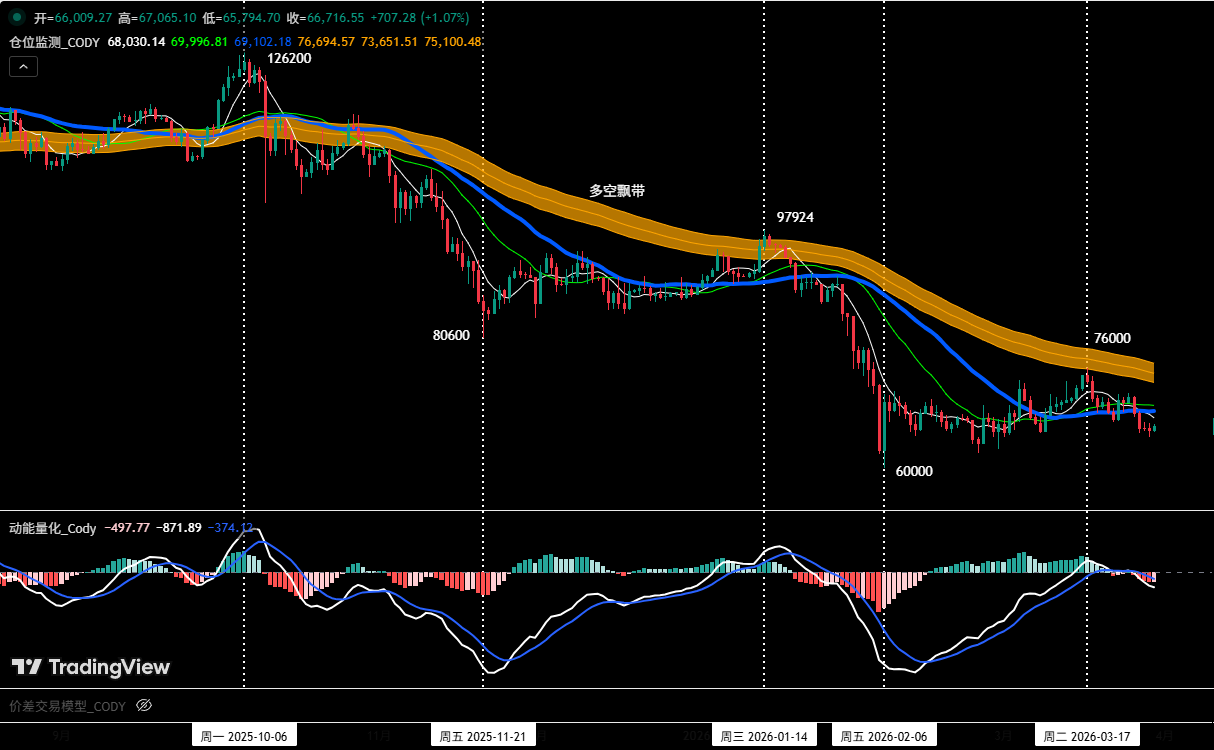
Figura 4
Modelo de monitoreo de posiciones: Como se muestra en (Figura 4), actualmente el precio de la moneda está por debajo de la cinta多空 (amarilla), continuando la tendencia bajista. Según las reglas de la estrategia, continuamos manteniendo la posición corta del 60% abierta a 89,000 dólares (28 de enero). Si el precio de la moneda rebota y rompe efectivamente la cinta多空 y se estabiliza por encima de ella, se liquidarán todas las posiciones a medio plazo.
2、Estrategia a corto plazo: Utilizar el 30% del capital, establecer puntos de stop-loss, basándose en los niveles de soporte y resistencia, para buscar oportunidades de hacer "diferencial de precios". (Utilizando un ciclo operativo de 30 minutos/60 minutos).
3、Basado en la previsión de la tendencia bajista a medio plazo del mercado, actualmente se debe insistir en el principio operativo de "operar en corto siguiendo la tendencia". Para responder dinámicamente a la evolución compleja del mercado y combinado con las señales emitidas por nuestro modelo de trading propio, prepararemos dos planes de operación a corto plazo A/B:
• Plan A:El rebote encuentra resistencia, vender en corto en los picos.
• Apertura: Cuando el precio de la moneda rebote a la región de 69,500~72,000 dólares y active una señal de encuentro de resistencia combinada con una señal de techo del modelo, se puede establecer una posición corta del 30%.
• Control de riesgo: El stop-loss inicial para las posiciones cortas se establece por encima de 74,500 dólares.
• Cierre: Cuando el precio de la moneda caiga cerca de un nivel de soporte importante y se combine con señales del modelo, se puede liquidar gradualmente para obtener ganancias.
• Plan B: Posición corta por ruptura顺势.
• Apertura: Cuando el precio de la moneda rompa efectivamente la región de 65,000~66,000 dólares, y se combine con una señal de techo del modelo, se puede establecer顺势 una posición corta del 30%.
• Control de riesgo: El stop-loss inicial para las posiciones cortas se establece por encima de 67,500 dólares.
• Cierre: Cuando caiga a un nivel de soporte y se combine con señales del modelo, se puede liquidar gradualmente para obtener ganancias.
四、Bitcoin: Revisión de operaciones
1、Revisión de operaciones a corto plazo:(Ver Tabla 2)
Seguimos estrictamente el plan de operación, basándonos en las señales de operación emitidas por nuestro propio modelo de trading de diferencial de precios y modelo cuantitativo de momentum, completamos una operación de venta (corta) a corto plazo la semana pasada, obteniendo una ganancia del 6.17%.
1、Resumen de detalles de la operación a corto plazo de Bitcoin:(Apalancamiento*1x)
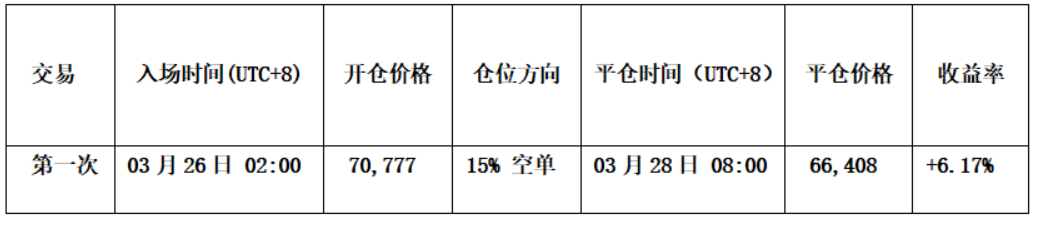
Tabla 2
2、Revisión de la operación a corto plazo:(Ver Figura 5)
• Apertura: Cuando el precio de la moneda rebotó cerca de 72,000 dólares y encontró resistencia, el modelo de trading de diferencial de precios activó同步 una señal de alerta de techo (punto blanco), formando una resonancia de venta en corto con el modelo cuantitativo de momentum. Basado en esta superposición de señales, establecimos una posición corta del 15% a 70,777 dólares.
• Cierre: Cuando el precio de la moneda cayó cerca de 65,000 dólares y se estabilizó,同时 el modelo de trading de diferencial de precios activó una fuerte señal de alerta de fondo (punto rojo + punto blanco), por lo que liquidamos todas las posiciones alrededor de 66,408 dólares.
• Resumen: Esta operación obtuvo una ganancia de aproximadamente 6.17%.
Gráfico de velas de 60 minutos de Bitcoin: (Modelo cuantitativo de momentum + Modelo de trading de diferencial de precios)
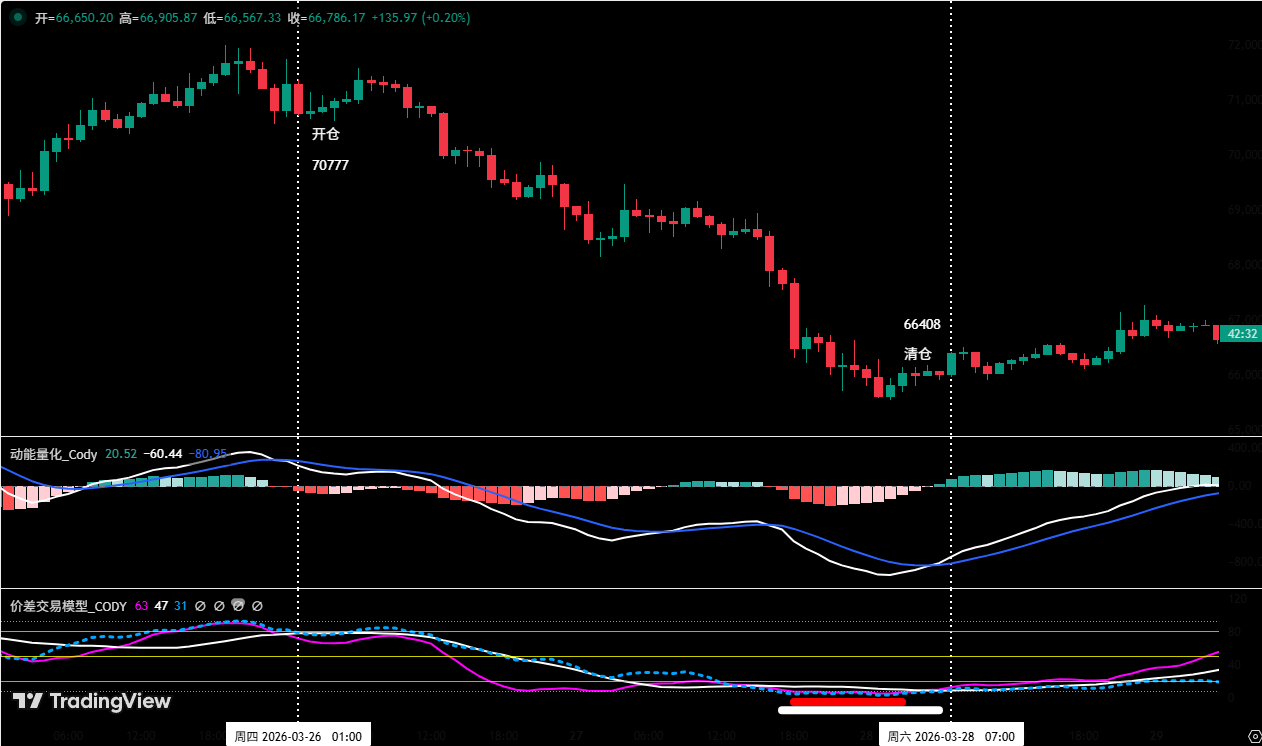
Figura 5 (Ilustración de operación a corto plazo)
2、 Revisión de operaciones a medio plazo:
Estrategia a medio plazo: Continuamos manteniendo la posición corta del 60% abierta alrededor de 89,000 dólares (28 de enero). Al cierre de la semana pasada (precio de cierre aproximadamente 66,962 dólares), la ganancia era de aproximadamente 24.76%.
五、Aviso especial:
1. Al abrir la posición: Establecer inmediatamente el stop-loss inicial.
2. Cuando la ganancia alcance el 1%: Mover el stop-loss al precio de costo de apertura (punto de equilibrio), garantizando la seguridad del capital principal.
3. Cuando la ganancia alcance el 2%: Mover el stop-loss a la posición del 1% de ganancia.
4. Seguimiento continuo: A partir de entonces, por cada 1% adicional de ganancia del precio de la moneda, el stop-loss se mueve同步mente 1%, protegiendo dinámicamente y bloqueando las ganancias.
Los mercados financieros cambian rápidamente, todo análisis de mercado y estrategias de operación necesitan ajustes dinámicos. Todos los puntos de vista, modelos de análisis y estrategias de operación involucrados en este artículo provienen del análisis técnico personal y son solo para uso como registro de operaciones personales, no constituyen ninguna recomendación de inversión o base para operaciones. El mercado tiene riesgos, la inversión requiere precaución, no tome decisiones basándose en esto.