ARK Invest founder Cathie Wood ("Wood Sister") released a macro outlook in her latest New Year's letter to investors for 2026, likening the next three years to "Reaganomics on steroids." She pointed out that with the convergence of deregulation, tax cuts, sound monetary policy, and innovative technology, the U.S. stock market is set to usher in another "golden age," while an impending surge in the U.S. dollar could put an end to gold's upward momentum.
Specifically, Cathie Wood believes that despite continuous real GDP growth over the past three years, the underlying U.S. economy has actually experienced a rolling recession and is currently in a "coiled spring" state, poised for a strong rebound in the coming years. She particularly emphasized that with David Sacks appointed as the first AI and Cryptocurrency Czar to lead deregulation, and the effective corporate tax rate moving towards 10%, U.S. economic growth will receive a significant policy dividend.
At the macro level, Wood predicts that inflation will be further controlled, possibly even turning negative, driven by a productivity boom. She expects the U.S. nominal GDP growth rate to remain in the range of 6% to 8% in the coming years, primarily driven by productivity gains rather than inflation.
In terms of market impact, Wood predicts that the relative advantage of U.S. investment returns will drive the dollar exchange rate significantly higher, replaying the nearly doubling of the dollar in the 1980s. She warned that although gold prices have risen substantially in recent years, the strengthening dollar will suppress gold prices, while Bitcoin, due to its supply mechanism and low asset correlation, will show a different trend from gold.
Regarding investor concerns about market valuation, Wood does not believe an AI bubble has formed. She pointed out that although price-to-earnings ratios are at historically high levels, as AI, robotics, and other technologies drive a productivity explosion, corporate profit growth will digest high valuations, and the market may achieve positive returns while compressing P/E ratios, similar to the bull market path of the mid-to-late 1990s.
Below is the original text of the letter to investors:
Happy New Year to ARK's investors and other supporters! We are very grateful for your support.
As I elaborate in this letter, we truly believe there are many reasons for investors to be optimistic! I hope you enjoy our discussion. From the perspective of economic history, we are at a pivotal moment.
Coiled Spring
Although U.S. real Gross Domestic Product (GDP) has continued to grow over the past three years, the underlying structure of the U.S. economy has experienced a rolling recession and has gradually become a spring compressed to its limit, likely to rebound strongly in the coming years. In response to supply shocks related to the COVID-19 pandemic, the Federal Reserve raised the federal funds rate from 0.25% in March 2022 to 5.5% by July 2023 over a 16-month period, a record increase of 22 times. This rate hike pushed housing, manufacturing, non-AI-related capital expenditures, and the U.S. middle- and low-income groups into a recession, as shown in the chart below.
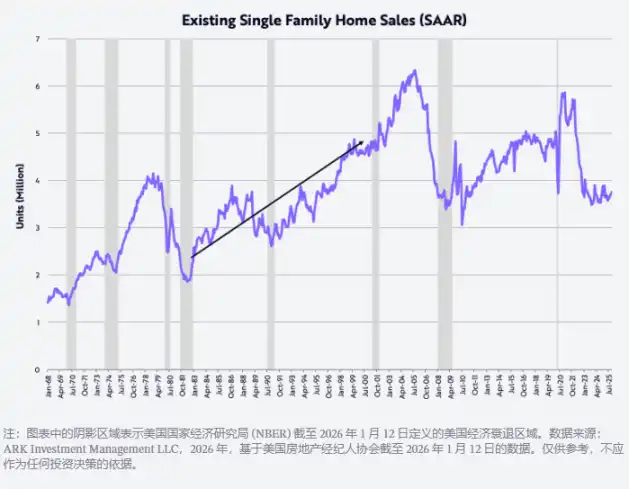
Measured by existing home sales, the housing market declined by 40% from an annualized rate of 5.9 million units in January 2021 to 3.5 million units in October 2023. This level was last seen in November 2010, and over the past two years, existing home sales have fluctuated around this level. This indicates how tightly the spring is compressed: the current level of existing home sales is comparable to the early 1980s, when the U.S. population was about 35% smaller than it is now.
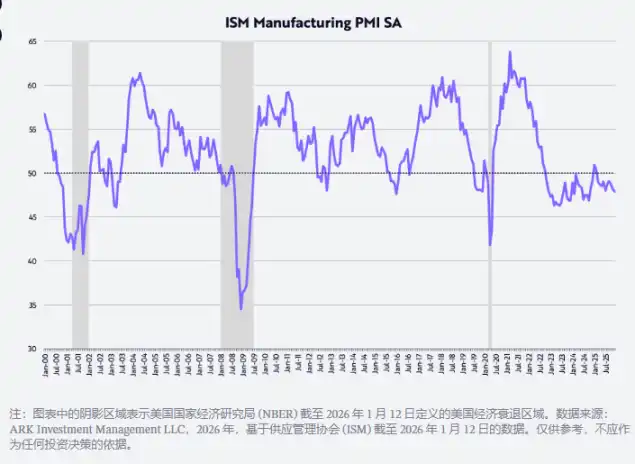
Measured by the U.S. Purchasing Managers' Index (PMI), manufacturing has been in contraction for about three years. According to this diffusion index, 50 is the dividing line between expansion and contraction, as shown below.
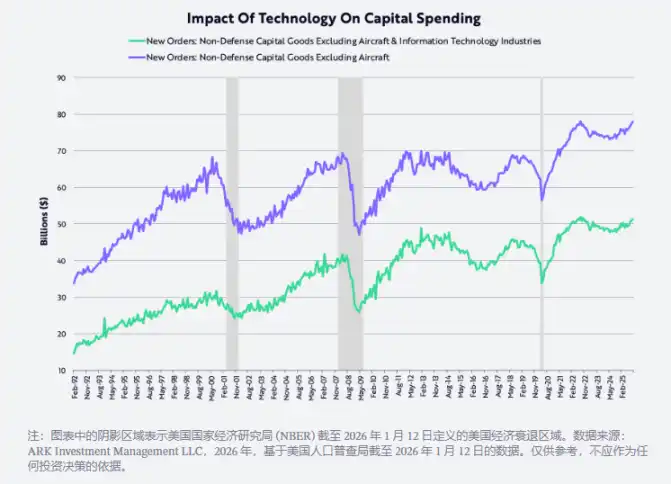
Meanwhile, capital expenditures measured by non-defense capital goods (excluding aircraft) peaked in mid-2022 and have since recovered to that level, whether affected by technology or not. In fact, this capital expenditure indicator struggled for more than 20 years to break through after the tech and telecom bubble burst, until 2021, when COVID-19-related supply shocks forced both digital and physical investment to accelerate. The former spending cap seems to have turned into a spending floor, as AI, robotics, energy storage, blockchain technology, and multi-omics sequencing are ready to enter their golden age. Following the tech and telecom bubble of the 1990s, a peak expenditure of about $70 billion persisted for 20 years; now, as the following chart shows, this could be the strongest capital expenditure cycle in history. We believe an AI bubble is still a long way off!
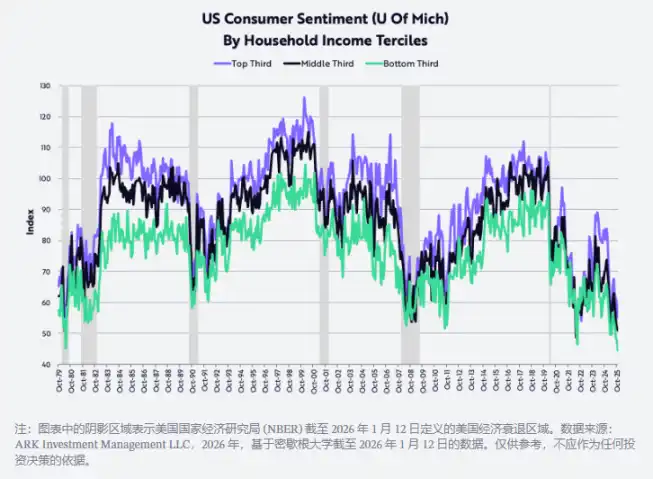
At the same time, data from the University of Michigan shows that confidence among middle- and low-income groups has fallen to its lowest level since the early 1980s. Back then, double-digit inflation and high interest rates severely eroded purchasing power and pushed the U.S. economy into consecutive recessions. Moreover, as shown below, confidence among high-income groups has also declined in recent months. In our view, consumer confidence is currently one of the most tightly compressed "springs" with the greatest rebound potential.
Deregulation, Coupled with Lower Taxes, Inflation, and Interest Rates
Thanks to the combined effects of deregulation, lower taxes (including tariffs), inflation, and interest rates, the rolling recession experienced by the U.S. in recent years could reverse rapidly and dramatically in the coming year and beyond.
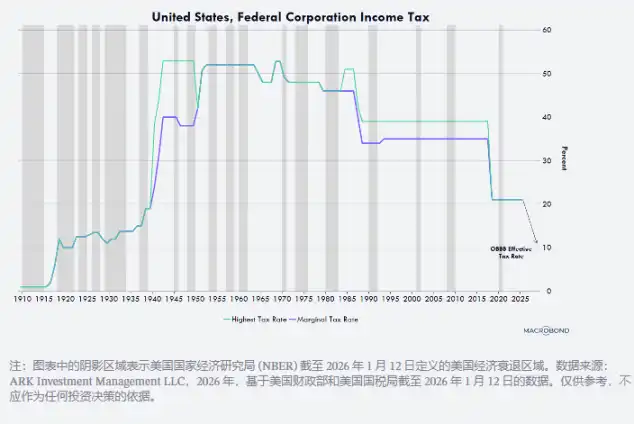
Deregulation is unleashing innovative vitality across various fields, particularly in artificial intelligence and digital assets, led by the first "AI and Cryptocurrency Czar," David Sacks. Meanwhile, reductions in tip, overtime, and social security taxes will provide U.S. consumers with substantial tax refunds this quarter, potentially boosting the annualized growth rate of real disposable income from about 2% in the second half of 2025 to about 8.3% this quarter. Additionally, with accelerated depreciation for manufacturing facilities, equipment, software, and domestic R&D expenditures, the effective corporate tax rate will be pushed down to near 10% (as shown below), corporate tax refunds are expected to rise significantly, and 10% is one of the lowest tax rates globally.
For example, any company that begins construction on a manufacturing plant in the U.S. by the end of 2028 can fully depreciate the building in the first year it is placed in service, instead of over 30 to 40 years as in the past. Equipment, software, and domestic R&D expenditures can also be 100% depreciated in the first year. This cash flow incentive was made permanent in last year's budget bill and is retroactive to January 1, 2025.
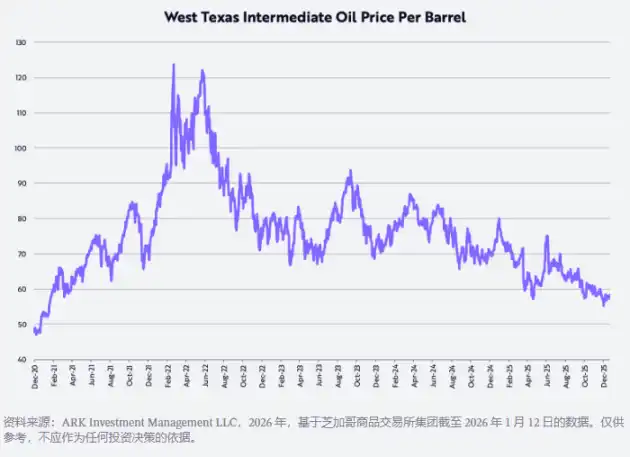
Over the past few years, inflation as measured by the Consumer Price Index (CPI) has stubbornly hovered in the 2% to 3% range, but in the coming years, for several reasons shown below, the inflation rate is likely to fall to a surprisingly low level—possibly even negative. First, West Texas Intermediate (WTI) crude oil prices have fallen by about 53% since the post-COVID peak of about $124 per barrel on March 8, 2022, and are currently down about 22% year-over-year.
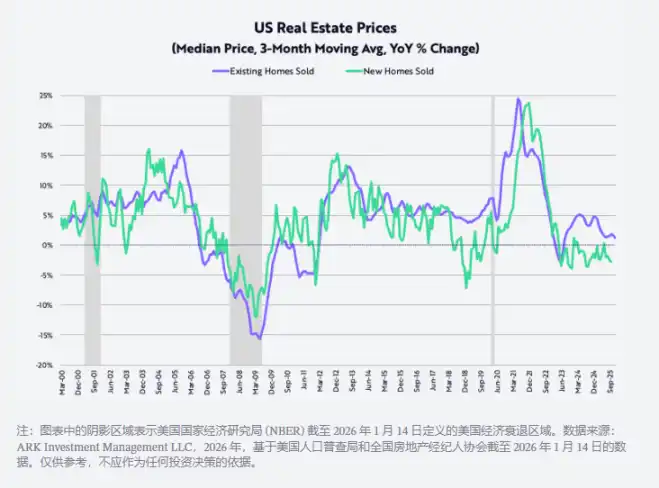
Since peaking in October 2022, the sales price of new single-family homes has fallen by about 15%; meanwhile, the inflation rate for existing single-family home prices—based on a three-month moving average—has dropped from about 24% year-over-year at the post-COVID peak in June 2021 to about 1.3%, as shown below.
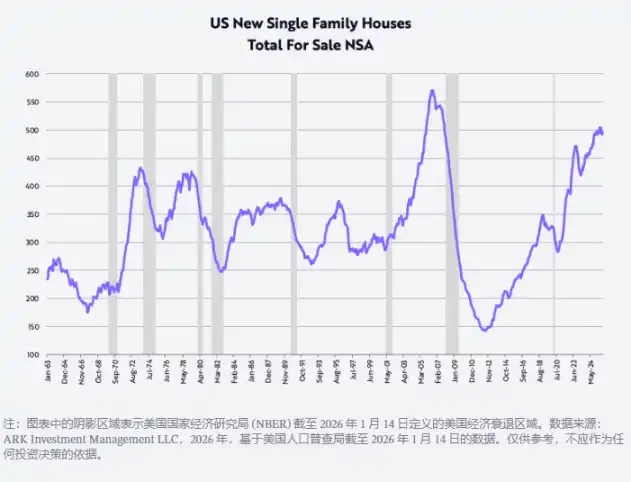
In the fourth quarter, to digest the inventory of nearly 500,000 new single-family homes (the highest level since October 2007, just before the global financial crisis, as shown below), the major homebuilders significantly reduced prices, with year-over-year declines of: Lennar -10%, KBHomes -7%, and DRHorton -3%. The impact of these price declines will be reflected in the Consumer Price Index (CPI) with a lag over the coming years.
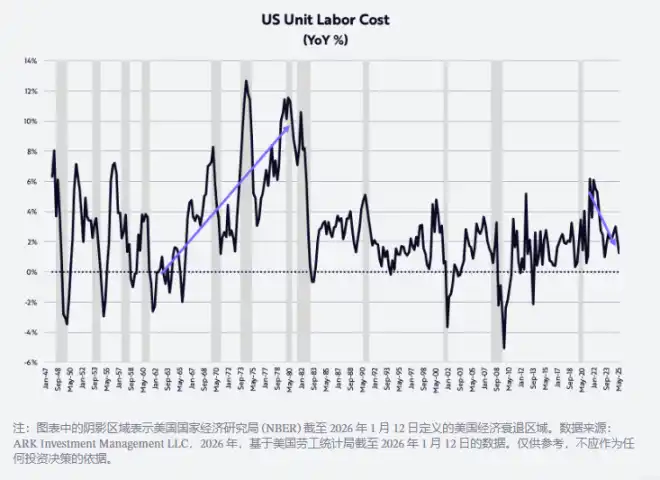
Finally, nonfarm productivity, one of the most powerful forces curbing inflation, grew against the trend in the context of a continuous recession, increasing 1.9% year-over-year in the third quarter. In contrast to a 3.2% increase in compensation per hour worked, the rise in productivity has reduced unit labor cost inflation to 1.2%, as shown below. There is no sign of 1970s-style cost-push inflation in this number!
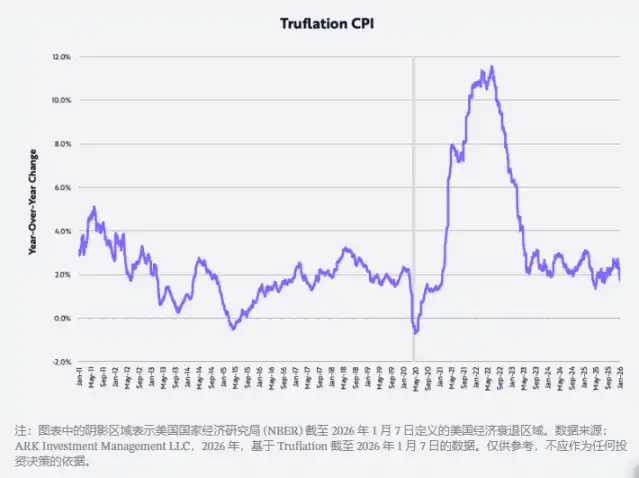
This improvement is also validated: the inflation rate measured by Truflation has recently fallen to 1.7% year-over-year, as shown below, nearly 100 basis points (bps) lower than the inflation rate calculated by the Bureau of Labor Statistics (BLS) based on CPI.
Productivity Boom
Indeed, if our research on technology-driven disruptive innovation is correct, then in the coming years, nonfarm productivity growth should accelerate to 4-6% per year, driven by both cyclical and long-term factors, further reducing unit labor cost inflation. The convergence of the major innovation platforms currently developing—artificial intelligence, robotics, energy storage, public blockchain technology, and multi-omics—is expected not only to drive productivity growth to sustainably new highs but also to create enormous wealth.
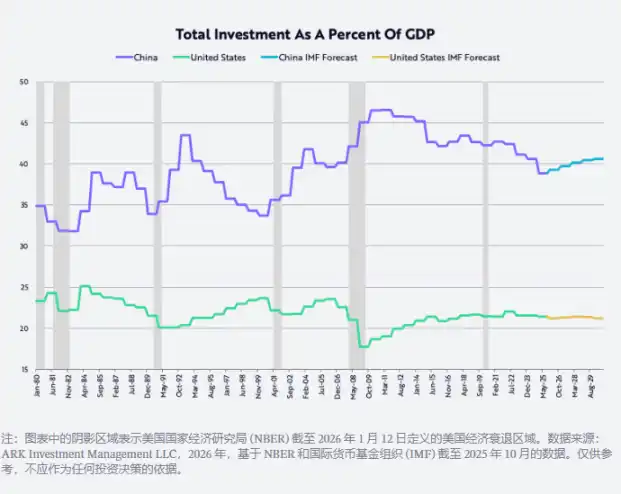
Productivity gains could also correct significant geo-economic imbalances in the global economy. Companies can direct the benefits of productivity gains to one or more of the following four strategic directions: expanding profit margins, increasing R&D and other investments, raising wages, and/or lowering prices. In China, raising wages for more productive employees and/or increasing profit margins could help the economy break free from its structural problem of overinvestment. Since joining the World Trade Organization (WTO) in 2001, China's investment as a percentage of GDP has averaged about 40%, nearly double that of the U.S., as shown below. Raising wages would shift the Chinese economy toward a consumption-oriented model, moving away from a commoditized path.
However, in the short term, technology-driven productivity gains may continue to slow U.S. job growth, pushing the unemployment rate from 4.4% to above 5.0% and prompting the Federal Reserve to continue cutting interest rates. Subsequently, deregulation and other fiscal stimulus measures should amplify the impact of low interest rates and accelerate GDP growth in the second half of 2026. Meanwhile, inflation is likely to continue to slow, not only due to falling oil prices, housing prices, and tariffs but also thanks to technological advancements that boost productivity and reduce unit labor costs.
Surprisingly, AI training costs are falling by 75% annually, while AI inference costs (i.e., the cost of running AI application models) are falling by up to 99% annually (according to some benchmarks). These unprecedented declines in the cost of various technologies should drive a surge in their unit growth. Therefore, we expect the U.S. nominal GDP growth rate to remain in the range of 6% to 8% in the coming years, primarily driven by productivity growth of 5% to 7%, labor force growth of 1%, and an inflation rate of -2% to +1%.
The cumulative deflationary effects of AI and the other four major innovation platforms will shape an economic environment similar to the last major technological revolution period from 1879 to 1929, triggered by the internal combustion engine, electricity, and the telephone. During that period, short-term interest rates moved in sync with nominal GDP growth, while long-term rates responded to the deflationary undercurrents accompanying the technology boom, causing the yield curve to invert by an average of about 100 basis points, as shown below.

Other New Year Thoughts
Gold Price Rise vs. Bitcoin Price Fall
During 2025, the price of gold rose by 65%, while the price of Bitcoin fell by 6%. Many observers attributed the surge in gold prices from $1,600 per ounce in October 2022, at the end of the U.S. stock market bear market, to $4,300, a gain of 166%, to inflation risks. However, another explanation is that global wealth growth (exemplified by the 93% rise in the MSCI World Equity Index) has exceeded the annualized growth rate of global gold supply of about 1.8%. In other words, the incremental demand for gold may have exceeded its supply growth. Interestingly, during the same period, the price of Bitcoin rose by 360%, while its supply grew at an annualized rate of only about 1.3%. It is worth noting that gold and Bitcoin miners may react very differently to these price signals: gold miners respond by increasing gold production, while Bitcoin cannot do this. Mathematically, Bitcoin will grow by about 0.82% annually over the next two years, after which its growth rate will slow to about 0.41% per year.
A Long-Term Perspective on Gold Prices
Measured by the ratio of market capitalization to M2 money supply, the price of gold has only been higher than this level once in the past 125 years, during the Great Depression of the early 1930s. At that time, the gold price was fixed at $20.67 per ounce, while the M2 money supply plummeted by about 30% (as shown below). Recently, the gold-to-M2 ratio has exceeded the previous peak, which occurred in 1980 when inflation and interest rates soared into double digits. In other words, from a historical perspective, the price of gold has reached an extremely high level.
The chart below also shows that the long-term decline in this ratio has been closely related to solid stock market returns. According to research by Ibbotson and Sinquefield, stocks have had a compound annual return of about 10% since 1926. After the ratio reached two major long-term peaks in 1934 and 1980, stock prices as measured by the Dow Jones Industrial Average (DJIA) achieved returns of 670% and 1015% over the 35 and 21 years ending in 1969 and 2001, respectively, representing annualized returns of 6% and 12%. Notably, small-cap stocks had annualized returns of 12% and 13%, respectively.

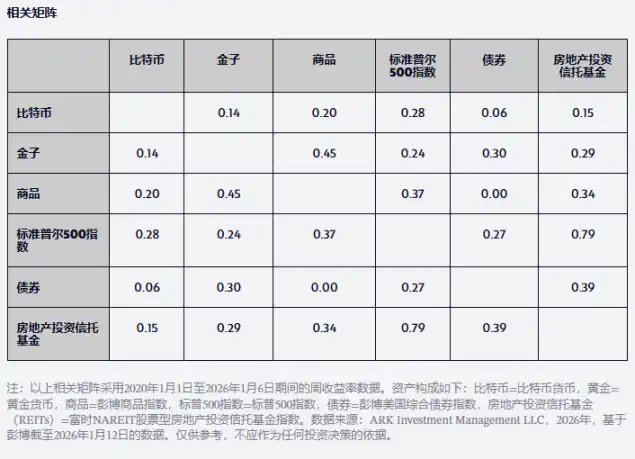
For asset allocators, another important consideration is Bitcoin's relatively low correlation with gold returns and with other major asset classes since 2020, as shown in the table below. Notably, Bitcoin's correlation with gold is even lower than the correlation between the S&P 500 and bonds. In other words, for asset allocators seeking higher risk-adjusted returns in the coming years, Bitcoin should be a good diversification option.
U.S. Dollar Outlook
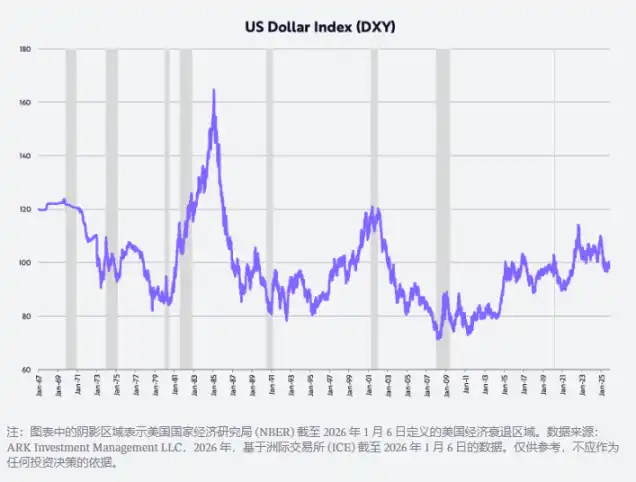
Over the past few years, a popular narrative has been the end of American exceptionalism, with the dollar recording its largest first-half decline since 1973 and its largest full-year decline since 2017. Last year, as measured by the trade-weighted dollar index (DXY), the dollar fell 11% in the first half and 9% for the full year. If our predictions about fiscal policy, monetary policy, deregulation, and U.S.-led technological breakthroughs are correct, then U.S. investment returns will improve relative to the rest of the world, pushing the dollar exchange rate higher. The Trump administration's policies mirror the situation during the Reaganomics era of the early 1980s, when the dollar exchange rate nearly doubled, as shown below.
AI Hype
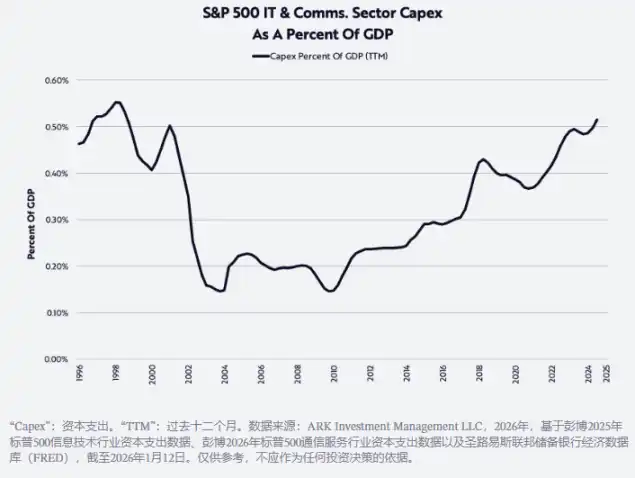
As shown below, the AI boom is driving capital expenditures to their highest levels since the late 1990s. In 2025, investment in data center systems (including computing, networking, and storage equipment) grew by 47% to nearly $500 billion, and is expected to grow another 20% in 2026 to about $600 billion, far above the long-term trend of $150-200 billion annually in the launch of ChatGPT a decade ago. Such massive investment规模 inevitably raises the question: "What is the return on this investment? And where will it be reflected?"
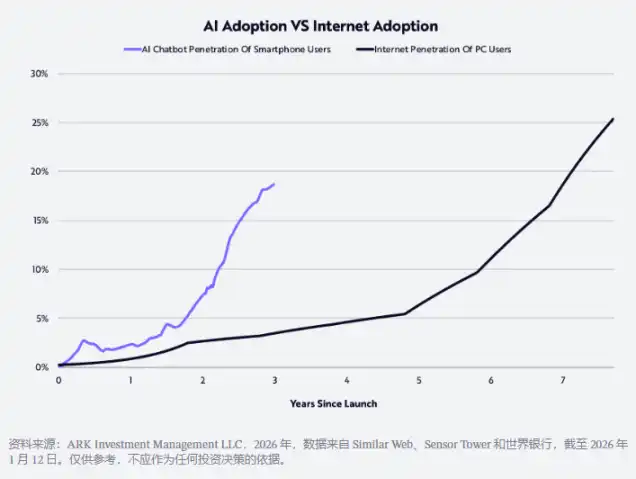
Beyond semiconductors and listed large cloud companies, unlisted AI-native companies are also benefiting from growth and investment returns. AI companies are among the fastest-growing businesses in history. Our research shows that consumer adoption of AI is twice as fast as the adoption of the internet in the 1990s, as shown below.
It is reported that by the end of 2025, OpenAI and Anthropic's annualized revenue will reach $20 billion and $9 billion, respectively, up 12.5 times and 90 times from $1.6 billion and $100 million a year earlier! Rumors suggest that both companies are considering initial public offerings (IPOs) in the next year or two to raise funds for the massive investments required to support their product models.
As Fidji Simo, CEO of OpenAI's applied division, said: "The capabilities of AI models far exceed what most people experience in their daily lives, and 2026 is the year to bridge this gap. The leaders in AI will be those who can translate cutting-edge research into products that are truly useful for individuals, businesses, and developers." This year, with more humane, intuitive, and integrated user experiences, we expect to make substantial progress in this area. ChatGPT Health is an early example, a dedicated section within the ChatGPT platform that helps users improve their health based on their personal health data.
In enterprises, many AI applications are still in their early stages, hindered by bureaucracy, inertia, and/or prerequisites such as restructuring and building data infrastructure, leading to slow progress. By 2026, organizations may realize that they need to use their own data to train models and iterate quickly, or risk being left behind by more aggressive competitors. AI-driven use cases should provide immediate and excellent customer service, faster product launch speeds, and help startups create more value with fewer resources.
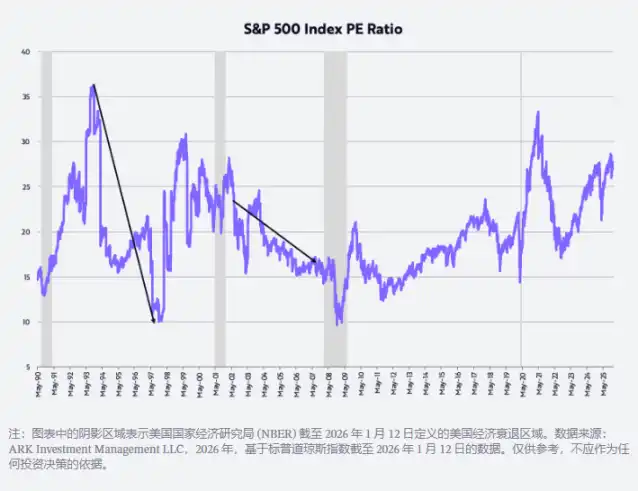
Overvalued Market
Many investors are concerned about overvalued stock markets, which are currently at historically high levels, as shown below. Our own valuation assumption is that the price-to-earnings (P/E) ratio will fall back to around 20 times, the average of the past 35 years. Some of the most significant bull markets have occurred alongside P/E compression. For example, from mid-October 1993 to mid-November 1997, the S&P 500 had an annualized return of 21%, while its P/E ratio fell from 36 times to 10 times. Similarly, from July 2002 to October 2007, the S&P 500 had an annualized return of 14%, while its P/E ratio fell from 21 times to 17 times. Given our expectations that real GDP growth will be driven by productivity gains and slowing inflation, the same dynamics should reappear in this market cycle, possibly even more significantly.
As always, many thanks to ARK's investors and other supporters, and also to Dan, Will, Katie, and Keith for helping me write this very long New Year's greeting!


