Author: Anthropic
Compiled by: Deep Tide TechFlow
Deep Tide Guide: This is the first time an AI company has conducted a large-scale survey on users' real economic anxieties. The data reveals a cruel paradox: programmers, designers, and others who are best at using AI are precisely the ones most worried about being replaced by AI; those who improve efficiency the fastest feel the least secure about the future. For investors, this means AI's penetration rate is faster than imagined, and its impact on the job market has already begun on a psychological level.
Key Findings:
Our recent survey of 81,000 Claude users shows that people in jobs more easily replaceable by AI are more concerned about AI-induced unemployment. This is especially true for respondents in the early stages of their careers.
The occupations with the highest and lowest incomes reported the greatest productivity gains, primarily from an expansion of work scope (doing new tasks).
Respondents who experienced the greatest speed increases from AI were反而 more concerned about unemployment.
To help the public understand the AI economic changes we observe, our economic index shares what Claude is being asked to do and in which jobs Claude completes the largest proportion of tasks. But until now, we lacked information on how these usage patterns map to people's thoughts and impressions about AI.
Our recent survey research of 81,000 Claude users provides a way to connect people's economic concerns with what we quantify in Claude's traffic.
The survey asked about people's visions and fears regarding AI progress. Many shared ideas involving economic topics. We learned that many people worry about unemployment—even though they also feel more productive and capable. In some cases, AI enabled them to start a business or gave them time for more important matters; in other cases, AI felt oppressive or was imposed by their employer.
The survey results provide preliminary evidence that observed exposure (our metric for AI replacement risk) correlates with economic concerns surrounding AI. People in occupations with high exposure—defined by the tasks Claude is observed performing—are more anxious about economic replacement. This aligns with a general awareness of AI's proliferation and potential impact. We elaborate on our findings below.
Who is Worried About Job Loss?
"Like all white-collar workers now, I'm 100% worried, almost 24/7, that I'll eventually be replaced by AI." — A Software Engineer.
One-fifth of the respondents in our survey expressed concern about economic replacement. Some worried about this abstractly: a software developer warned of "the possibility of AI in its current state being used to replace junior positions." Others lamented that their job, or aspects of it, was being automated away. A market researcher said, "In terms of improving my capabilities, no doubt. But in the future, AI might replace my job." In some jobs, people felt AI made their work harder. A software developer observed that "when AI arrived, project managers started giving me increasingly difficult tickets and bugs to solve."
Throughout this report, we use Claude-powered classifiers to infer attributes and sentiments from respondents' answers. For example, many participants incidentally mentioned their field of work or provided detailed information about their work life, allowing us to infer their occupation. Similarly, we quantified concern about unemployment by prompting Claude to identify and interpret direct quotes where respondents indicated their role was at risk of AI-driven replacement. We provide example prompts in the appendix.
Respondents' perceived AI threat correlated with our own observed exposure metric, which reflects the percentage of tasks in a job where Claude is used. Respondents expressed greater concern about AI when this observed exposure metric was higher for their occupation. For instance, elementary school teachers worried less about being replaced than software engineers, consistent with Claude's usage being biased towards coding tasks.
We show this in Figure 1 below. The y-axis is the percentage of respondents in a given occupation who indicated that AI has or could soon replace their role. The x-axis is the observed exposure. The chart shows that, on average, people in occupations with higher exposure tend to express more concern about job automation. A 10 percentage point increase in exposure is associated with a 1.3 percentage point increase in perceived job threat. The top 25% by exposure mentioned this concern three times as often as the bottom 25%.
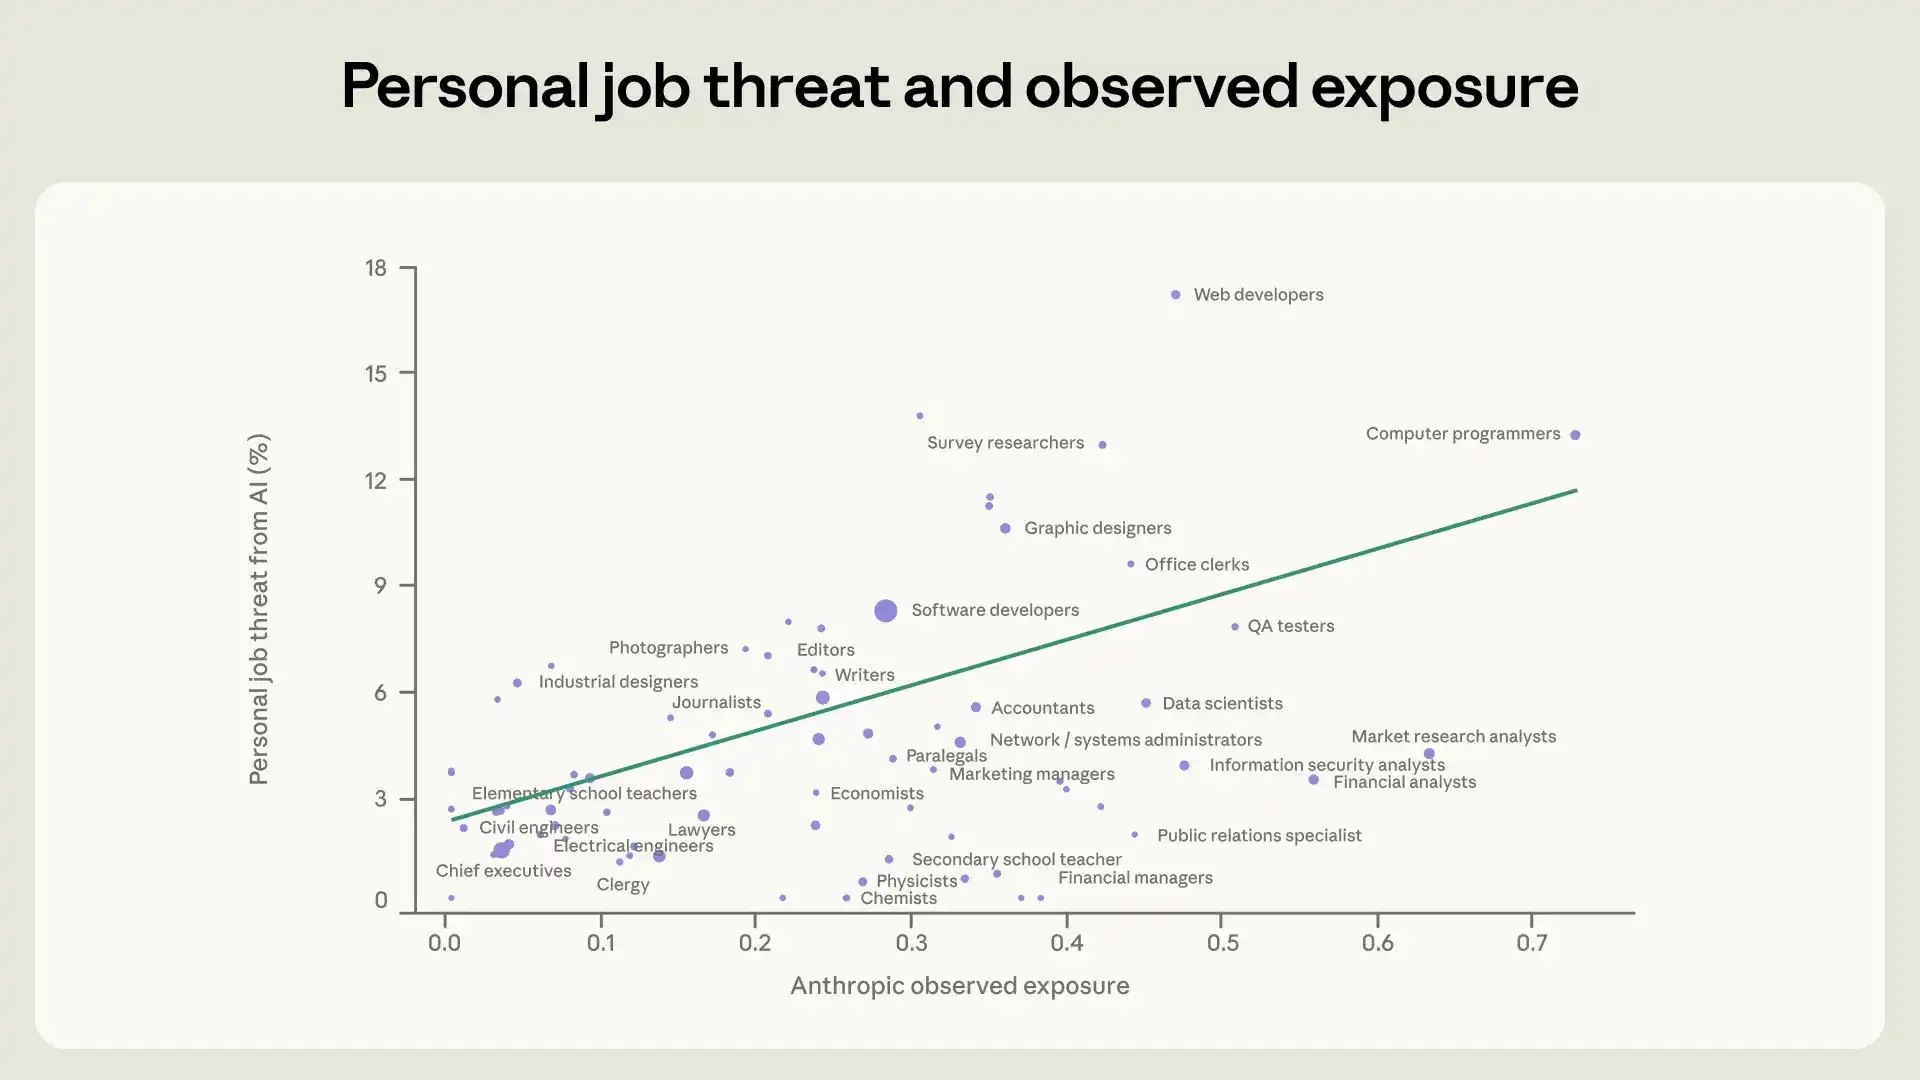
Figure 1: Perceived Job Threat from AI vs. Actual Exposure. The chart shows the percentage of respondents who perceived some job threat from AI, plotted against the actual exposure metric proposed by Massenkoff and McCrory (2026). A respondent was coded as perceiving a job threat if they stated their position had been replaced or significantly reduced, or such changes were likely in the near future (coded using Claude). The green line shows a simple linear fit.
Another important worker characteristic is career stage. In previous research, we reported preliminary signs of a slowdown in hiring for recent graduates and early-career workers in the US. For about half of the respondents in this survey, we were able to infer career stage from their answers. We found that early-career respondents were more likely to express concern about unemployment than their more senior counterparts.
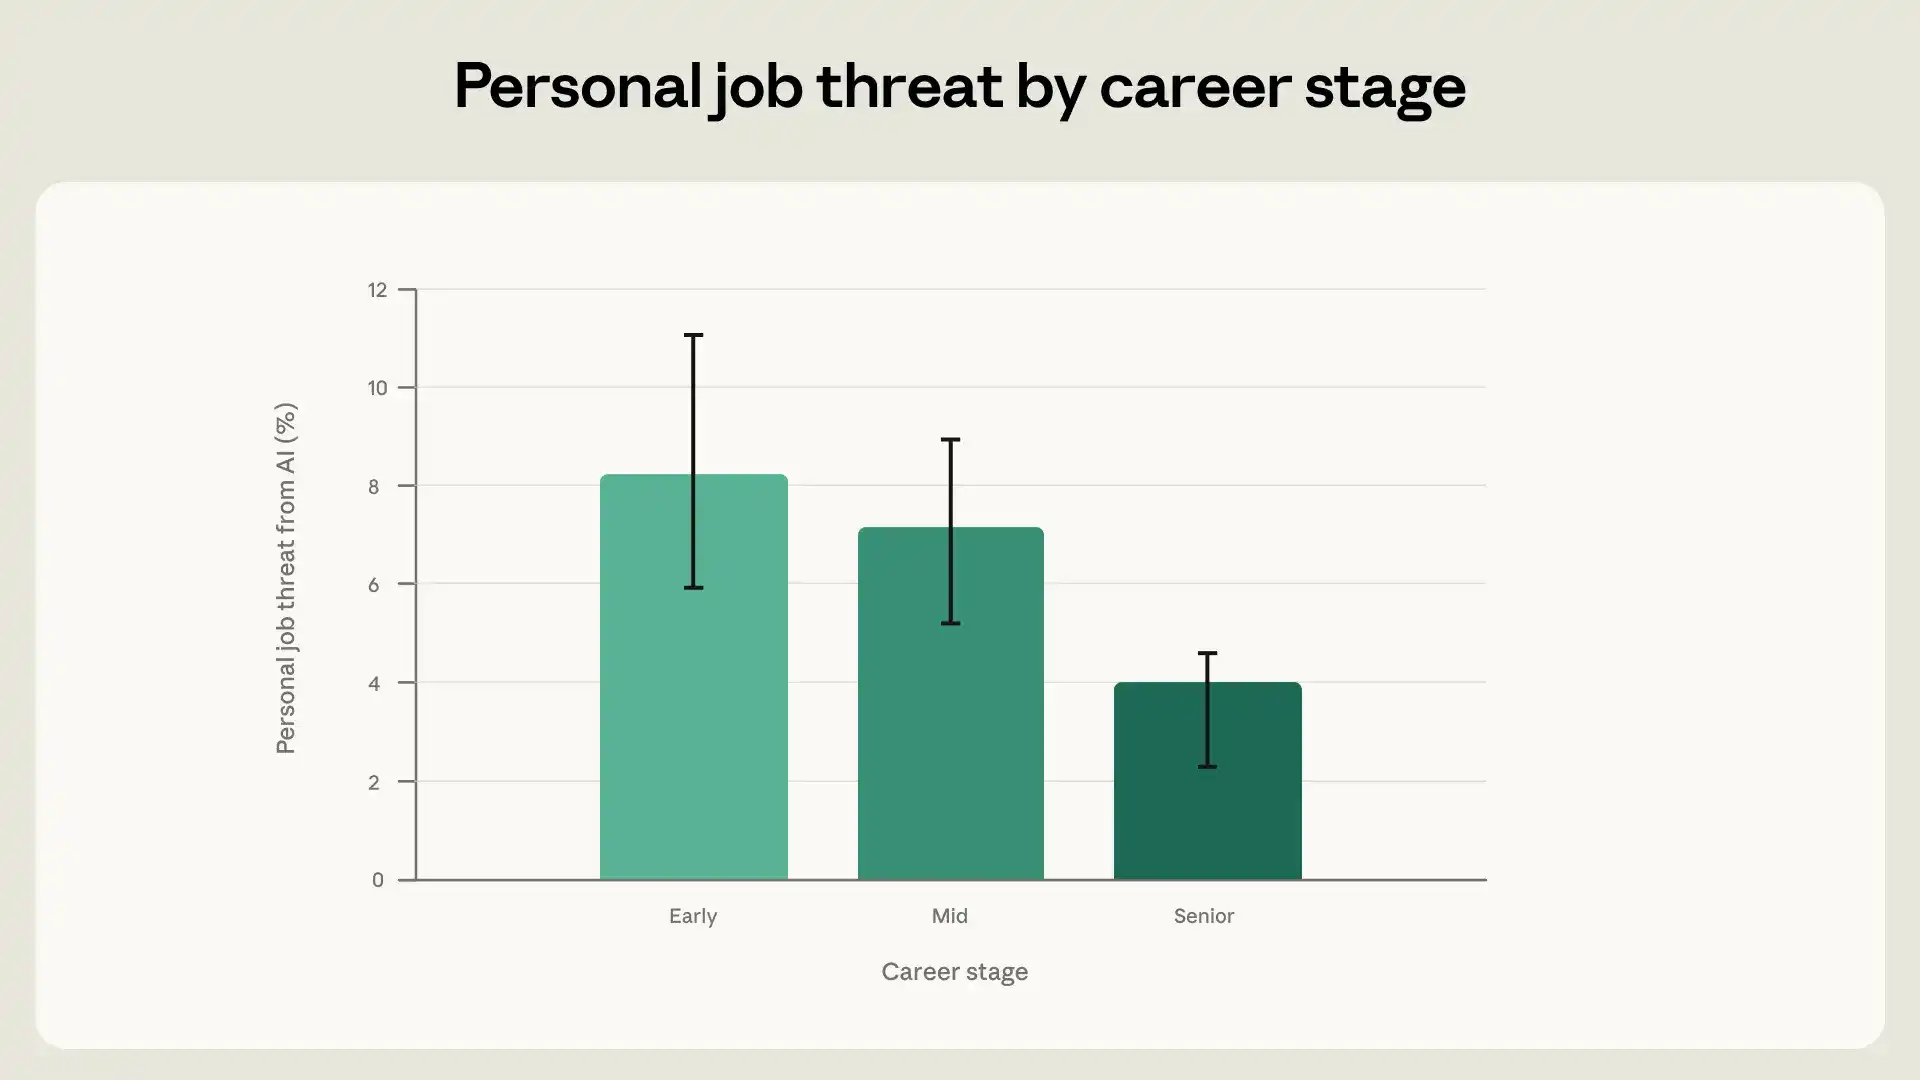
Figure 2: Concern about Economic Job Loss by Career Stage. Percentage of respondents indicating AI poses some threat to their job, by career stage. Both fields were inferred from free responses using a Claude-based classifier.
Who Benefits from AI?
Using Claude to evaluate survey responses, we rated the self-reported AI productivity boost on a 1-7 scale, where 1 is "reduced productivity," 2 is "no change," and subsequent levels indicate greater boosts. A score of 7 included testimonies like, "A website I made in 4-5 days used to take months"; Claude rated statements like "something that would have taken four hours was done in half the time" a 5, and "Personally, I had AI help me fix code on my website. But it took many attempts to get the result I wanted" a 2.
Overall, people reported meaningful productivity gains on average. The average productivity score was 5.1, corresponding to "significantly increased productivity." Of course, our respondents are active Claude.ai personal account users who chose to participate in the survey. This might make them more likely to report productivity gains than the average user. About 3% reported a negative or neutral impact, and 42% did not give a clear indication of productivity.
This varied somewhat by income. The left panel of Figure 3 shows that people in high-paying jobs, like software developers, conveyed the largest productivity gains from AI. This result is not solely driven by coding; it holds when we exclude computer and mathematical occupations. This echoes a finding from a previous economic index, which also favored high-wage workers: Claude tends to reduce the time needed to complete tasks (relative to not using AI) by a higher percentage for tasks requiring higher education.
Some of the lowest-paid workers also described high productivity gains. This includes a customer service representative using "AI to save a lot of time creating responses based on another response." In some cases, people in low-paying jobs used AI for technical side projects. For example, a delivery driver was using Claude to start an e-commerce business, and a gardener was building a music app.
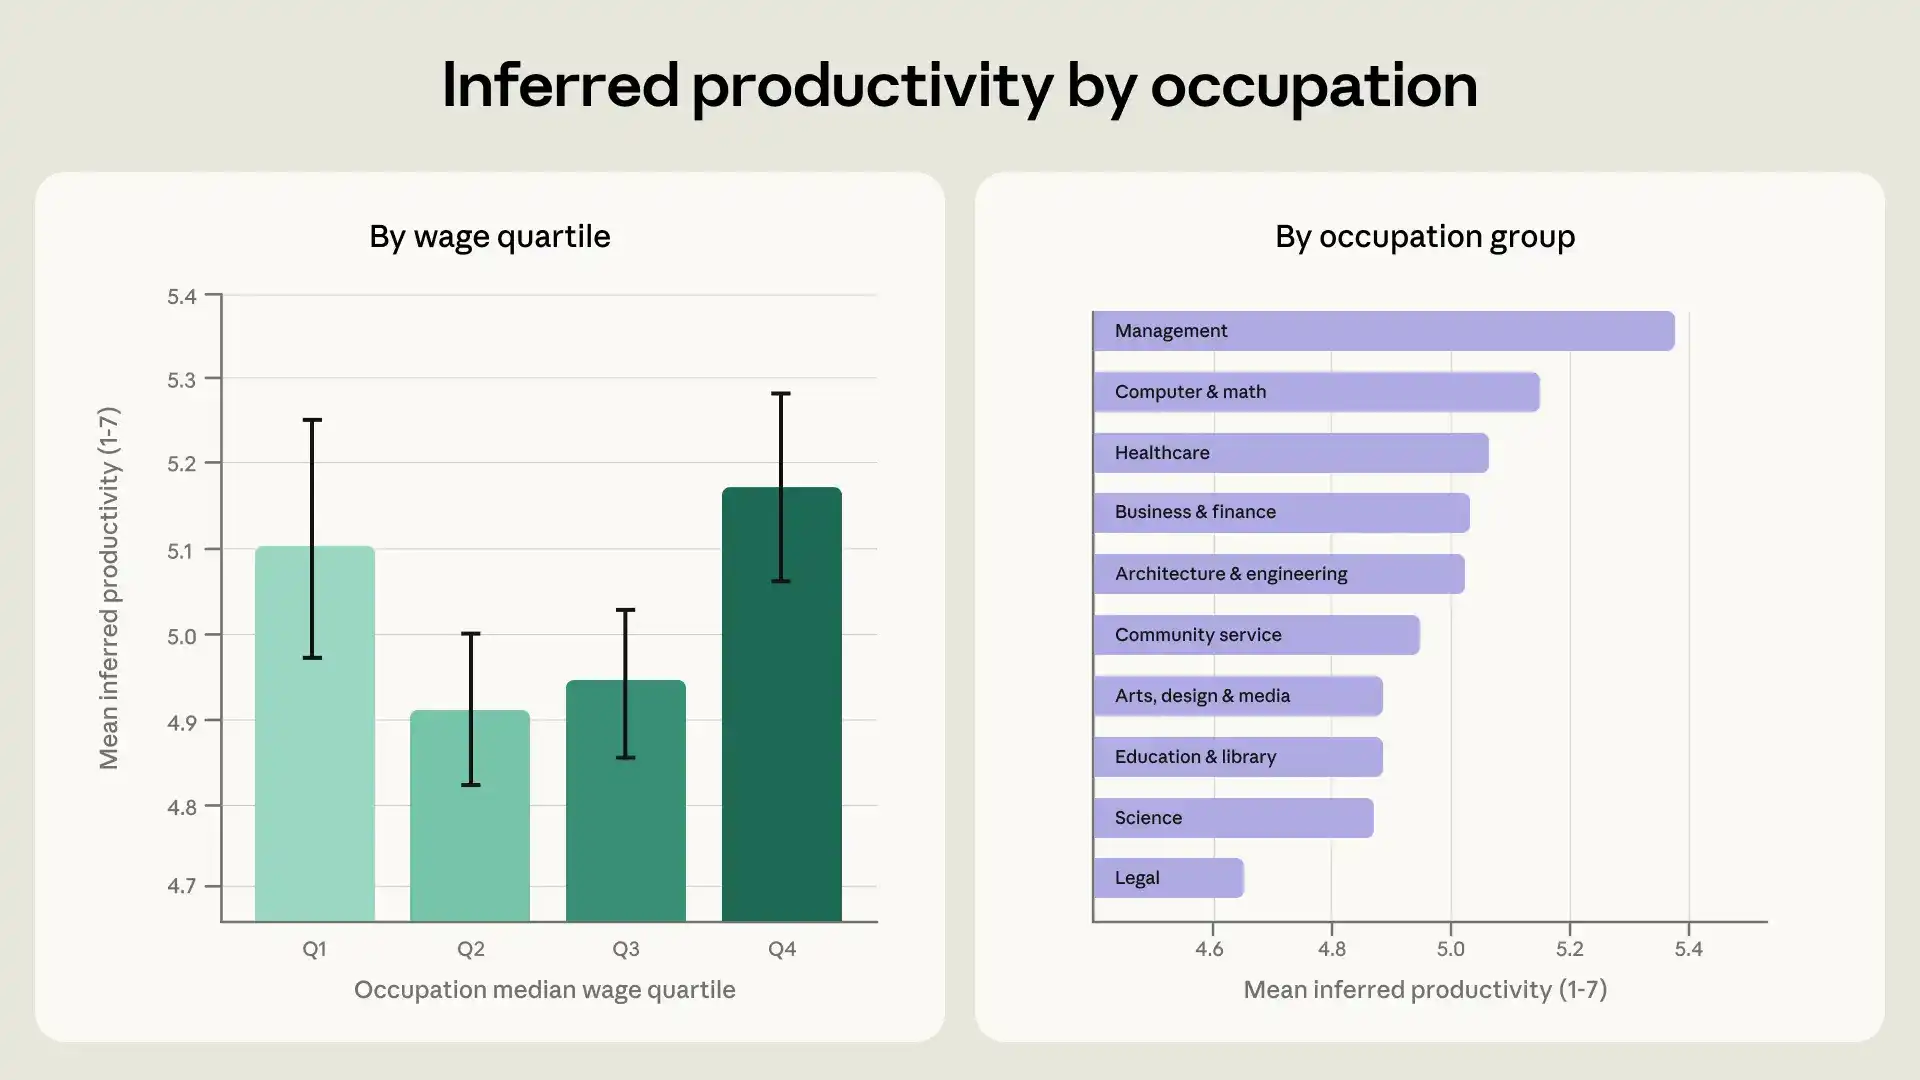
Figure 3: Inferred Productivity Gains by Occupation. The left chart shows the average inferred productivity gain from AI (inferred using a Claude-based classifier) by quartile of occupational median wage provided by the US Bureau of Labor Statistics (BLS). The right chart shows the same results but by major occupational group. Error bars indicate 95% confidence intervals.
We look at this in more detail in the right panel of Figure 3, showing inferred productivity gains for major occupational groups. At the top are management occupations. These respondents were mostly entrepreneurs using Claude to start businesses. The second-highest category is computer and mathematics, including software developers. The two groups showing the most modest productivity improvements are workers in science and law. Some lawyers were concerned about AI's ability to follow precise instructions. For example: "I have given very specific rules about what goes where, how to read legal documents, what I want it to do... but it deviates every time."
As AI diffuses through the economy, a key question is where the gains will flow—to workers, their managers, consumers, or companies. About a quarter of respondents specified the recipients of these gains in their interviews. Overall, the majority of these people mentioned benefits for themselves, through faster tasks, expanded scope, and freed-up time. But 10% of respondents who specified recipients said employers or clients demanded and received more work. A smaller proportion mentioned benefits for AI companies, and an even smaller proportion said AI would be a net negative. This depended on career stage: only 60% of early-career workers said they personally benefited from AI, compared to 80% of senior professionals.
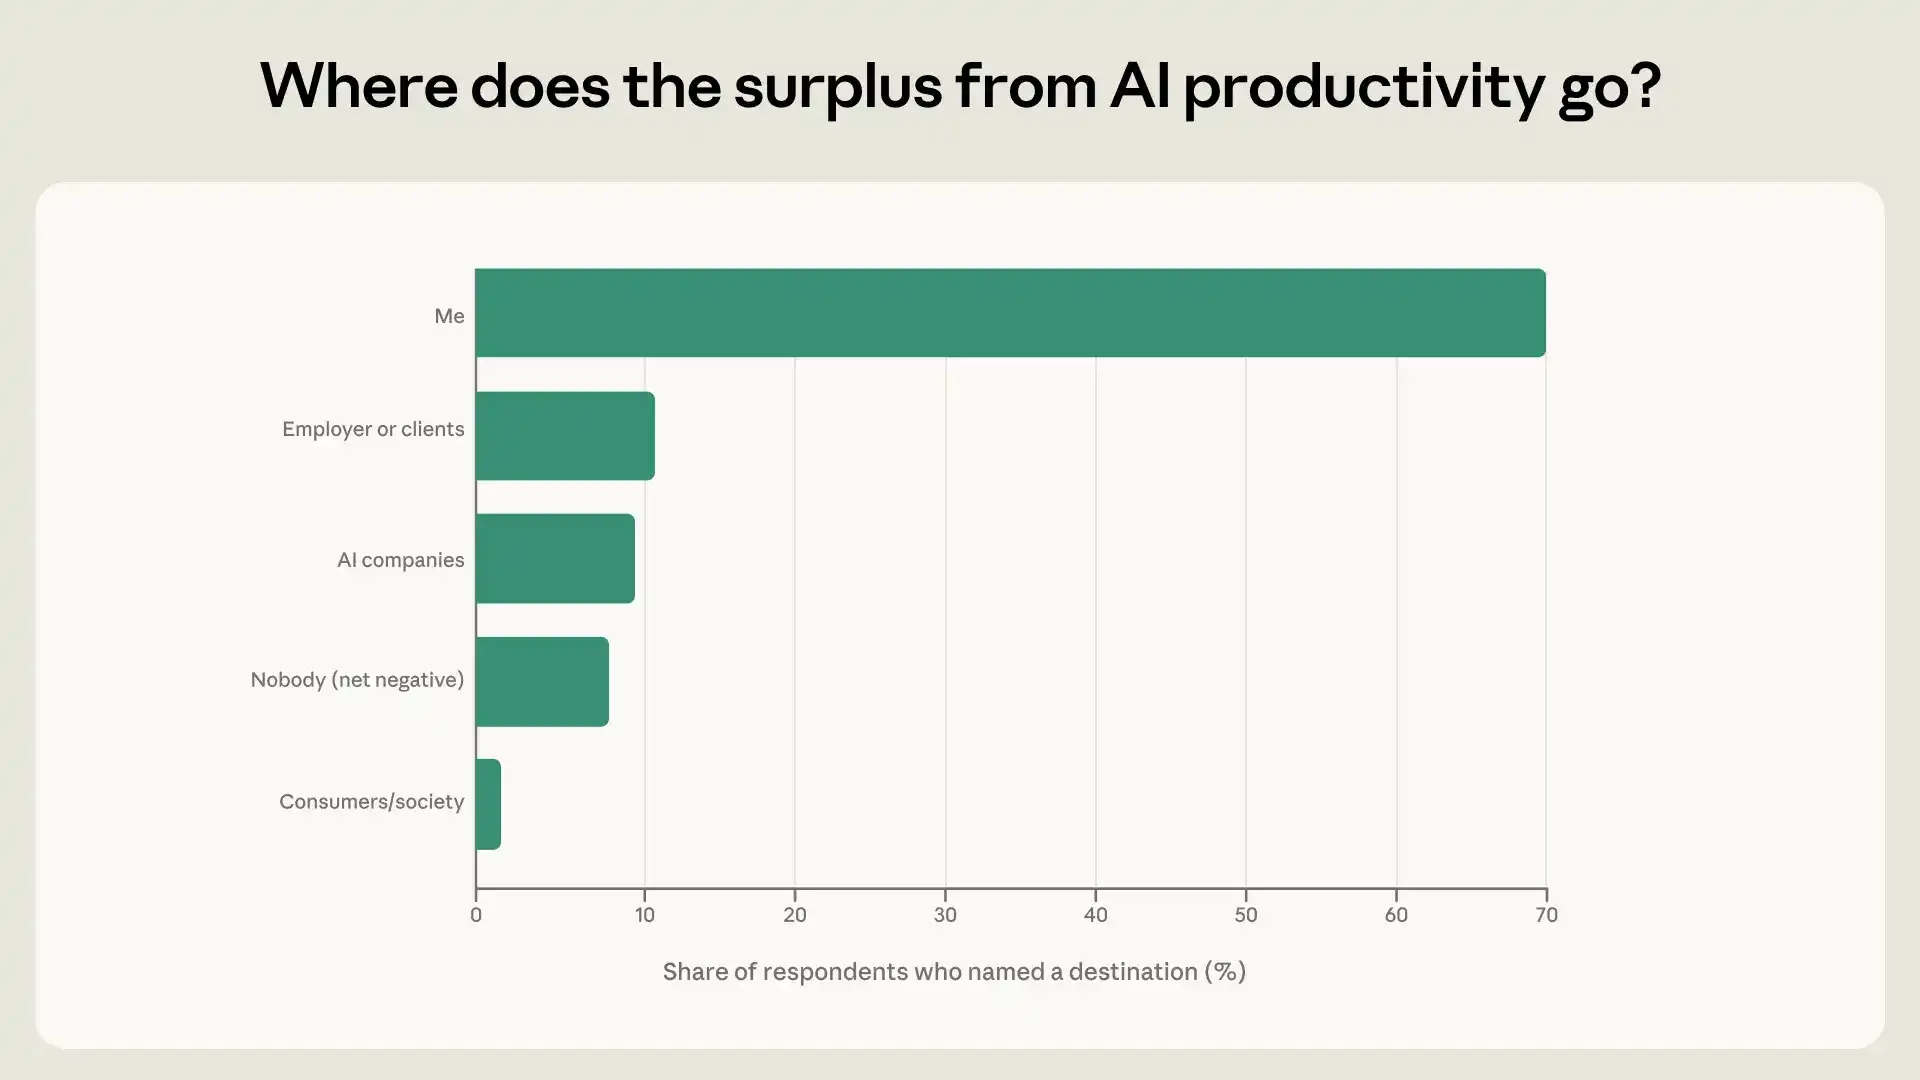
Figure 4: Where Does the Surplus from AI Productivity Gains Flow? Among respondents who enumerated beneficiaries of AI productivity gains, the proportion indicating each beneficiary.
Scope and Speed
Respondents also shared where they experienced productivity gains. We categorized these into scope, speed, quality, and cost. For example, many using AI for coding tasks said, "I'm not a technical person, but now I'm a full-stack developer." This is an expansion of scope; AI unlocked new capabilities for them. In contrast, some users sped up tasks they were already doing, like the accountant who said, "I built a tool that helps me complete a financial task in 15 minutes that used to take 2 hours." Quality improvements often came from more thorough checks of code, contracts, and other paperwork. A small fraction of respondents mentioned the low cost of using AI: "Hiring a social media manager was beyond my budget."
We found the most common productivity gain was in scope, mentioned by 48% of users who explicitly mentioned a productivity impact. 40% of users mentioning productivity highlighted speed.
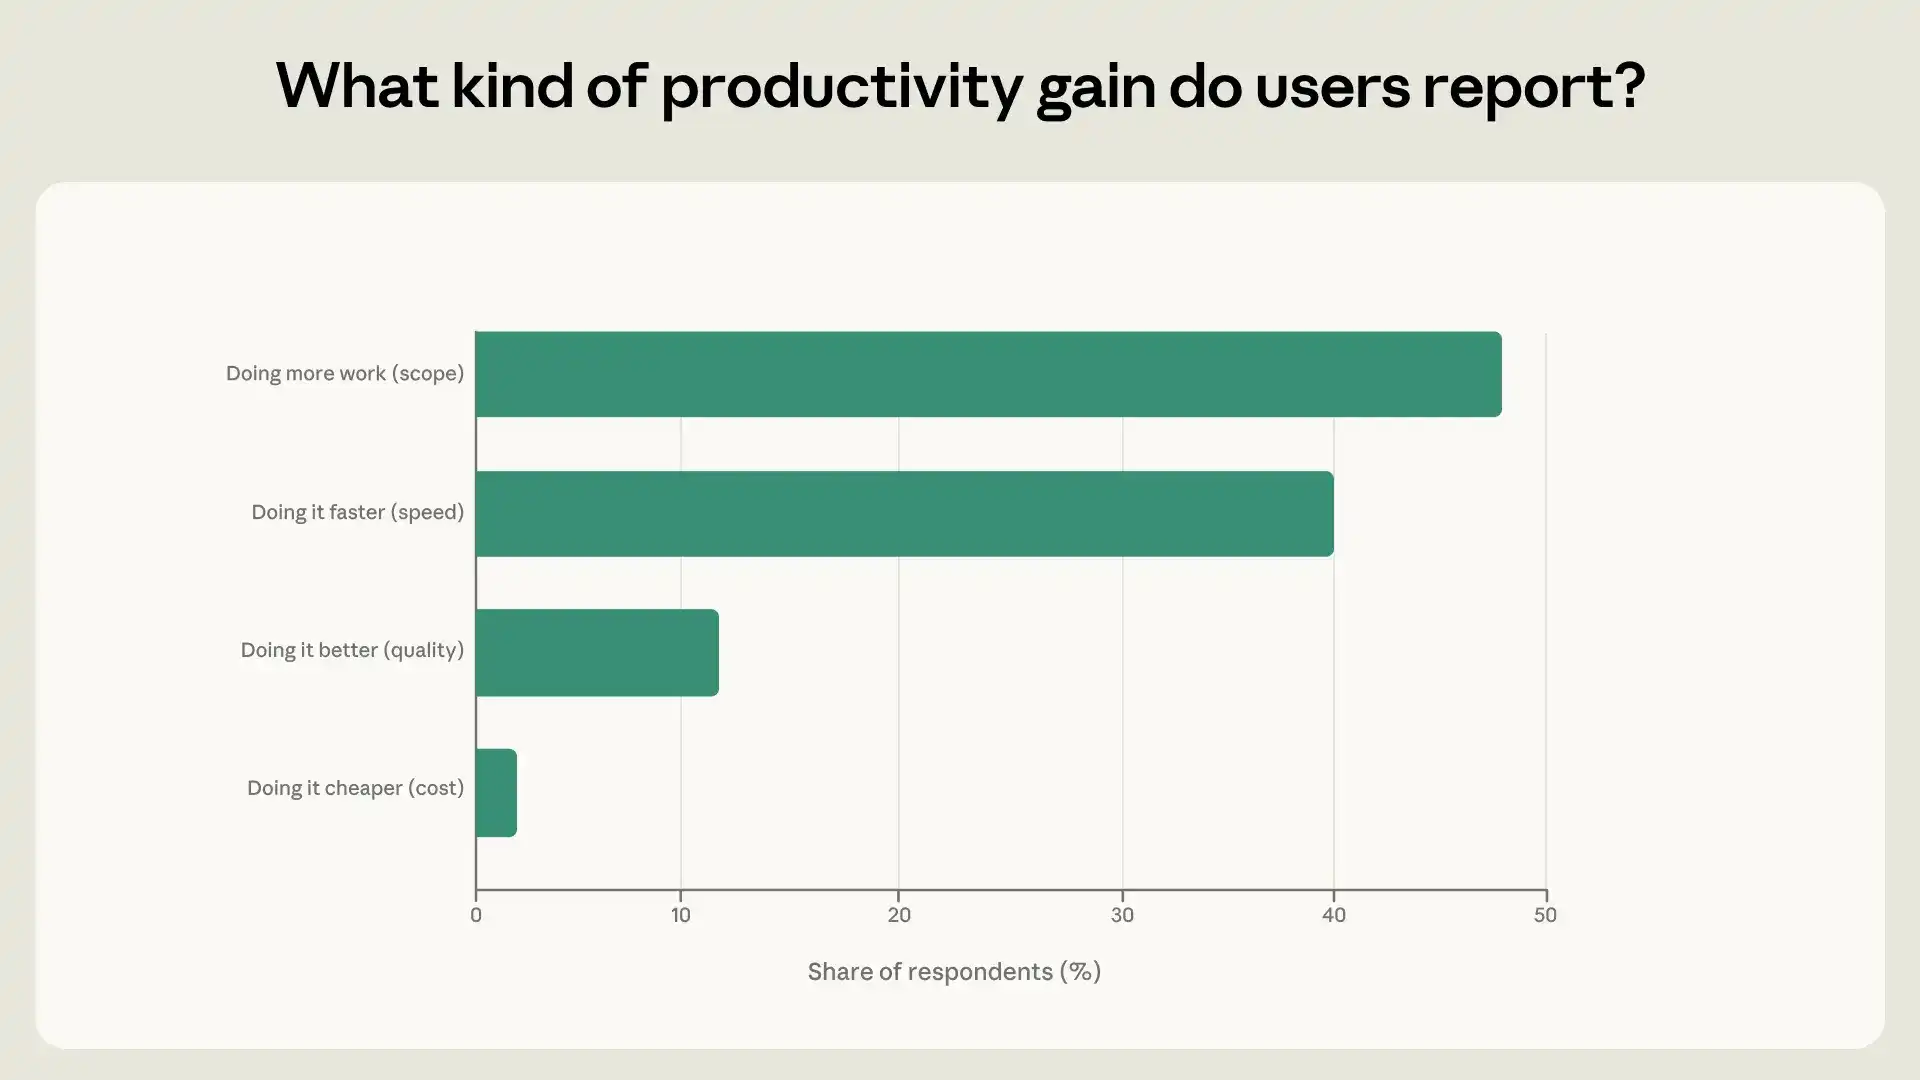
Figure 5: What Types of Productivity Gains Did Users Report? Proportion of respondents describing each type of productivity gain.
People's experience using Claude might also influence their concerns about AI. To assess this, we measured the speed boost reported by respondents, by extracting whether their work is now much slower (we coded as 1), unchanged in speed (4), or much faster (7).
We found a U-shaped relationship between speed boost and perceived job threat (see Figure 6). The leftmost bar shows respondents who reported AI slowed them down. These respondents were more likely to indicate AI posed a significant threat to their livelihood. For instance, some creative workers, like artists and writers, found AI too constraining and rigid to help in their own work. Simultaneously, they worried that AI's spread into creative fields would make it harder for them to find work.
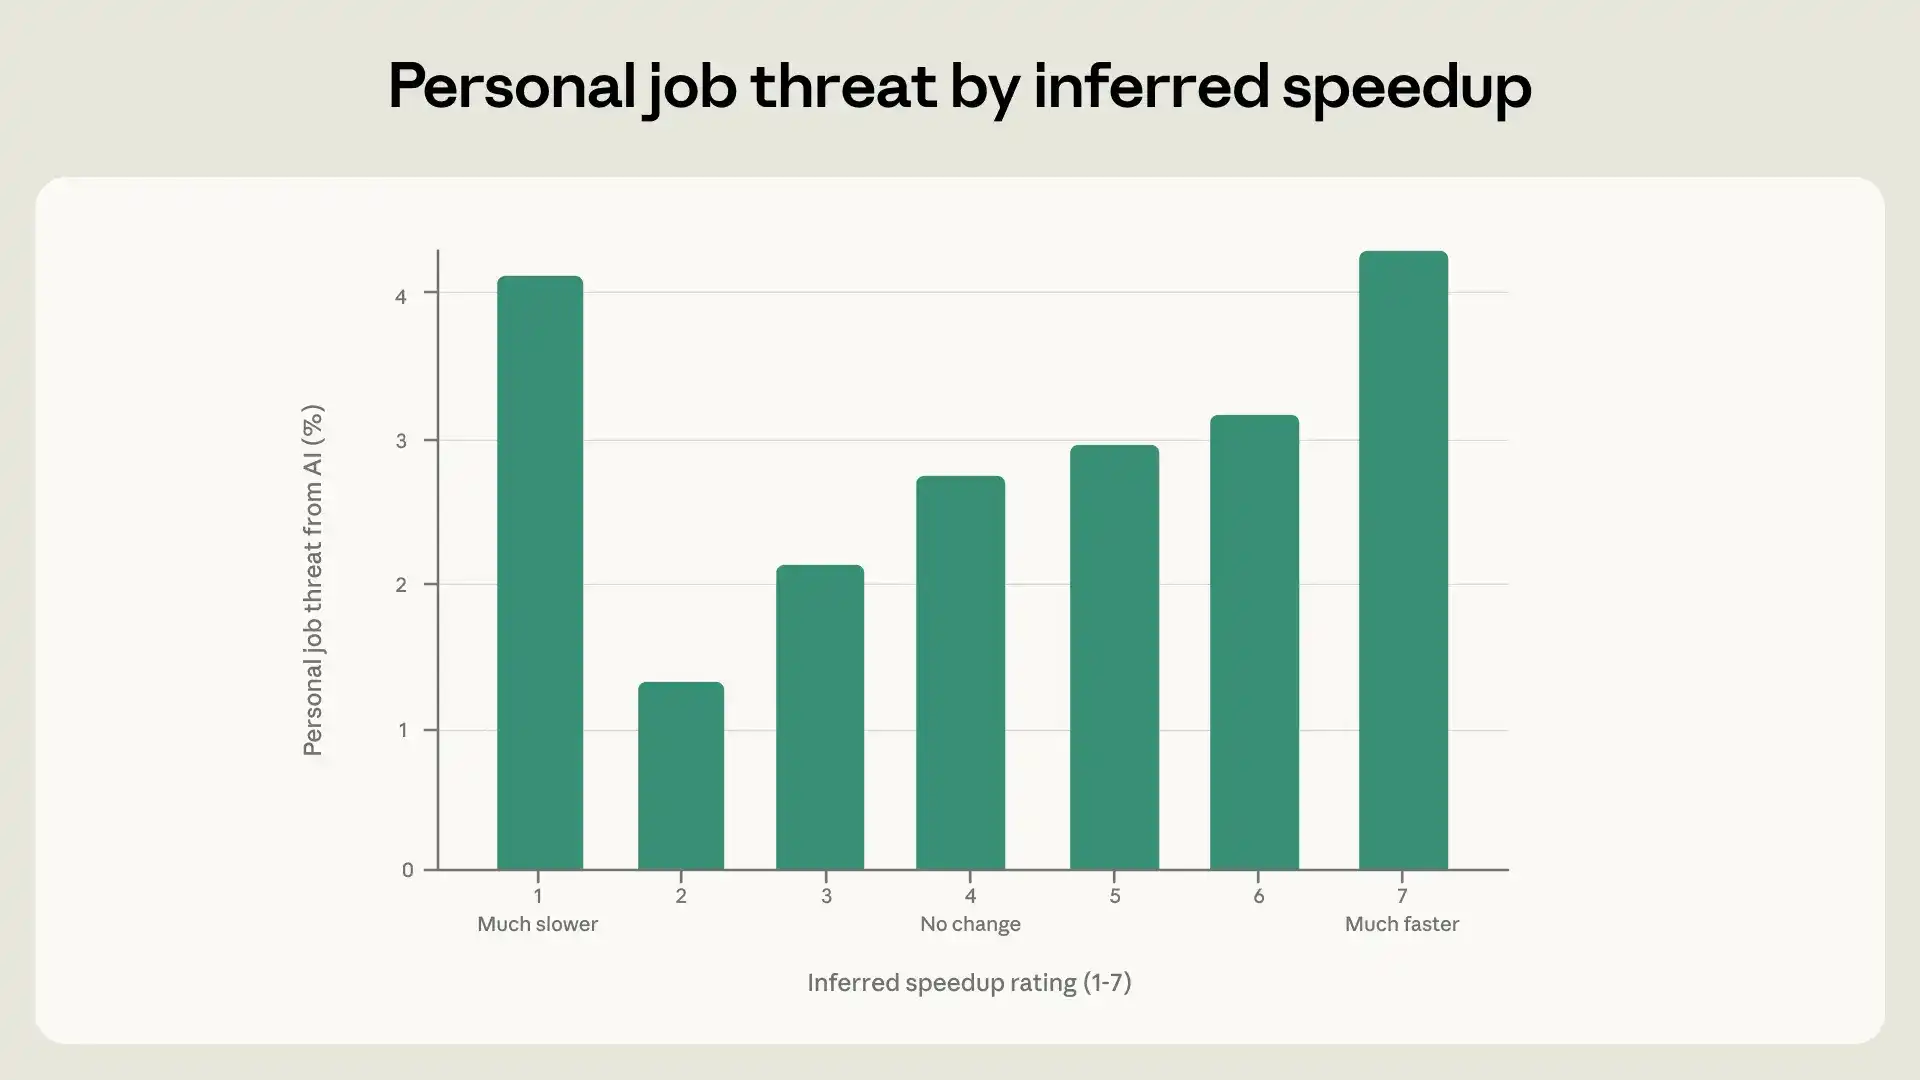
Figure 6: Job Threat from AI and Acceleration. Percentage of respondents indicating their job has been or is likely to be replaced in the near future, by inferred level of acceleration.
For the remaining respondents, perceived job threat increased consistently with the level of speed boost implied by their answers. This makes some economic sense: if the time required to complete tasks is shrinking rapidly, there may be more uncertainty about the future viability of that role.
The economic index reveals what people do with AI. But another key input for understanding AI's economic impact is hearing directly from people about their experiences. The responses explored here show that people's intuitions align with usage data: they are most concerned about AI's impact in jobs where we observe Claude doing the most work. We also found higher levels of economic anxiety among early-career workers, consistent with past research.
There are also signs that Claude empowers users. People were most likely to talk about gains flowing to themselves, rather than employers or AI companies. High-wage workers were most enthusiastic about AI's productivity effects, but people in low-wage jobs and with less education also reported substantial productivity gains. Most respondents reported Claude enhanced their capabilities in the form of expanding their work scope or speeding them up. But users experiencing the greatest speed boosts were also the most anxious about AI's job impact.
Our analysis has important caveats due to the nature of the data. First, our survey is limited to Claude.ai personal account users who chose to respond. Among other potential biases, these users might be more inclined to think gains flow to themselves. Second, users were not directly asked about many of the derived variables here, so our inferences about occupation, career stage, and other variables from contextual clues could be wrong. Relatedly, as the survey was open-ended, our measures are based on what respondents happened to mention; these findings should be confirmed in structured surveys that directly ask about these topics.
Nonetheless, the interviews reveal genuine insights into how people feel about the AI economy, showing how qualitative data can surface quantitative hypotheses. The sheer volume of economically related concern is itself a strong signal.
Acknowledgements
We thank the 80,508 Claude users who shared their stories.
Maxim Massenkoff led the analysis and wrote the blog post. Saffron Huang led the interview project and provided guidance throughout.
Zoe Hitzig and Eva Lyubich provided critical feedback and methodological guidance. Keir Bradwell and Rebecca Hiscott gave editorial support. Hanah Ho and Kim Withee contributed to the design. Grace Yun, AJ Alt, and Thomas Millar implemented the Anthropic Interviewer tool in Claude.ai. Chelsea Larsson, Jane Leibrock, and Matt Gallivan contributed to survey and experience design. Theodore Sumers contributed to data processing and clustering infrastructure. Peter McCrory, Deep Ganguli, and Jack Clark provided critical feedback, guidance, and organizational support.
Additionally, we thank Miriam Chaum, Ankur Rathi, Santi Ruiz, and David Saunders for discussions, feedback, and support.
This scale is not centered on the midpoint because most people rated productivity positively, with almost all 6s and 7s on the raw Likert scale. The scale we use here goes from 1 = Reduced productivity, 2 = No change, 3 = Slight boost, 4 = Moderate boost, 5 = Significant boost, 6 = Major boost, to 7 = Transformative boost—AI fundamentally changed what or how much they could produce.
Even excluding these "solo entrepreneurs," management still ranks alongside computer and mathematical occupations, showing the highest productivity gains.
But an important limitation is that this survey targeted users with Claude personal accounts. A more representative picture would also include enterprise users, who might be more inclined to see value accruing to the employer.
Related Content
Announcing the Anthropic Economic Index Survey
We are launching the Anthropic Economic Index Survey, a monthly survey conducted via the Anthropic Interviewer.
Automated Alignment Researcher: Using Large Language Models to Scale Scalable Oversight
Can Claude autonomously develop, test, and analyze alignment ideas? We conducted an experiment to find out.
Trustworthy Agents in Practice
AI "Agents" represent the latest major shift in how people and organizations use AI. Here, we explain how they work and how we ensure their trustworthiness.