VELVET slides 18% – But key data points to consolidation, not sell-off

ambcryptoPublished on 2026-07-16Last updated on 2026-07-16

Abstract

Velvet (VELVET) has dropped approximately 18% in the last day, though it retains its position as a top market performer with a 571% gain over the past 90 days. Analysis of its perpetual futures market shows a $24 million capital outflow over two weeks, indicating profit-taking and capital flight. However, despite this exodus, a positive funding rate suggests long positions remain in control, pointing to underlying bullish sentiment among traders. The price decline is thus interpreted more as a consolidation phase following massive gains rather than a bearish reversal. The token's immediate direction hinges on a key ascending support line; a hold could spark a rebound, while a break may see a test of the $0.45 demand zone.

Velvet [VELVET] has emerged as one of the market’s heaviest losers over the past day, sliding roughly 18% across the session as sellers took control.

Despite the recent pullback, Velvet has held its position as one of the strongest gainers across the market over the past couple of months.

Over the last 90 days alone, the token has outpaced every asset in the top 100 by market capitalization, posting a 571% gain that edged out the next-best performer, Audiera [BEAT], which surged 530% over the same stretch.

Leveraged capital exits Velvet’s Futures market

A leading concern now weighing on Velvet is the capital exodus spreading across its market. The token’s perpetual Futures market shows heavier outflows than inflows, a sign that money is leaving rather than entering.

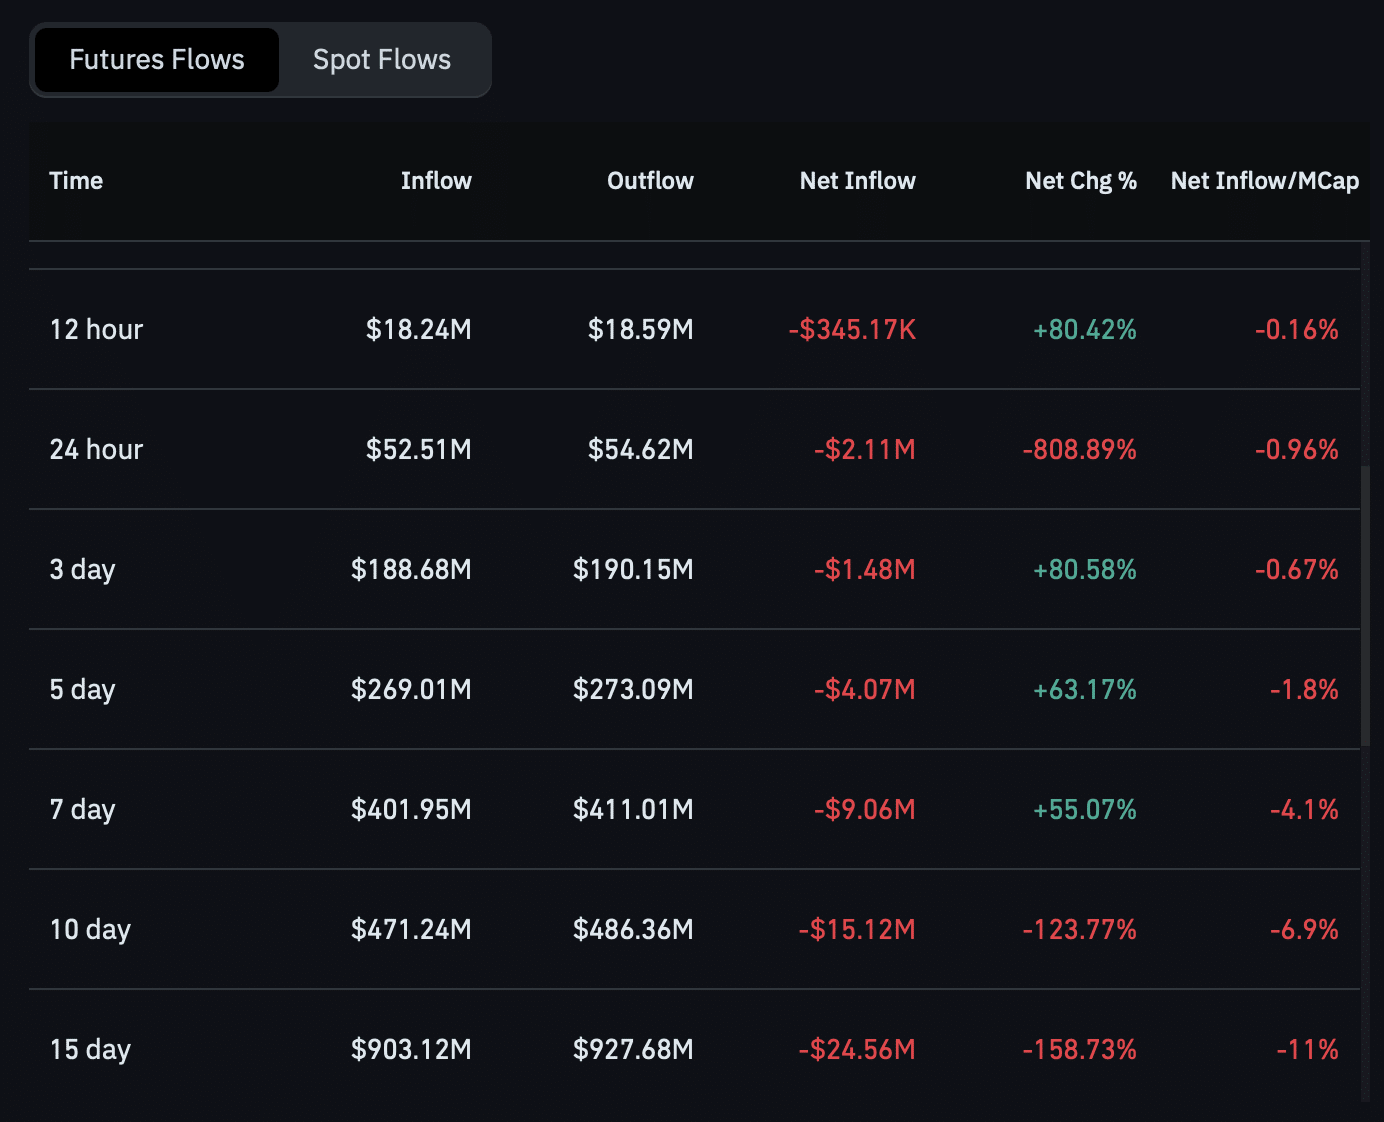
Capital draining from a market typically signals that investors are pulling their funds out, a move that often reflects bearish sentiment. Roughly $24 million has flowed out of the perpetual market over the past two weeks, pointing to investors heading for the exits.
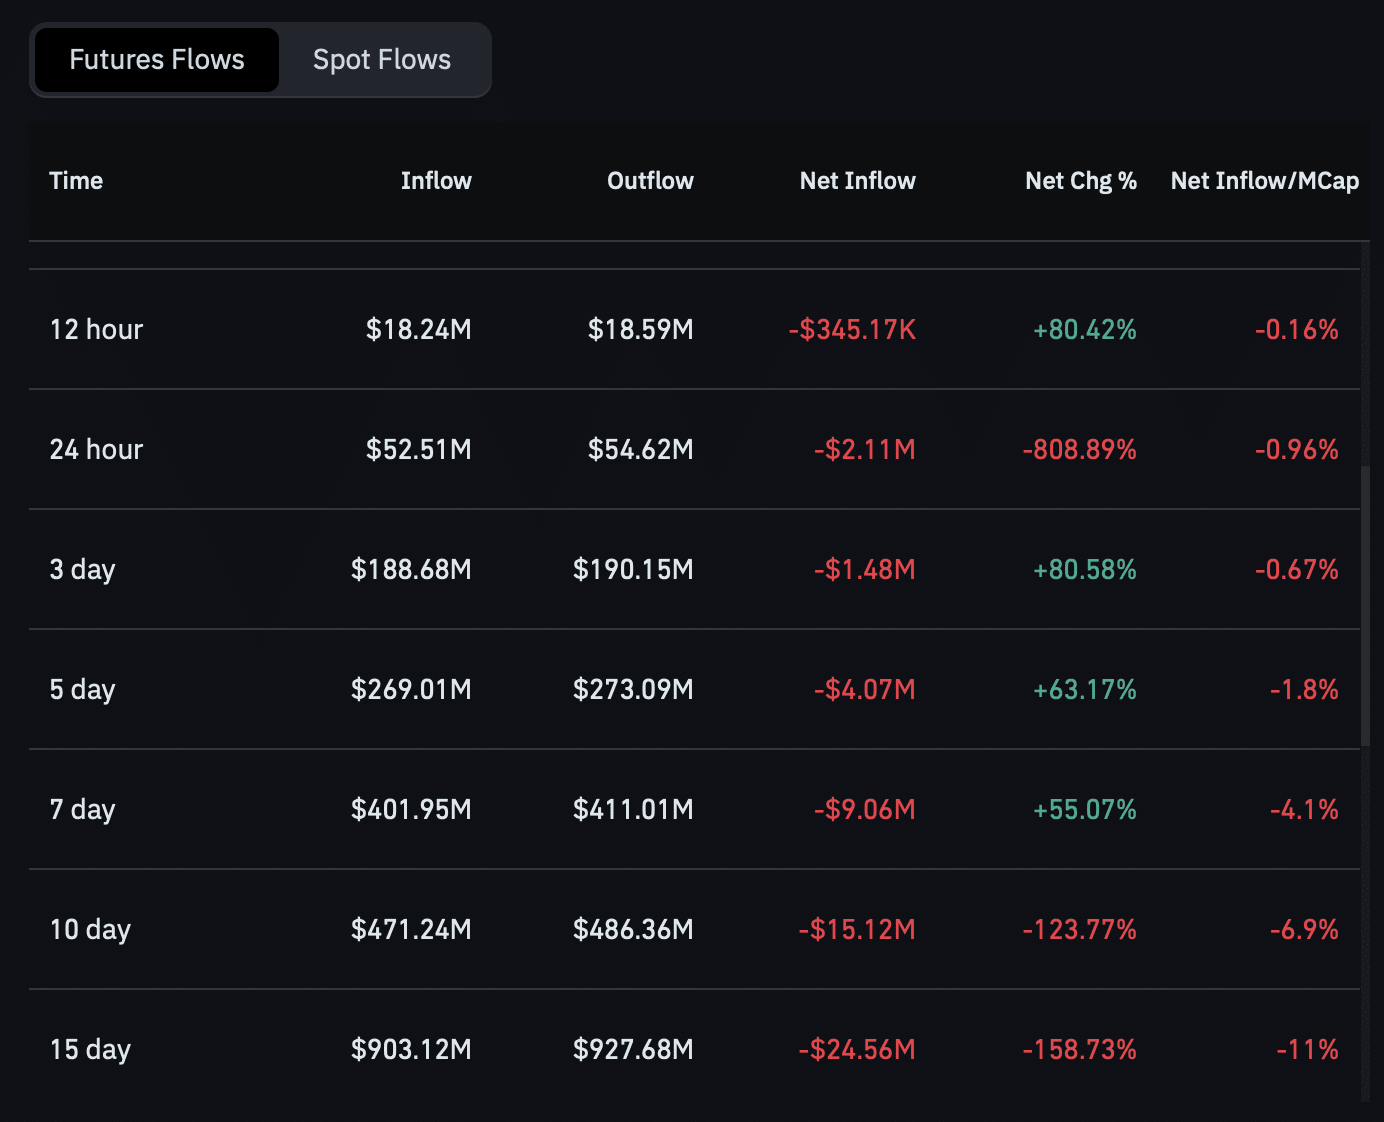
Source: Coinglass

Rising prices usually breed confidence and draw fresh capital into a market, yet Velvet has seen the opposite, with profit-taking and capital flight dominating the flows and underscoring the prevailing sentiment.

Spot market investors have failed to keep pace with the move, buying comparatively little VELVET over the same window. The chart shows a total Spot netflow of roughly $847,000.

Spot buying of that scale rarely fuels a rally on its own, leaving little chance that price mounts a meaningful move to the upside off the back of it.

Why Velvet’s decline isn’t bearish control

On the surface, Velvet’s slide and the capital retreat from its perpetual market look like bearish dominance, yet the data underneath tells a more nuanced story.

Chart data shows that even as capital exits mounted over the past two weeks, traders in Velvet’s perpetual market have clung to a bullish outlook.

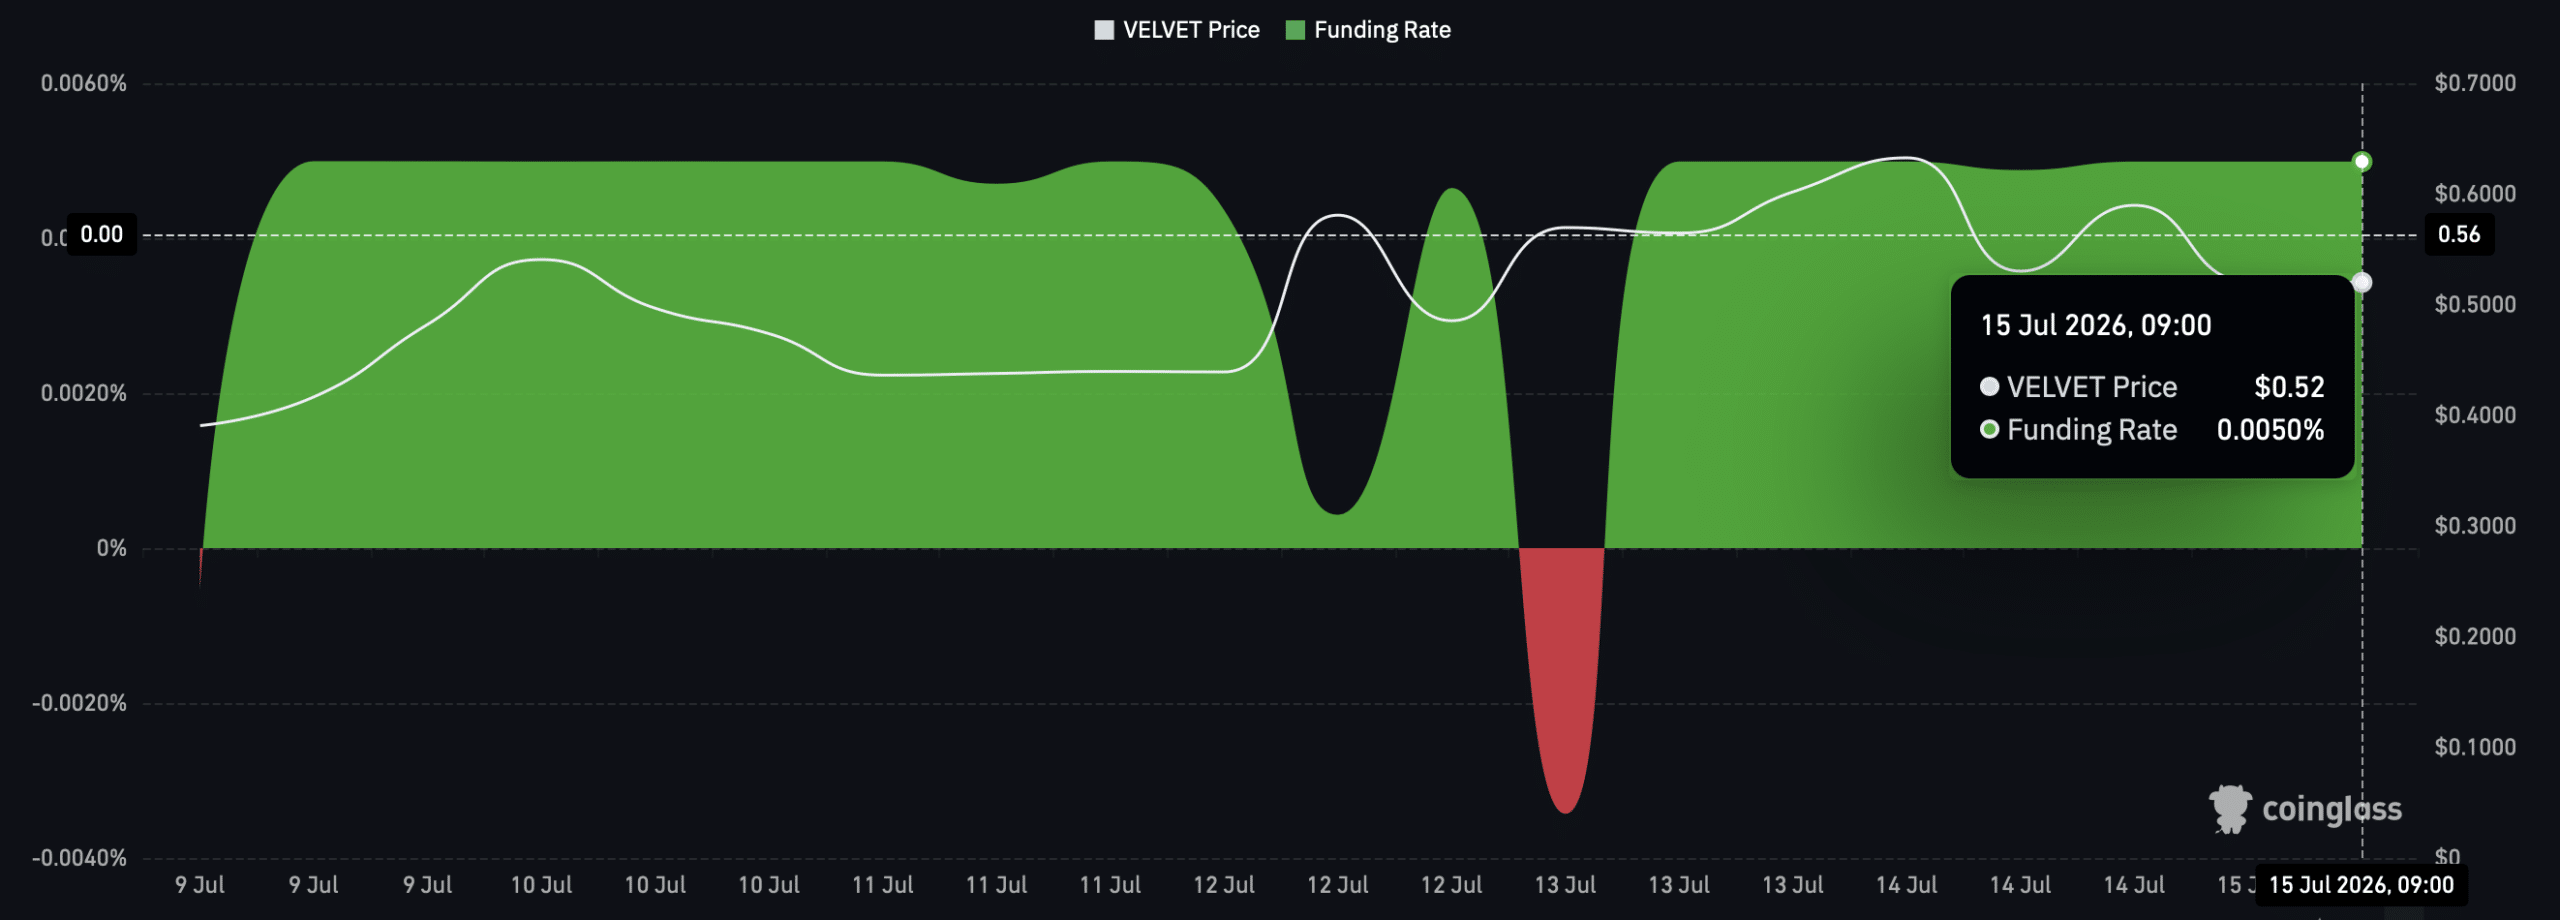
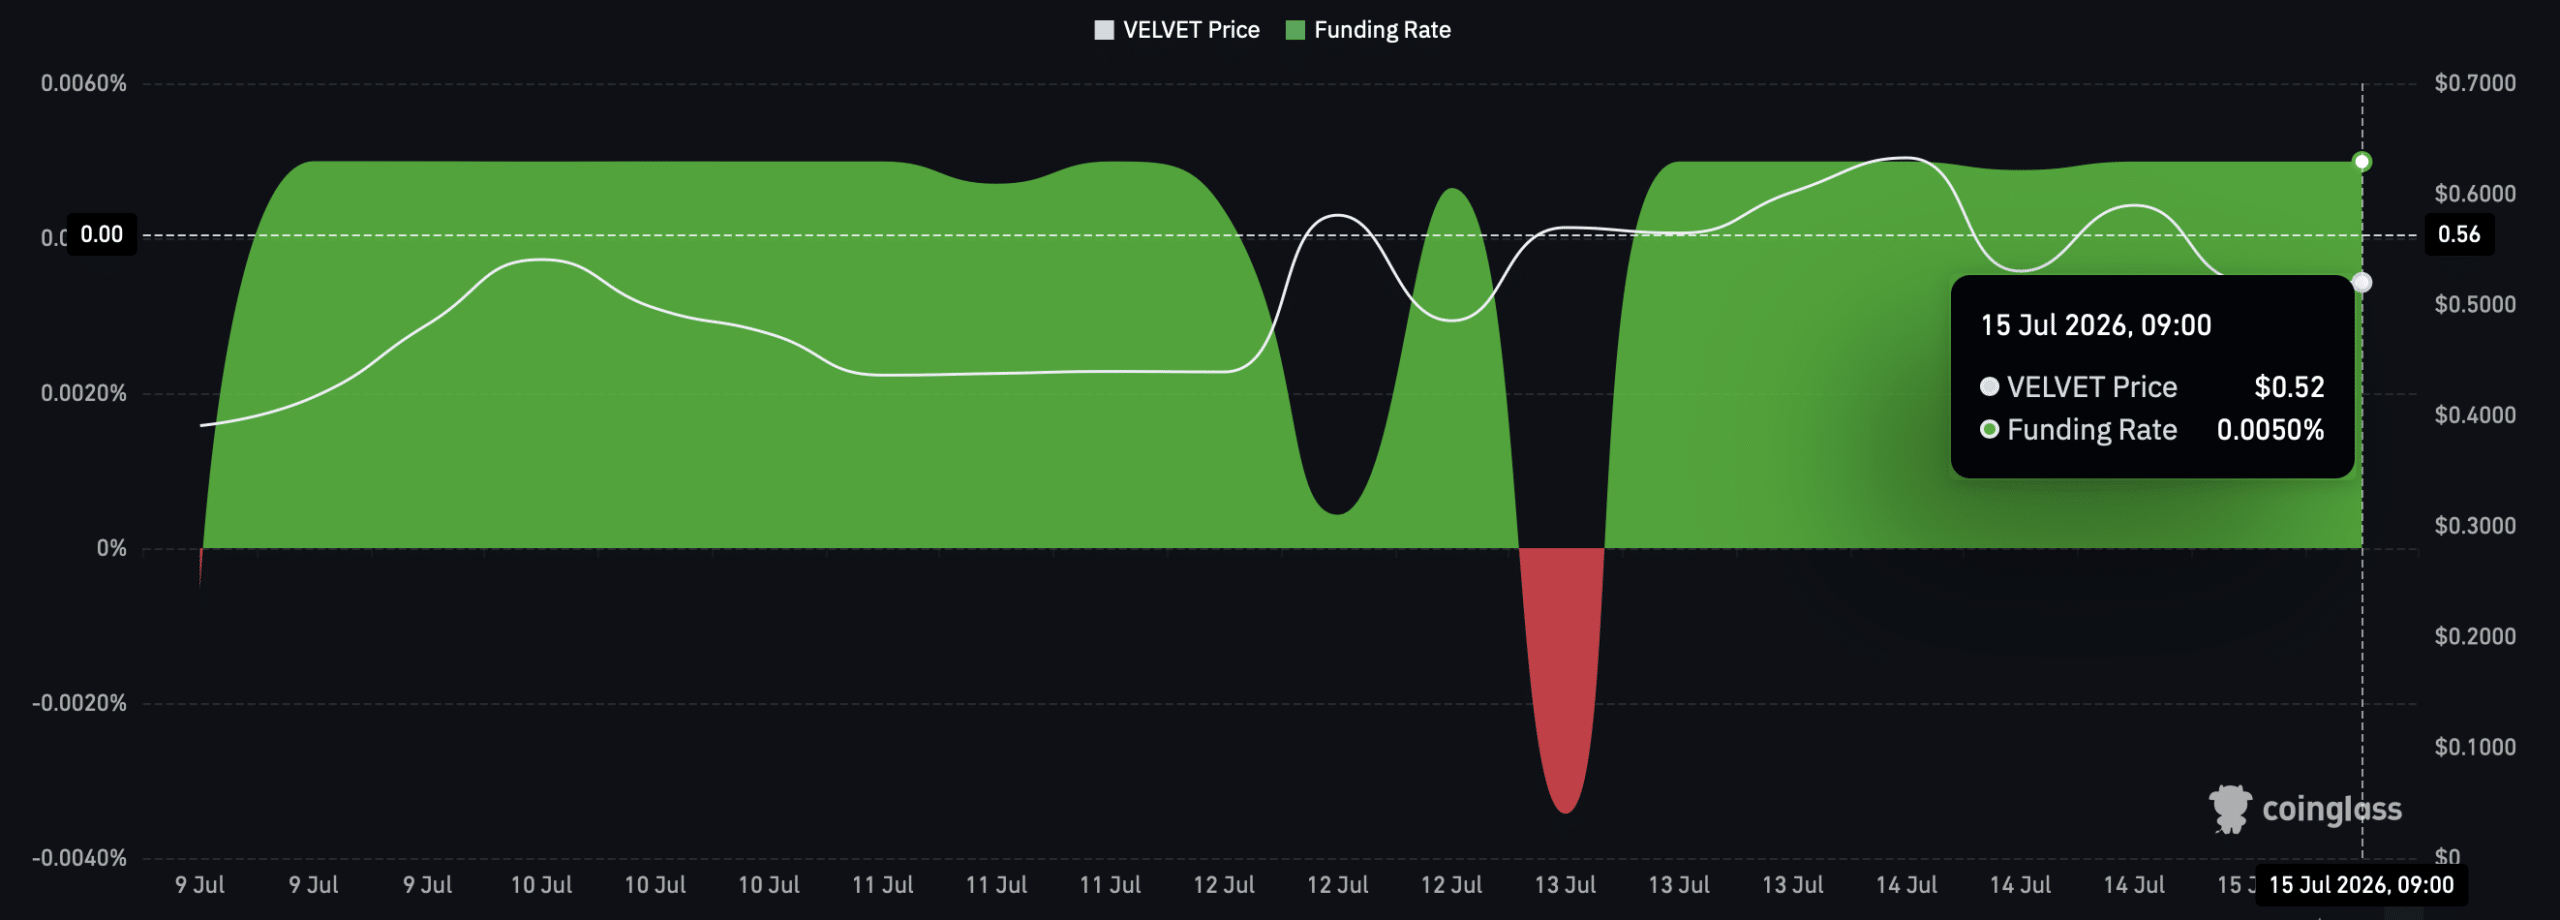
Funding Rate data, which reveals which side of the market holds control based on who pays the funding fee, shows that longs have stayed in command.
Source: Coinglass

Despite the $2.17 million net outflow recorded over the past 24 hours, the Funding Rate reached 0.0044%, suggesting that the $27.87 million perpetual market balance still sits largely in long positions.

One side, long or short, typically takes command when strong conviction builds that price will swing higher over the short to near term.

In this case, the sentiment holds that Velvet’s decline looks more like consolidation and capital management from traders who have banked massive gains.

This hangs on one key support level

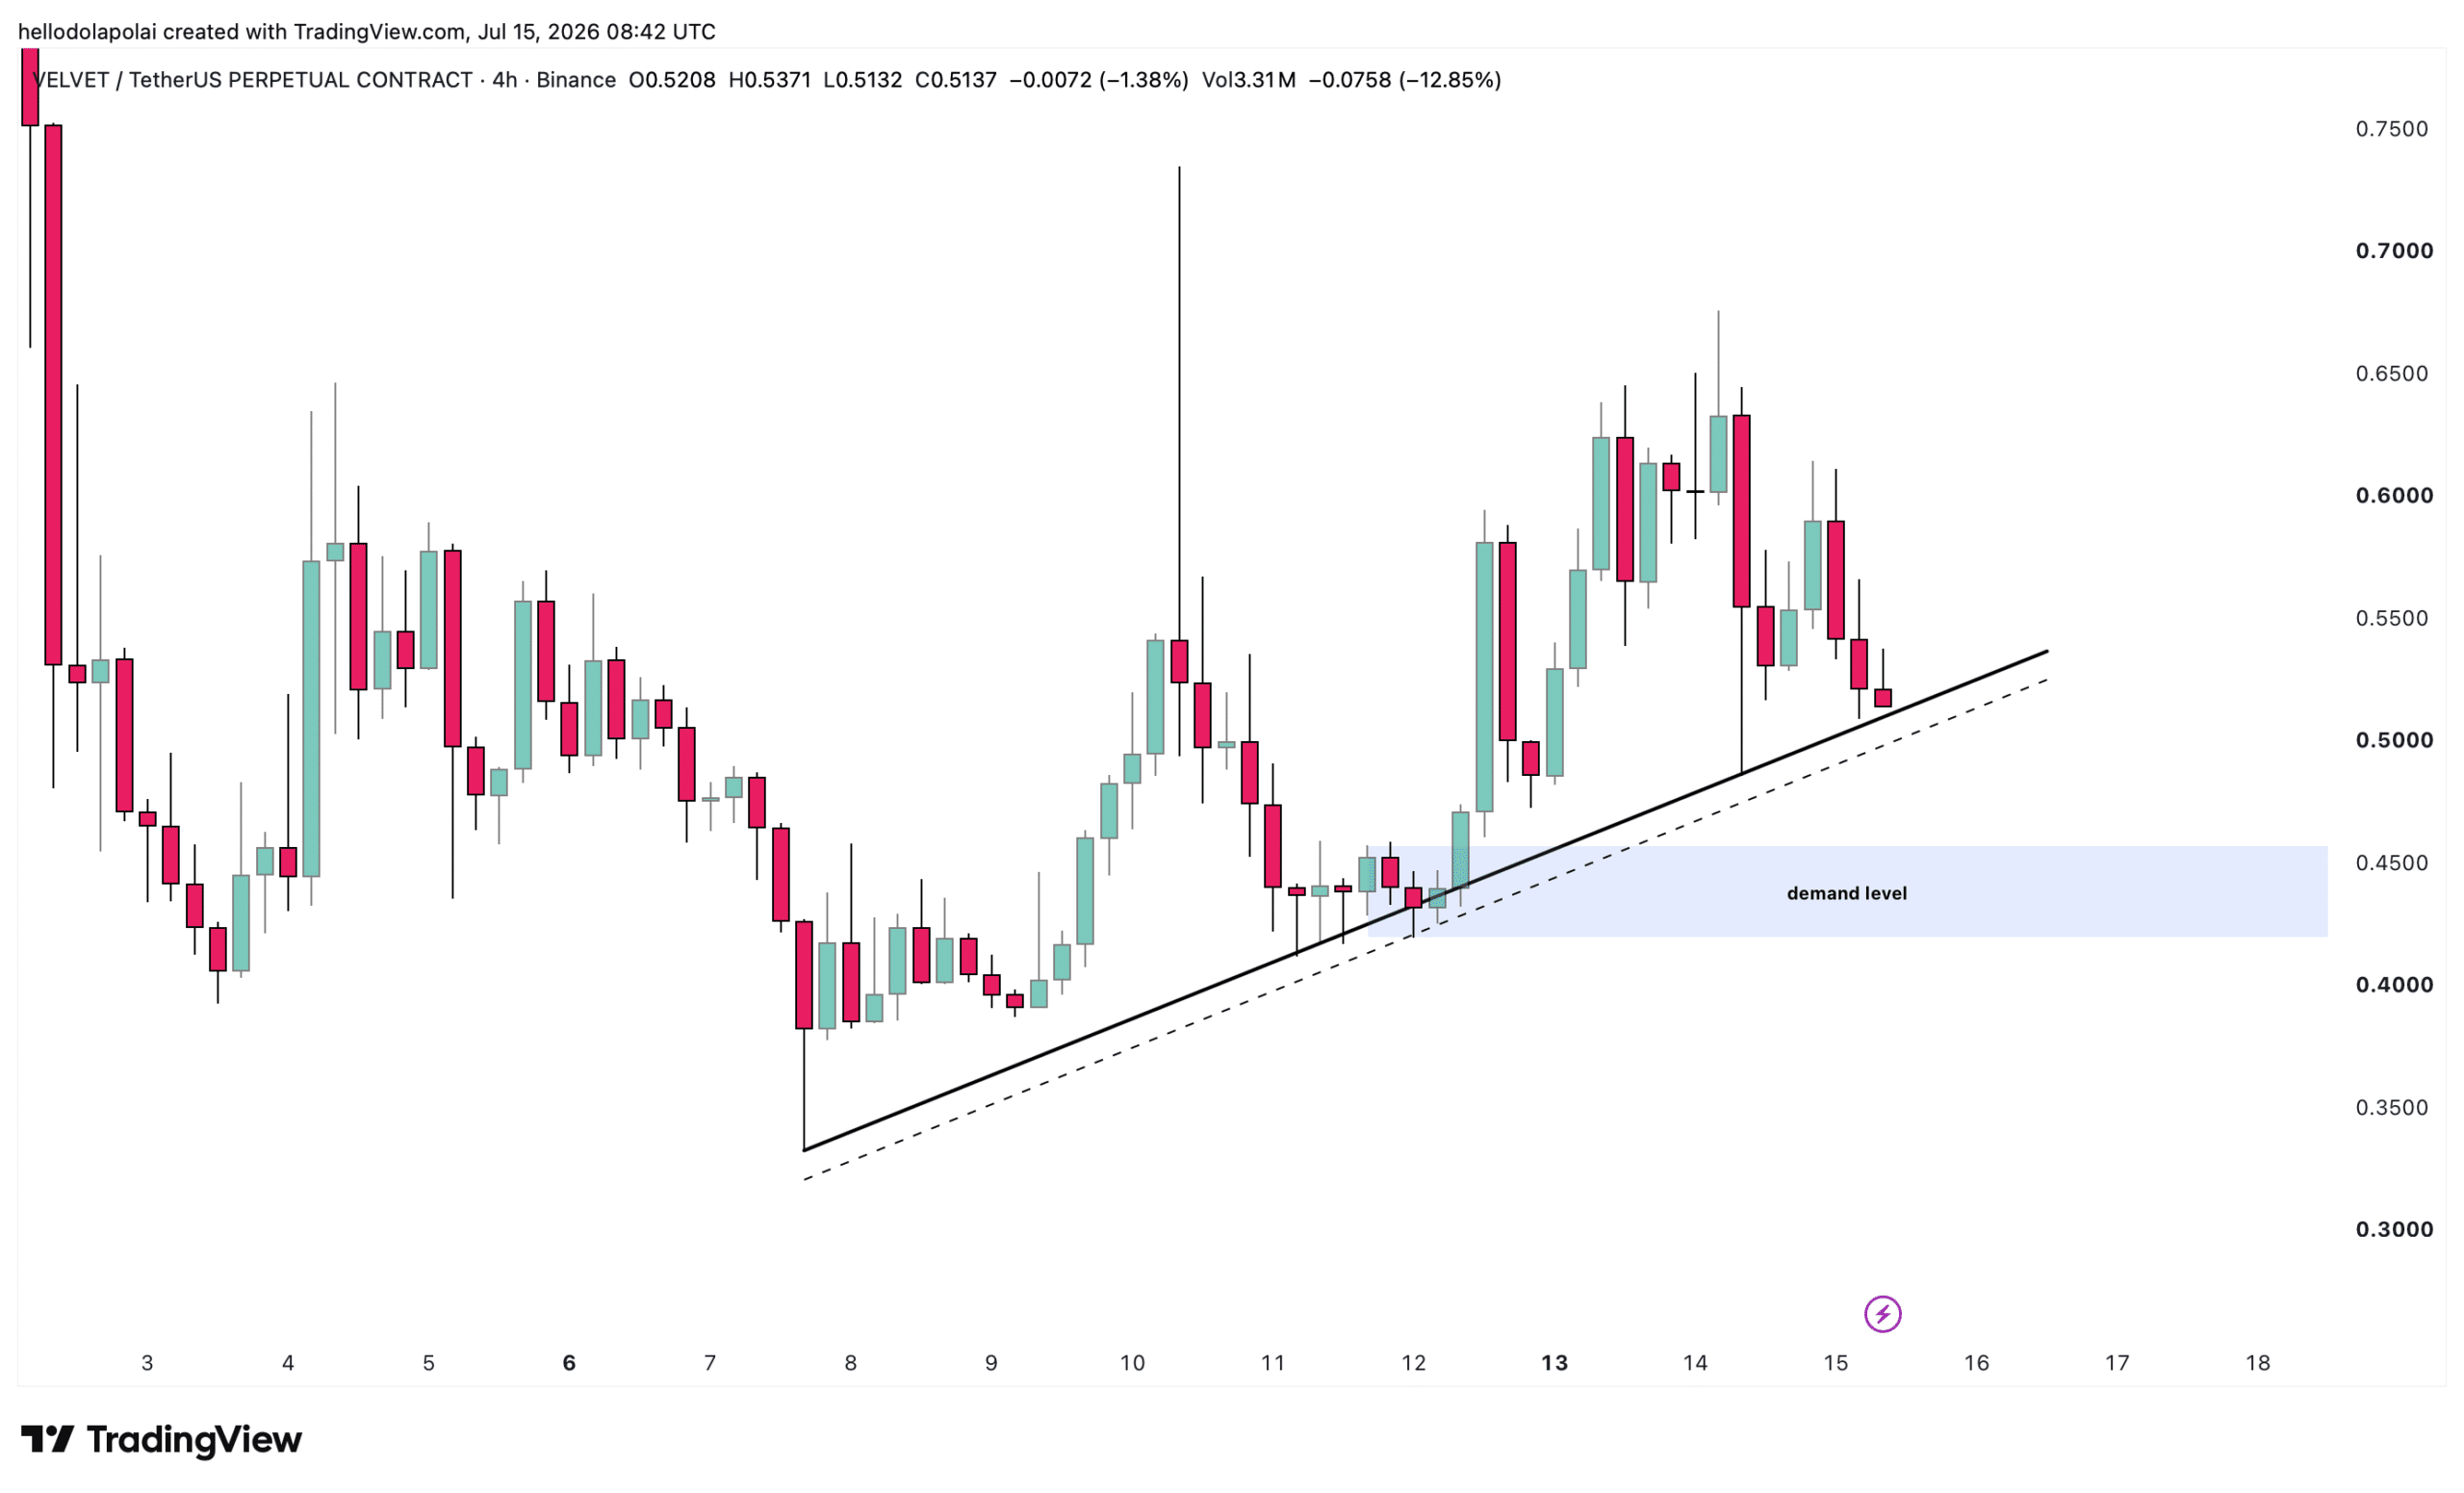
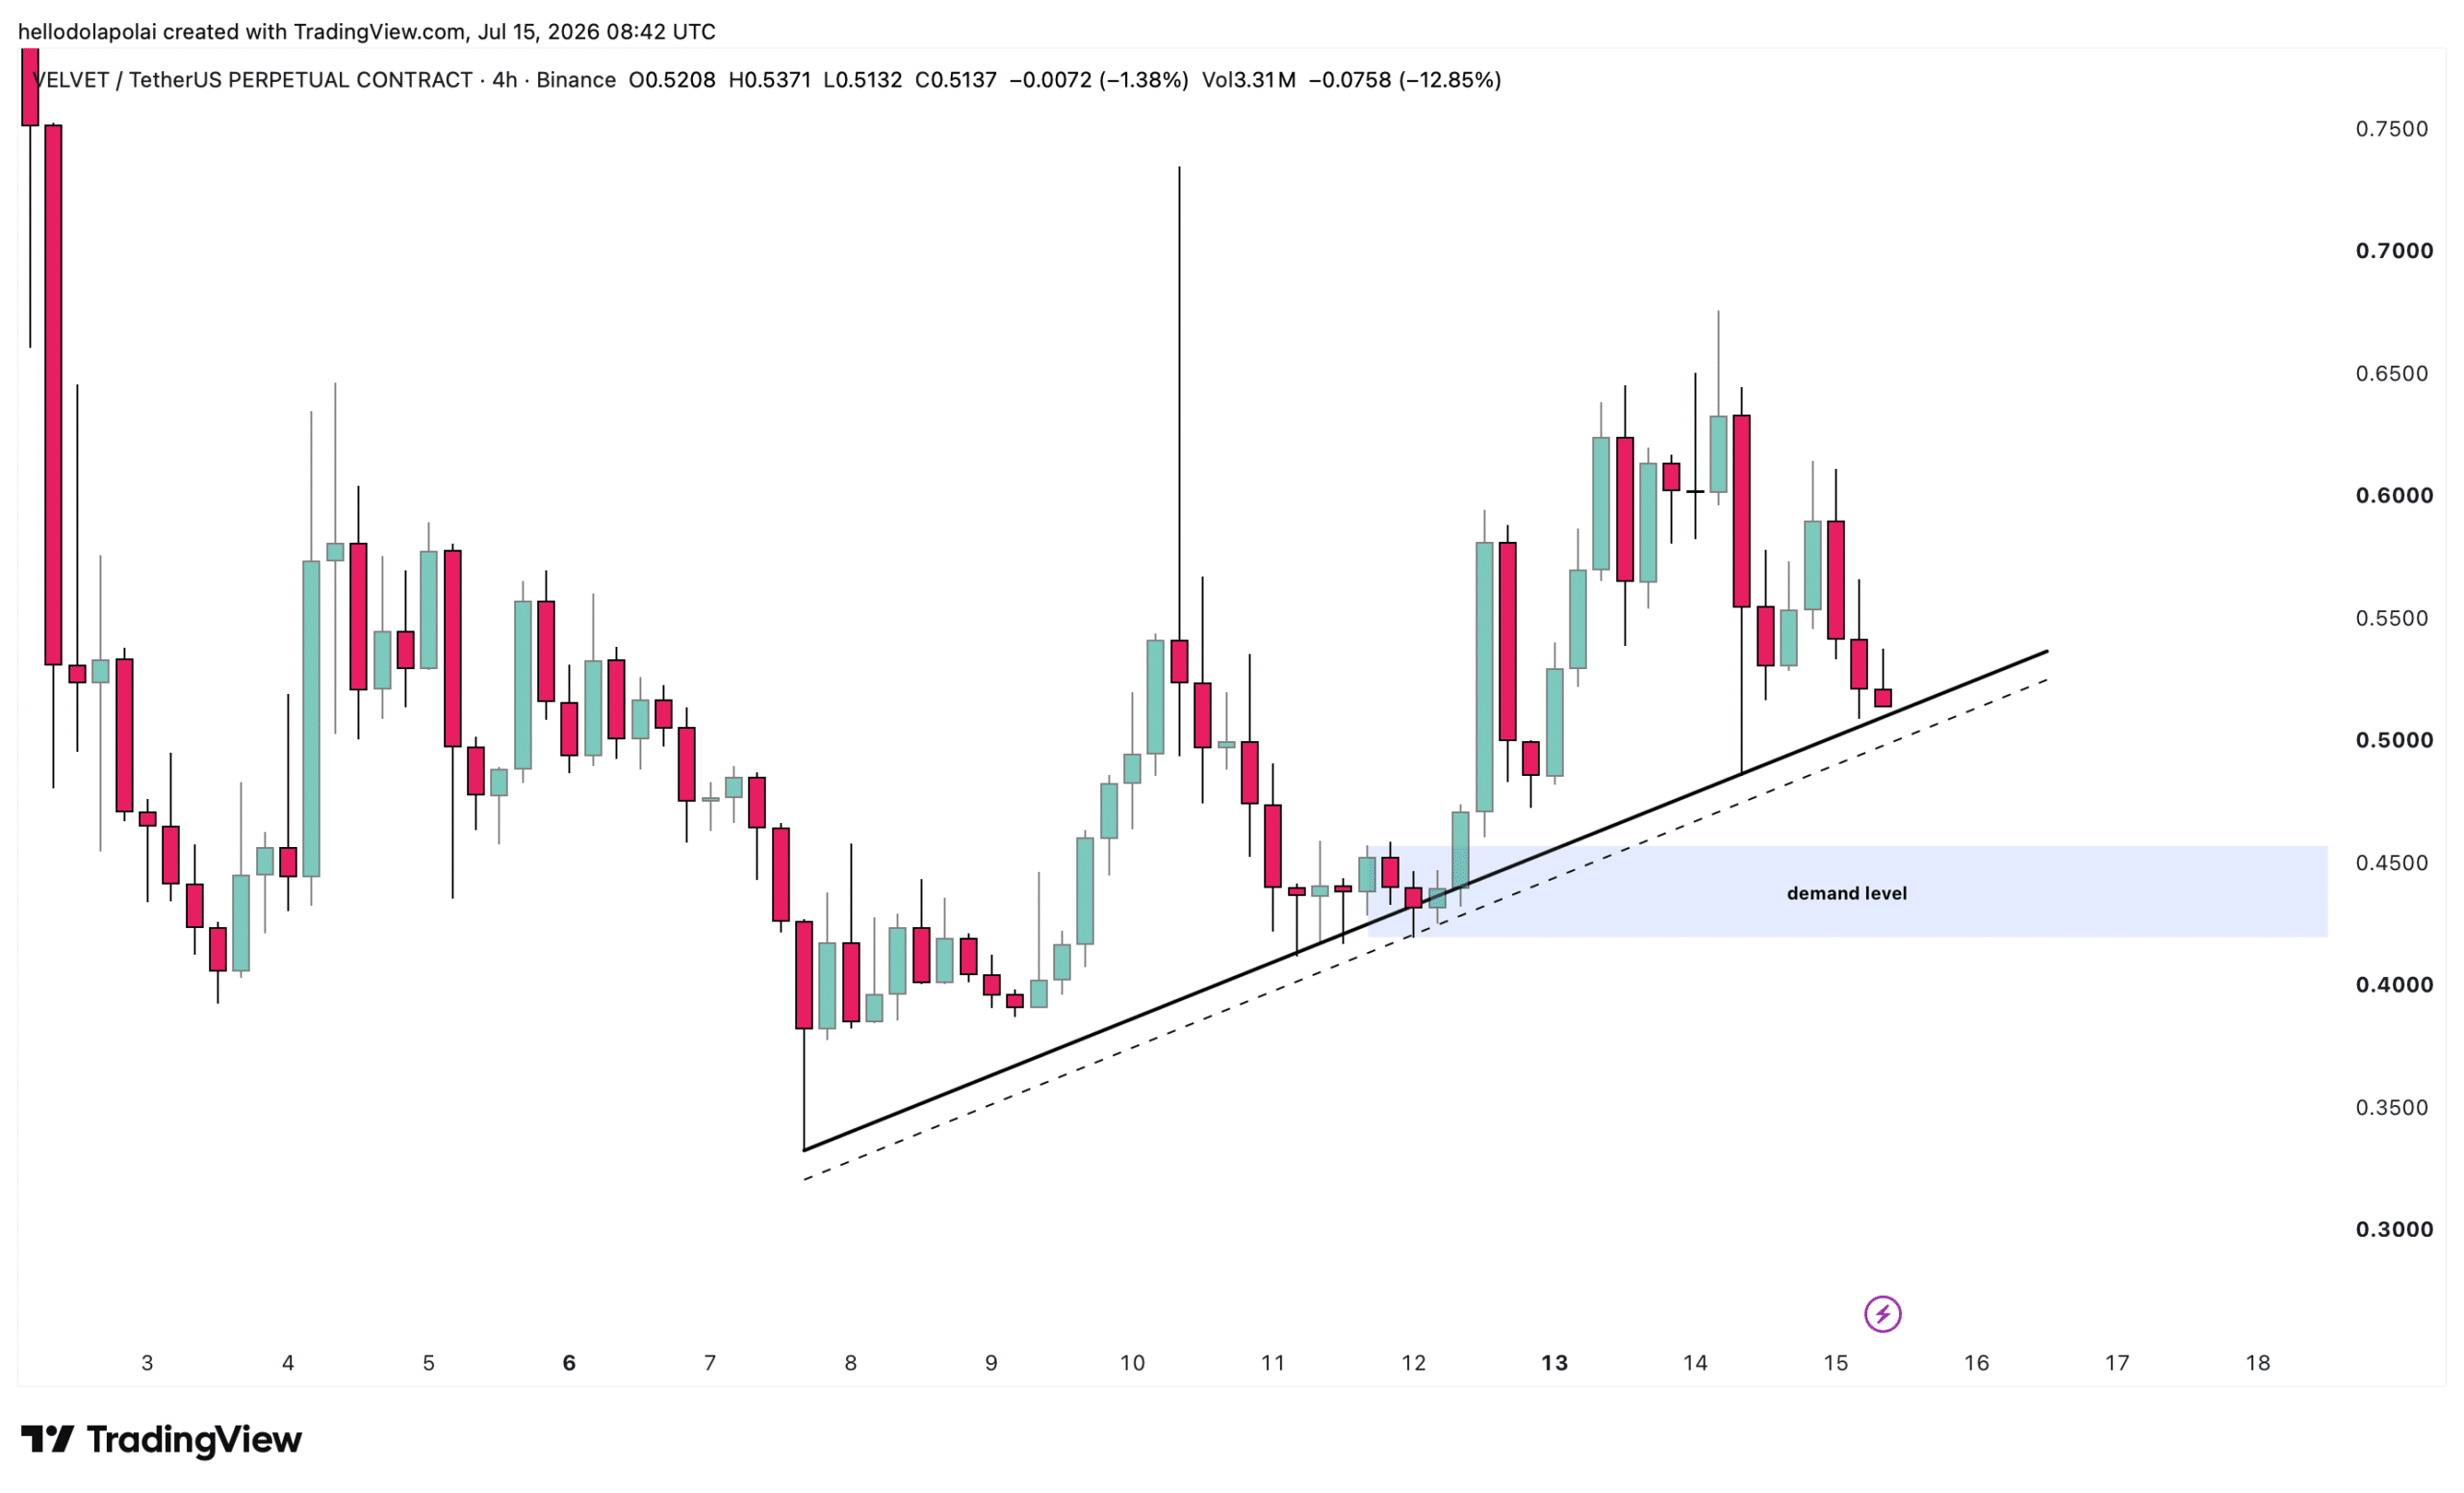
Chart analysis places Velvet a single key level away from either staging a rebound or extending its slide.

That read stems from price trading into an ascending support line that has powered rebounds on multiple occasions, at least three times so far.

A breakdown from this level could send Velvet tumbling once more toward $0.45, where a key demand zone sits and could serve as a rebound catalyst.
Source: TradingView

Should the ascending support hold instead, Velvet’s rebound could already be taking shape. The support level remains the chart’s decisive area to watch for the next move.


Final Summary

  • Velvet fell roughly 18% in a single day, but it remains one of the market’s top performers over the past three months, gaining 571% in 90 days and beating every other top-100 token.
  • $24 million left the perpetual market over 2 weeks, yet longs still control the balance.

Trending Cryptos

Related Questions

QAccording to the article, what was the percentage decline of VELVET over the past day?

AVELVET declined roughly 18% over the past day.

QHow much has VELVET gained over the past 90 days, and how does this compare to other assets?

AVELVET has gained 571% over the past 90 days, outpacing every other asset in the top 100 by market capitalization. The next-best performer, Audiera [BEAT], gained 530%.

QWhat does the net outflow of approximately $24 million from VELVET's perpetual Futures market over two weeks indicate?

AThe $24 million net outflow indicates that capital is leaving the market, which typically reflects bearish sentiment and profit-taking by investors.

QDespite the capital outflow, what does the Funding Rate data suggest about trader sentiment in VELVET's perpetual market?

AThe Funding Rate data, which reached 0.0044%, suggests that longs still maintain command of the market balance, indicating a prevailing bullish outlook among traders.

QWhat is the key chart level that will determine whether VELVET rebounds or continues to slide lower?

AThe key level is an ascending support line. If it holds, a rebound is likely. A breakdown could send the price tumbling toward the next significant demand zone around $0.45.

Related Reads

Gold Rush Handbook | Rialto Teams Up with Robinhood Crypto, Targeting Order Routing Rights

**Summary** Rialto is positioning itself as an on-chain spot exchange focused on order routing and execution quality for a range of assets, including cryptocurrencies and tokenized stocks/ETFs. It operates primarily on the Robinhood Chain network. Its core mechanism revolves around **propAMMs** – on-chain market makers that use proprietary inventory and pricing logic, referencing external markets (like underlying stock exchanges for tokenized equities) rather than relying solely on automated market maker (AMM) formulas. For each user order, Rialto's aggregator solicits real-time quotes from multiple liquidity sources, including its own propAMM (Rivo Altus) and traditional DEX pools. It then selects and atomically executes the path offering the best net output after costs, potentially splitting orders across sources. Rialto's key competitive claim is turning **order routing control into a service for better execution**. Instead of users manually finding the best liquidity, the system automatically compares and routes to the optimal source(s) for each trade. It has launched a partner program for integrations and its swap API is already used by several protocols. Challenges ahead include expanding the asset base on Robinhood Chain, ensuring Rivo Altus's price competitiveness, attracting diverse external liquidity, and consistently delivering superior net execution compared to manual routing. Success in these areas would see Rialto competing for the crucial "order routing right" in the emerging on-chain market for tokenized real-world assets.

Foresight News17m ago

Gold Rush Handbook | Rialto Teams Up with Robinhood Crypto, Targeting Order Routing Rights

Foresight News17m ago

Bitwise: RWA and Prediction Markets Continue to Gain Momentum, Crypto is Bottoming Out

Bitwise's Q2 2026 report highlights a challenging crypto market. The Bitwise 10 Crypto Index fell 15.4%, and spot Bitcoin ETFs saw a record $4.9 billion in quarterly outflows as Bitcoin dropped below $60,000. Overall sentiment is described as one of the worst in eight years. Despite the downturn, key sectors show resilience and growth. Real-World Asset (RWA) tokenization reached a record $33 billion, up 45% year-to-date. Prediction markets also hit new highs, with open interest at $1.8 billion and quarterly volume hitting $43 billion, driven partly by political events. Crypto equities outperformed, with the Bitwise Crypto Innovators 30 Index rising 30.6%, largely fueled by AI-related Bitcoin miners. These stocks exhibited low correlation with other major asset classes. Major DeFi protocols like Aave demonstrated strong revenue generation, with the top ten crypto applications collectively earning $5.9 billion over the past year. The report notes that while prices and on-chain activity are down from peaks, fundamental metrics like stablecoin supply (~$300B) and Ethereum transaction activity are significantly higher than at the 2022 bear market bottom. Key Q3 factors include the fate of the CLARITY Act, final rules for the GENIUS stablecoin act, and policy signals from the new Fed Chair. The conclusion is that the industry is building a stronger foundation—with greater adoption, institutional involvement, and real utility—even at depressed prices, setting the stage for the next cycle.

Odaily星球日报43m ago

Bitwise: RWA and Prediction Markets Continue to Gain Momentum, Crypto is Bottoming Out

Odaily星球日报43m ago

Bitcoin Shifts to Building a Bottom, with Selling Pressure from Long-Term Holders Significantly Easing

Bitcoin is transitioning into a basing phase, with significant selling pressure from long-term holders showing signs of easing. The market is testing overhead resistance, with Bitcoin responding more positively to favorable macro data like soft inflation reports than major equity indices. Its correlation with stocks is weakening while its inverse relationship with the US dollar strengthens, indicating a shift in primary drivers towards liquidity factors rather than risk sentiment. On-chain analysis reveals that long-term holder profit-taking has largely dried up, and the wave of capitulation selling from this cohort has peaked and begun to recede. Buyers successfully absorbed selling pressure at the June lows. Bitcoin currently trades between the network's average realized price (a support floor) and the short-term holder cost basis near $69k, which will be a key resistance level. A breakout above this level is needed to signal a more sustained recovery. In derivatives markets, traders are unwinding bearish bets, with put/call ratios falling and crash protection premiums declining. However, this futures and options positioning adjustment has not been accompanied by significant spot buying. US spot ETF outflows have slowed but not reversed. Volatility has compressed to low levels. In summary, the foundations for a bottom are forming: long-term holder selling is subsiding, demand absorbed the recent low, and the market is reacting to positive catalysts. However, confirmation is still lacking, requiring a spot-driven breakout and hold above the short-term holder cost basis around $69k.

Foresight News51m ago

Bitcoin Shifts to Building a Bottom, with Selling Pressure from Long-Term Holders Significantly Easing

Foresight News51m ago

Trading

Spot

Hot Articles

How to Buy DATA

Welcome to HTX.com! We've made purchasing DATA Network (DATA) simple and convenient. Follow our step-by-step guide to embark on your crypto journey.Step 1: Create Your HTX AccountUse your email or phone number to sign up for a free account on HTX. Experience a hassle-free registration journey and unlock all features.Get My AccountStep 2: Go to Buy Crypto and Choose Your Payment MethodCredit/Debit Card: Use your Visa or Mastercard to buy DATA Network (DATA) instantly.Balance: Use funds from your HTX account balance to trade seamlessly.Third Parties: We've added popular payment methods such as Google Pay and Apple Pay to enhance convenience.P2P: Trade directly with other users on HTX.Over-the-Counter (OTC): We offer tailor-made services and competitive exchange rates for traders.Step 3: Store Your DATA Network (DATA)After purchasing your DATA Network (DATA), store it in your HTX account. Alternatively, you can send it elsewhere via blockchain transfer or use it to trade other cryptocurrencies.Step 4: Trade DATA Network (DATA)Easily trade DATA Network (DATA) on HTX's spot market. Simply access your account, select your trading pair, execute your trades, and monitor in real-time. We offer a user-friendly experience for both beginners and seasoned traders.

361 Total ViewsPublished 2026.07.01Updated 2026.07.01

How to Buy DATA

Discussions

Welcome to the HTX Community. Here, you can stay informed about the latest platform developments and gain access to professional market insights. Users' opinions on the price of DATA (DATA) are presented below.

活动图片