Decred breaks multi-month downtrend – Can DCR hit $16.68 next?

ambcryptoPublished on 2026-07-13Last updated on 2026-07-13

Abstract

Decred (DCR) surged 24% in 24 hours, breaking a multi-month downtrend and drawing renewed market attention with trading volume spiking over 400%. Despite the sharp price rise, data showed sellers remained active, though buyers absorbed the pressure. The rally featured increased whale-sized orders, indicating stronger institutional participation. Technically, DCR broke above a key descending channel and rebounded from support near $10.67, now targeting the next major resistance at $16.68. The Relative Strength Index entered overbought territory, signaling strong buying but potential short-term exhaustion. For the recovery to continue toward $16.68, buyers must sustain momentum and defend the breakout level against persistent selling pressure.

Decred [DCR] surged 24.03% over the past 24 hours at press time and attracted renewed market attention after buyers returned aggressively. Daily trading volume jumped 400.65% to roughly $8.3 million, while market capitalization climbed 24.07% to $242.93 million.

Those gains reflected stronger participation rather than isolated buying activity. Investors also returned after DCR spent months trading inside a persistent downtrend. As a result, the rally shifted market sentiment and placed the token among the strongest performers during the session.

Even so, higher trading activity alone did not confirm that buyers had gained complete control. Instead, the rapid expansion in volume suggested the market had entered a decisive phase where both buyers and sellers actively competed for direction.

Selling pressure lingered beneath the rally

Despite the impressive price recovery, spot market positioning painted a more balanced picture.

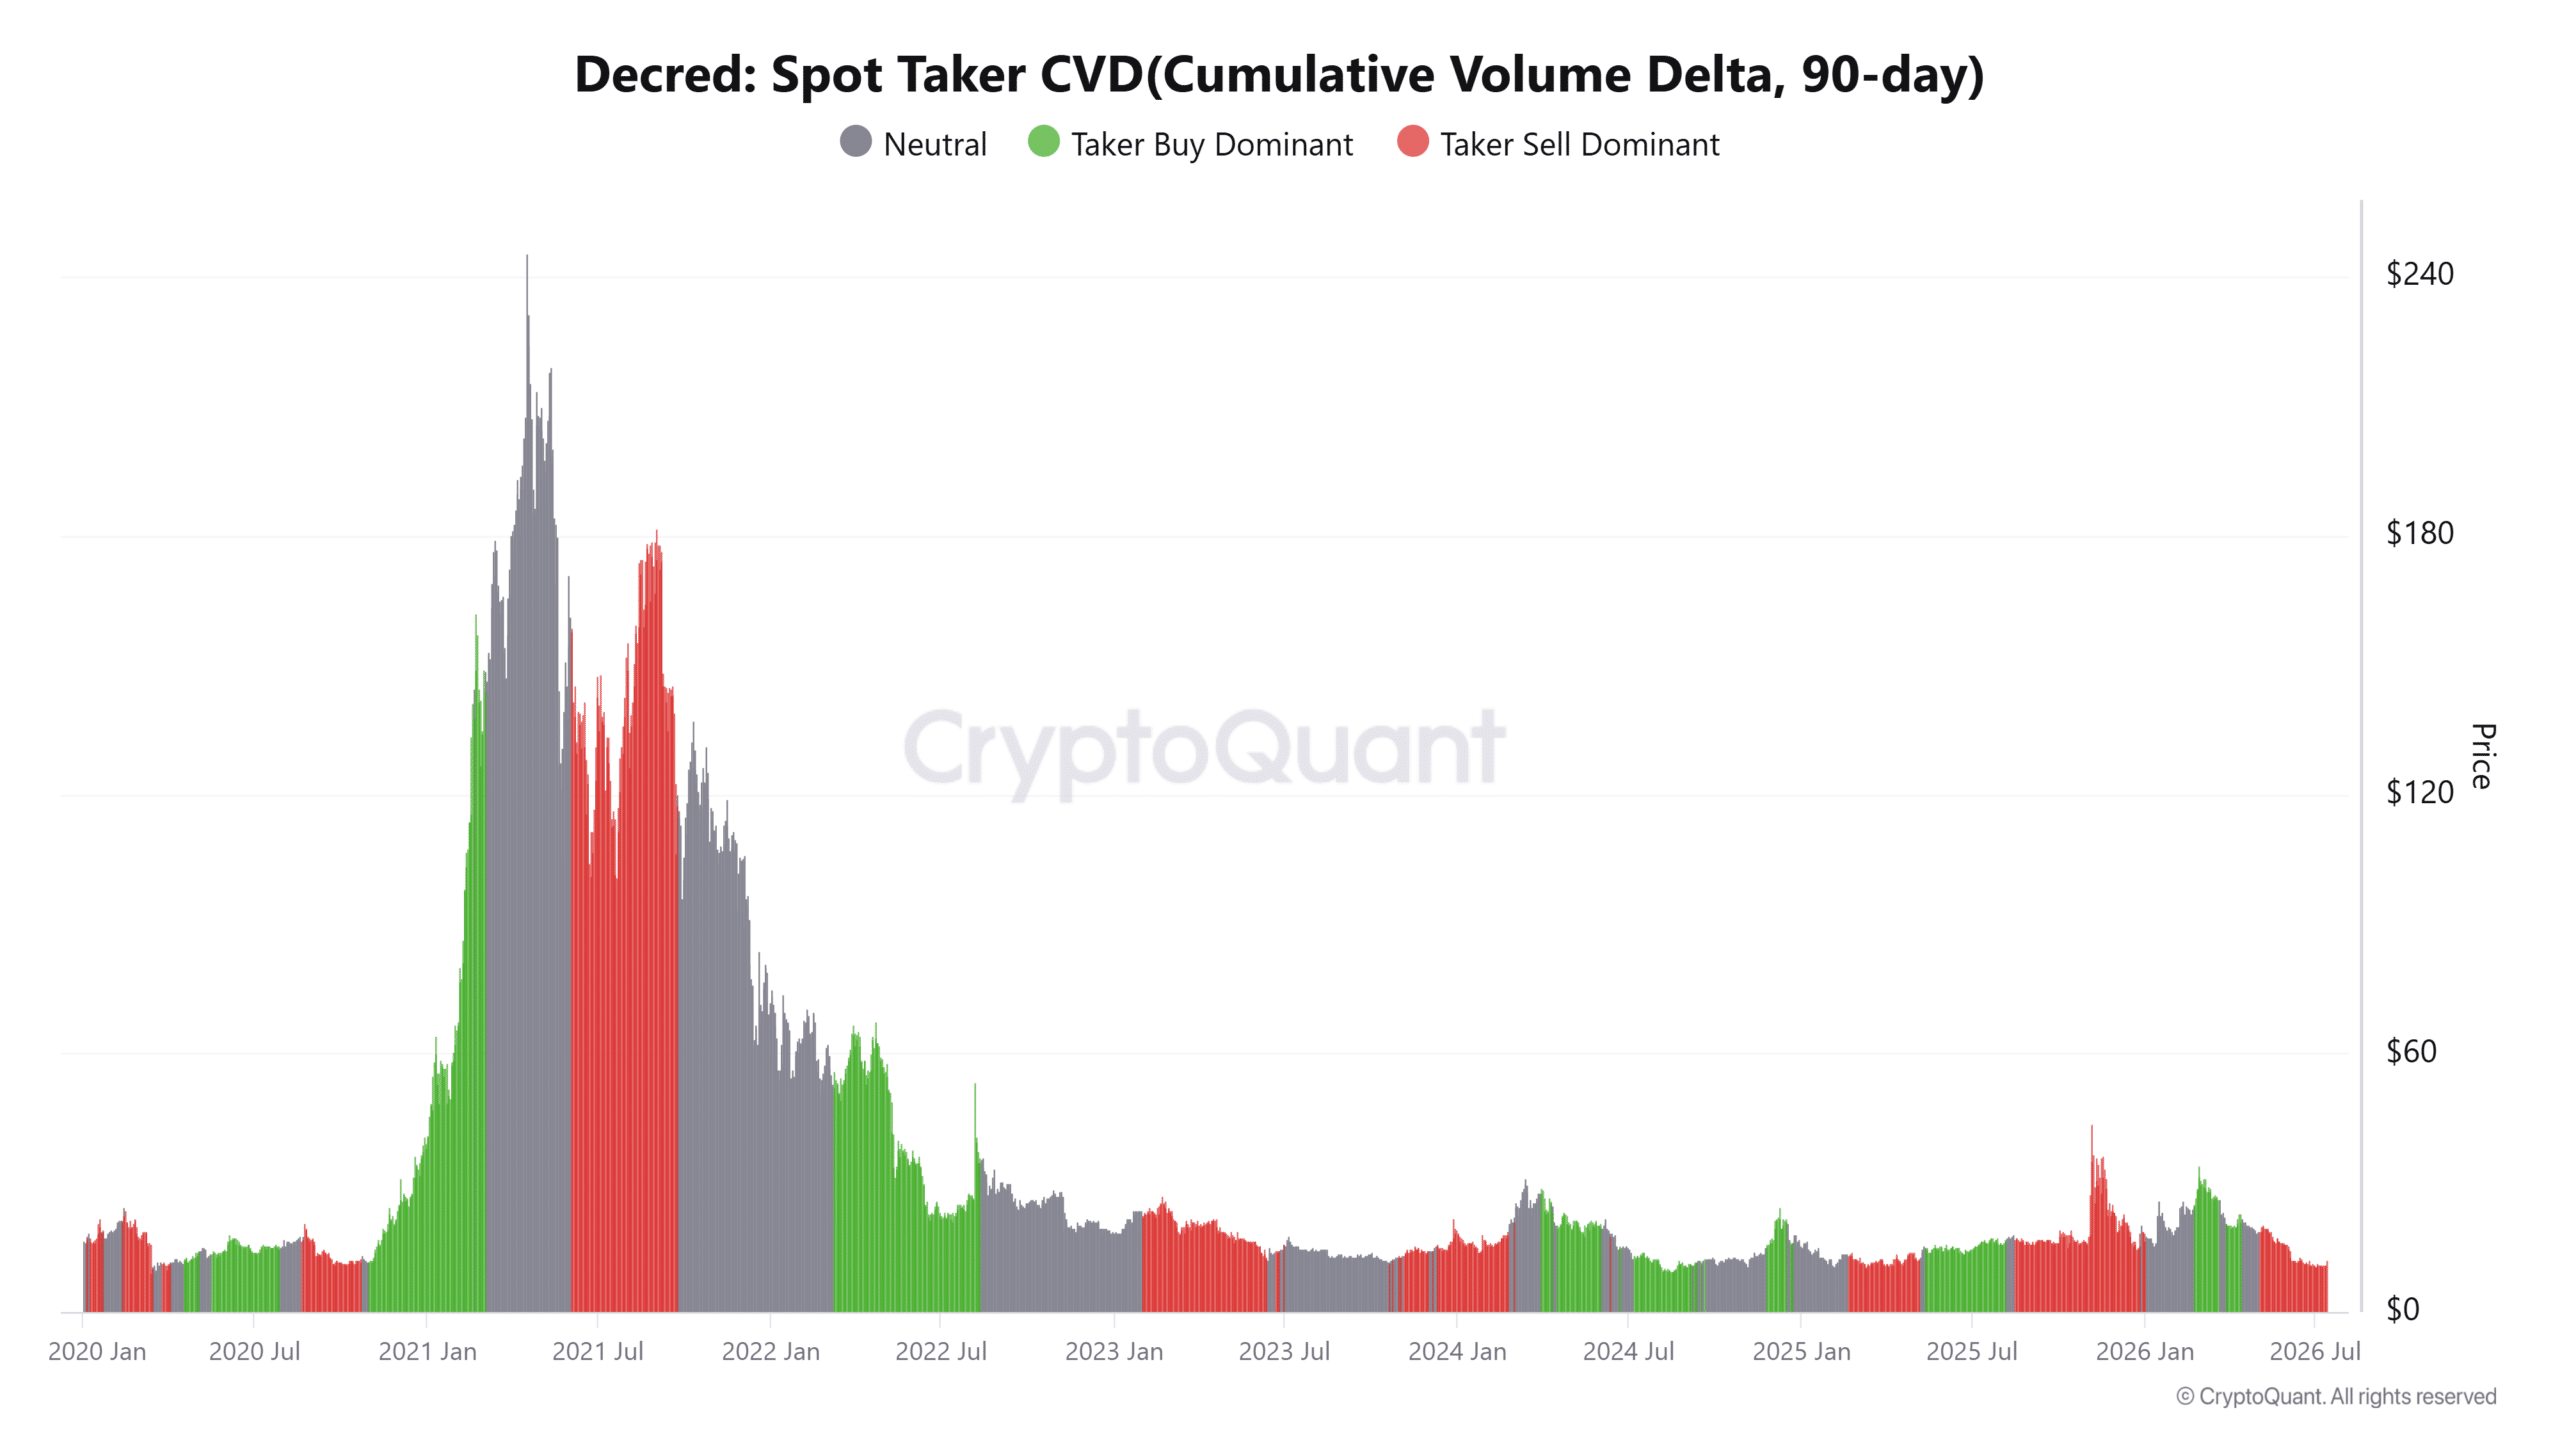
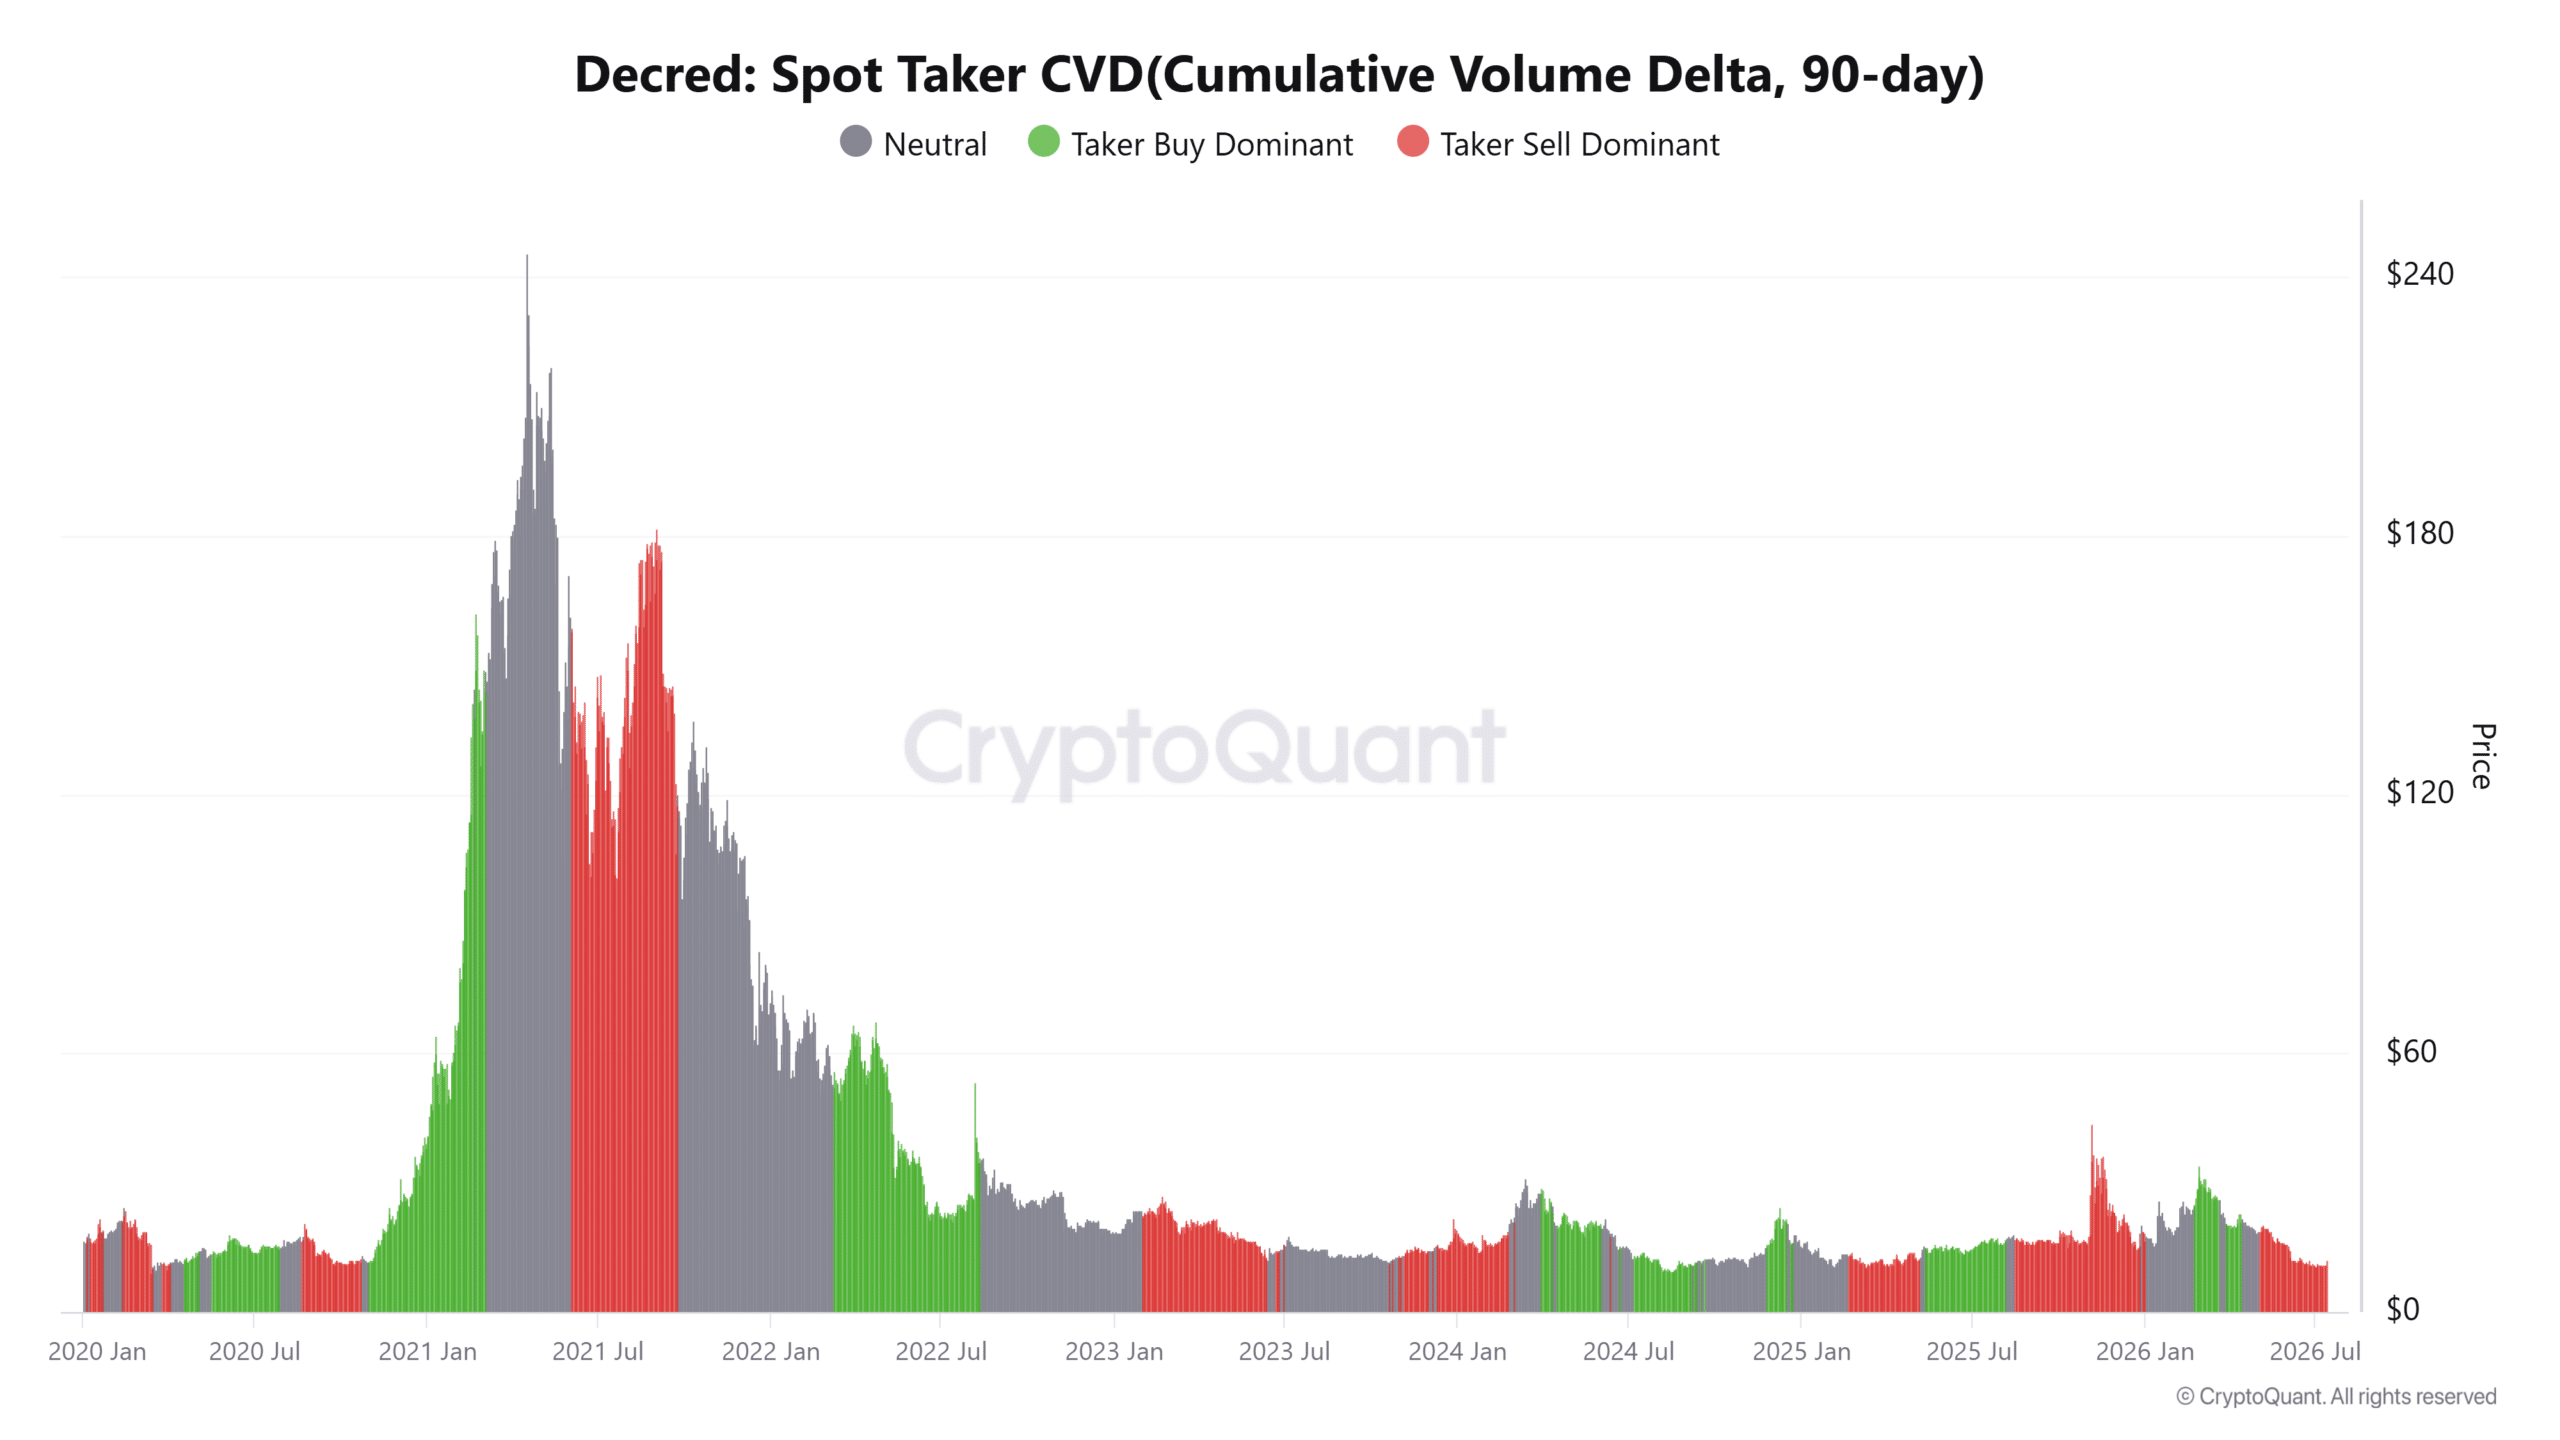
The 90-day Spot Taker Cumulative Volume Delta remained seller-dominant, indicating market sell orders continued to exceed aggressive buy orders throughout the broader period. Such a reading highlighted that sellers still entered positions even as the price advanced sharply. However, buyers absorbed much of that supply instead of allowing the rally to reverse immediately.

Such behavior often reflected improving demand because sustained buying managed to offset continuous selling pressure. Even so, the indicator showed that bullish conviction had not become one-sided. If aggressive selling continues to increase near higher price levels, DCR could face stronger resistance before extending its recovery.
Source: CryptoQuant

Large orders hinted at stronger market conviction

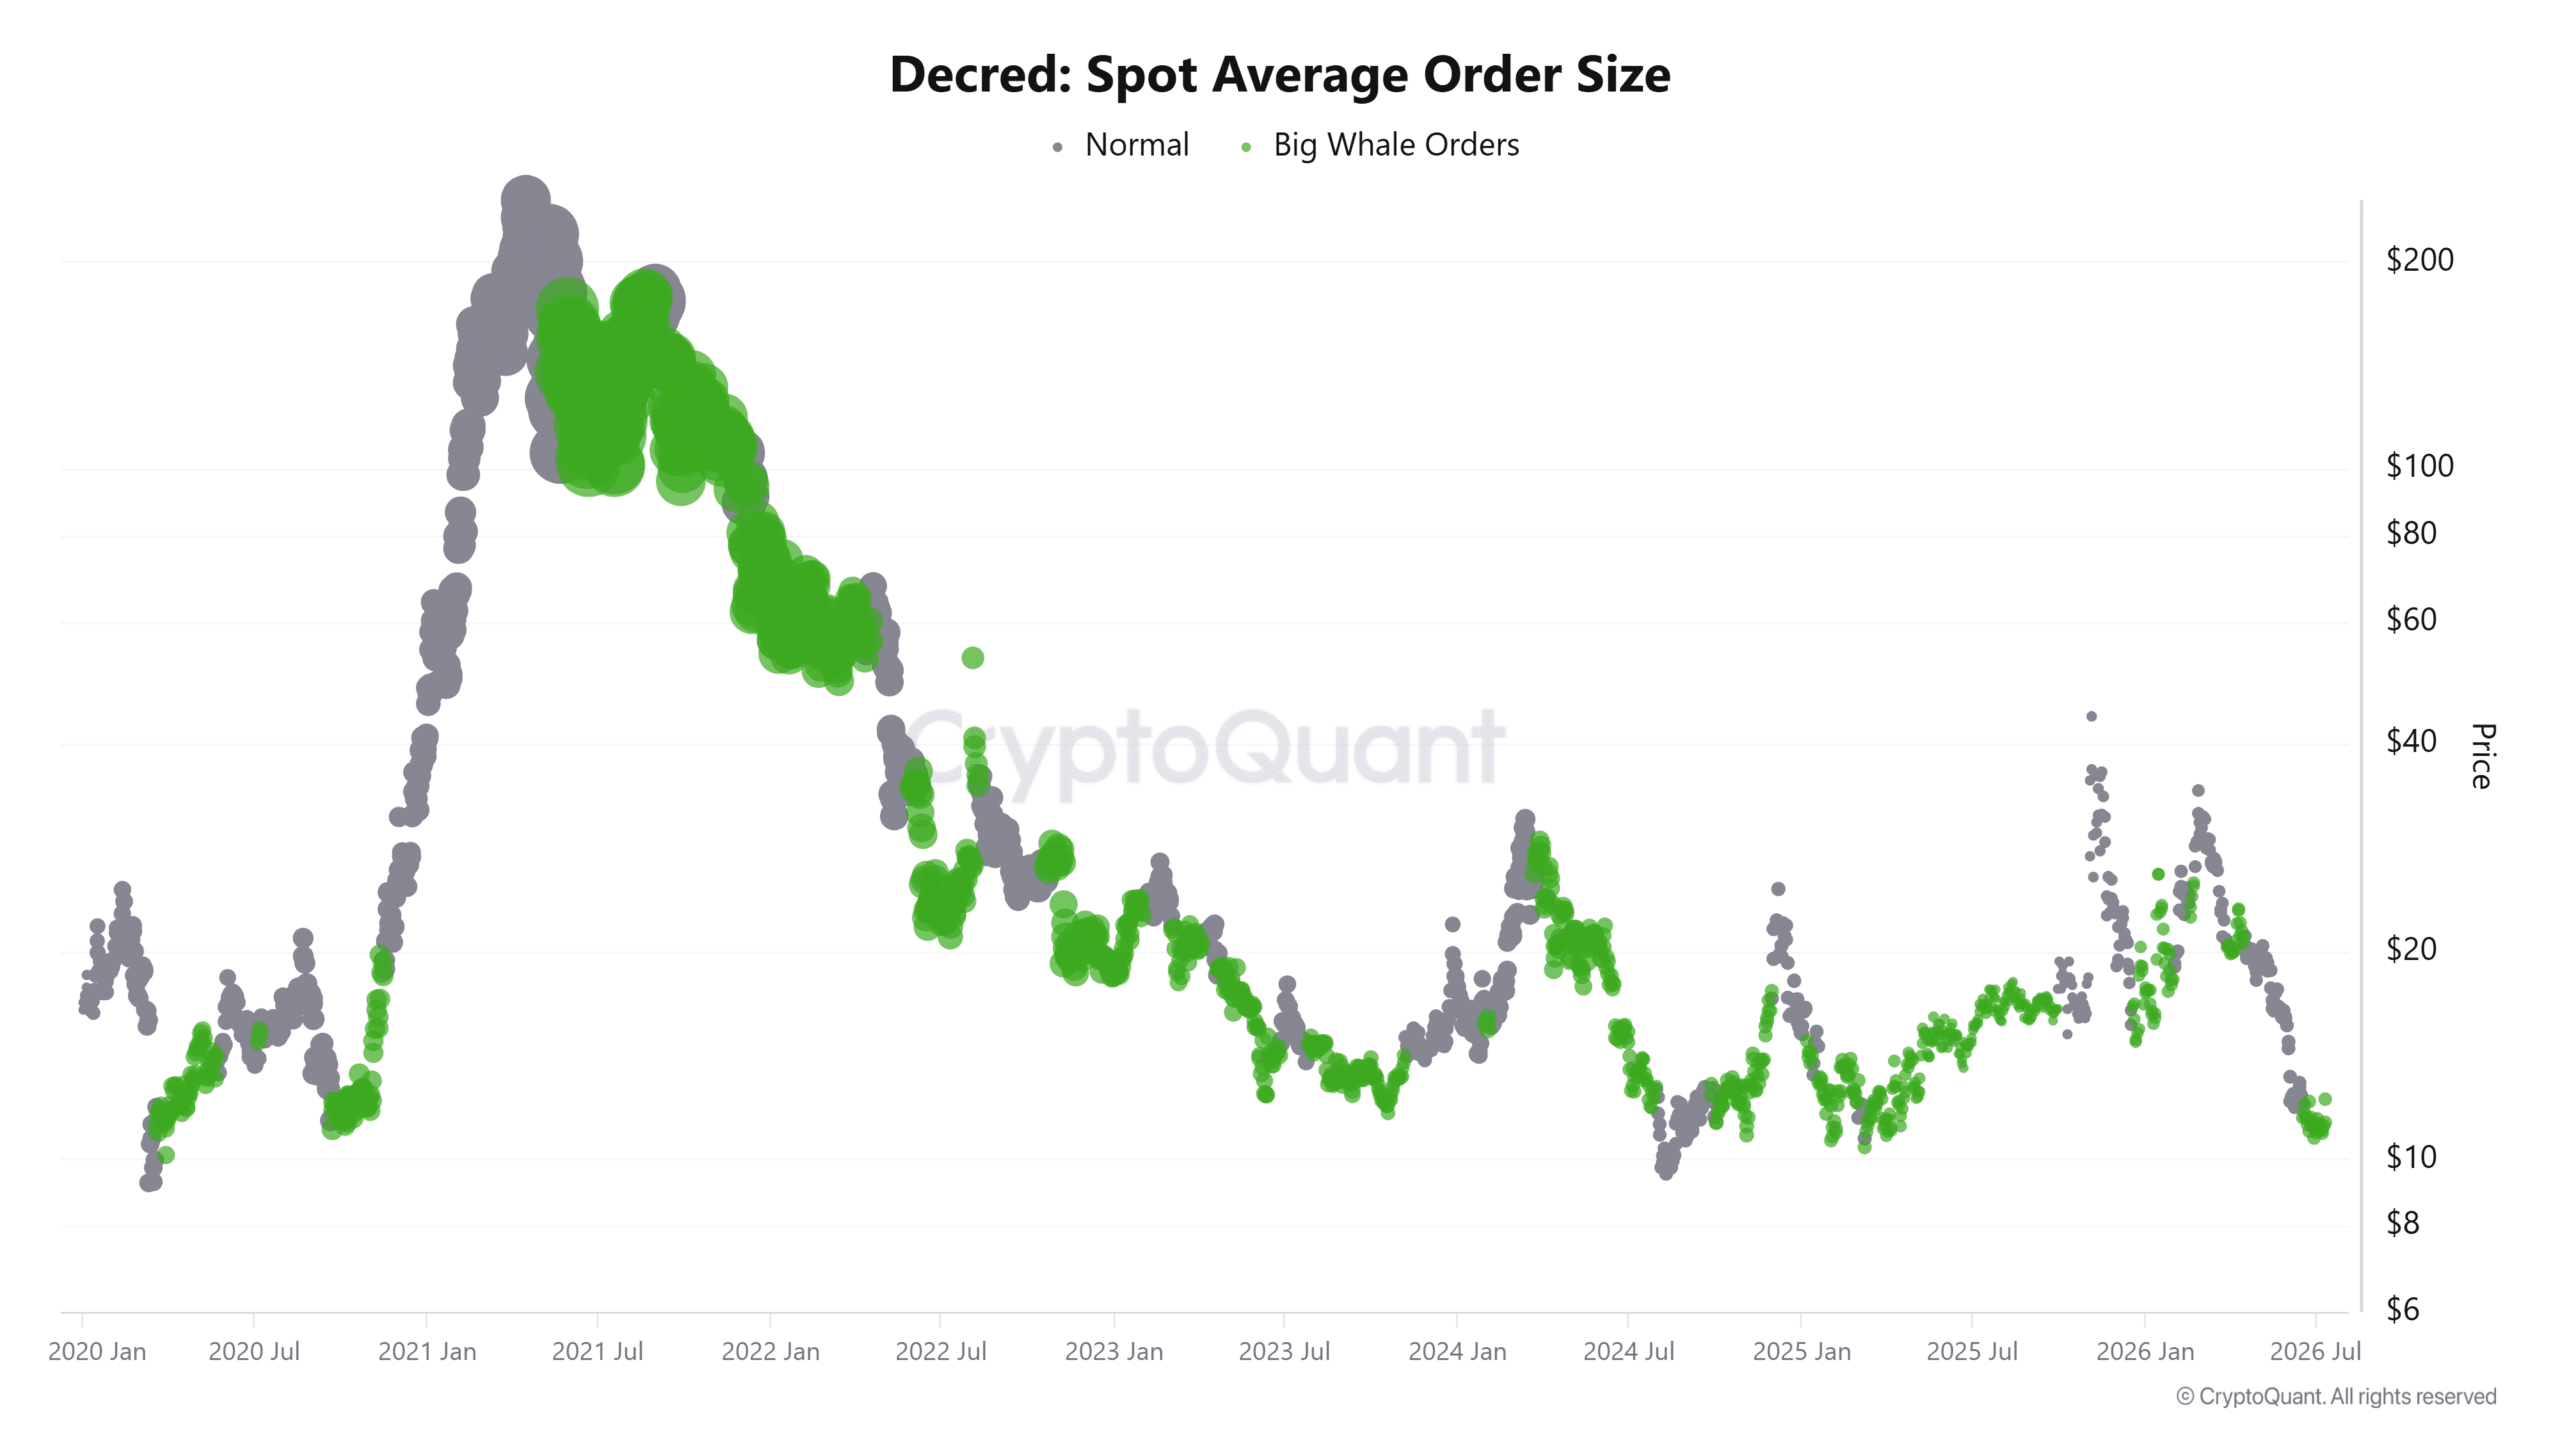
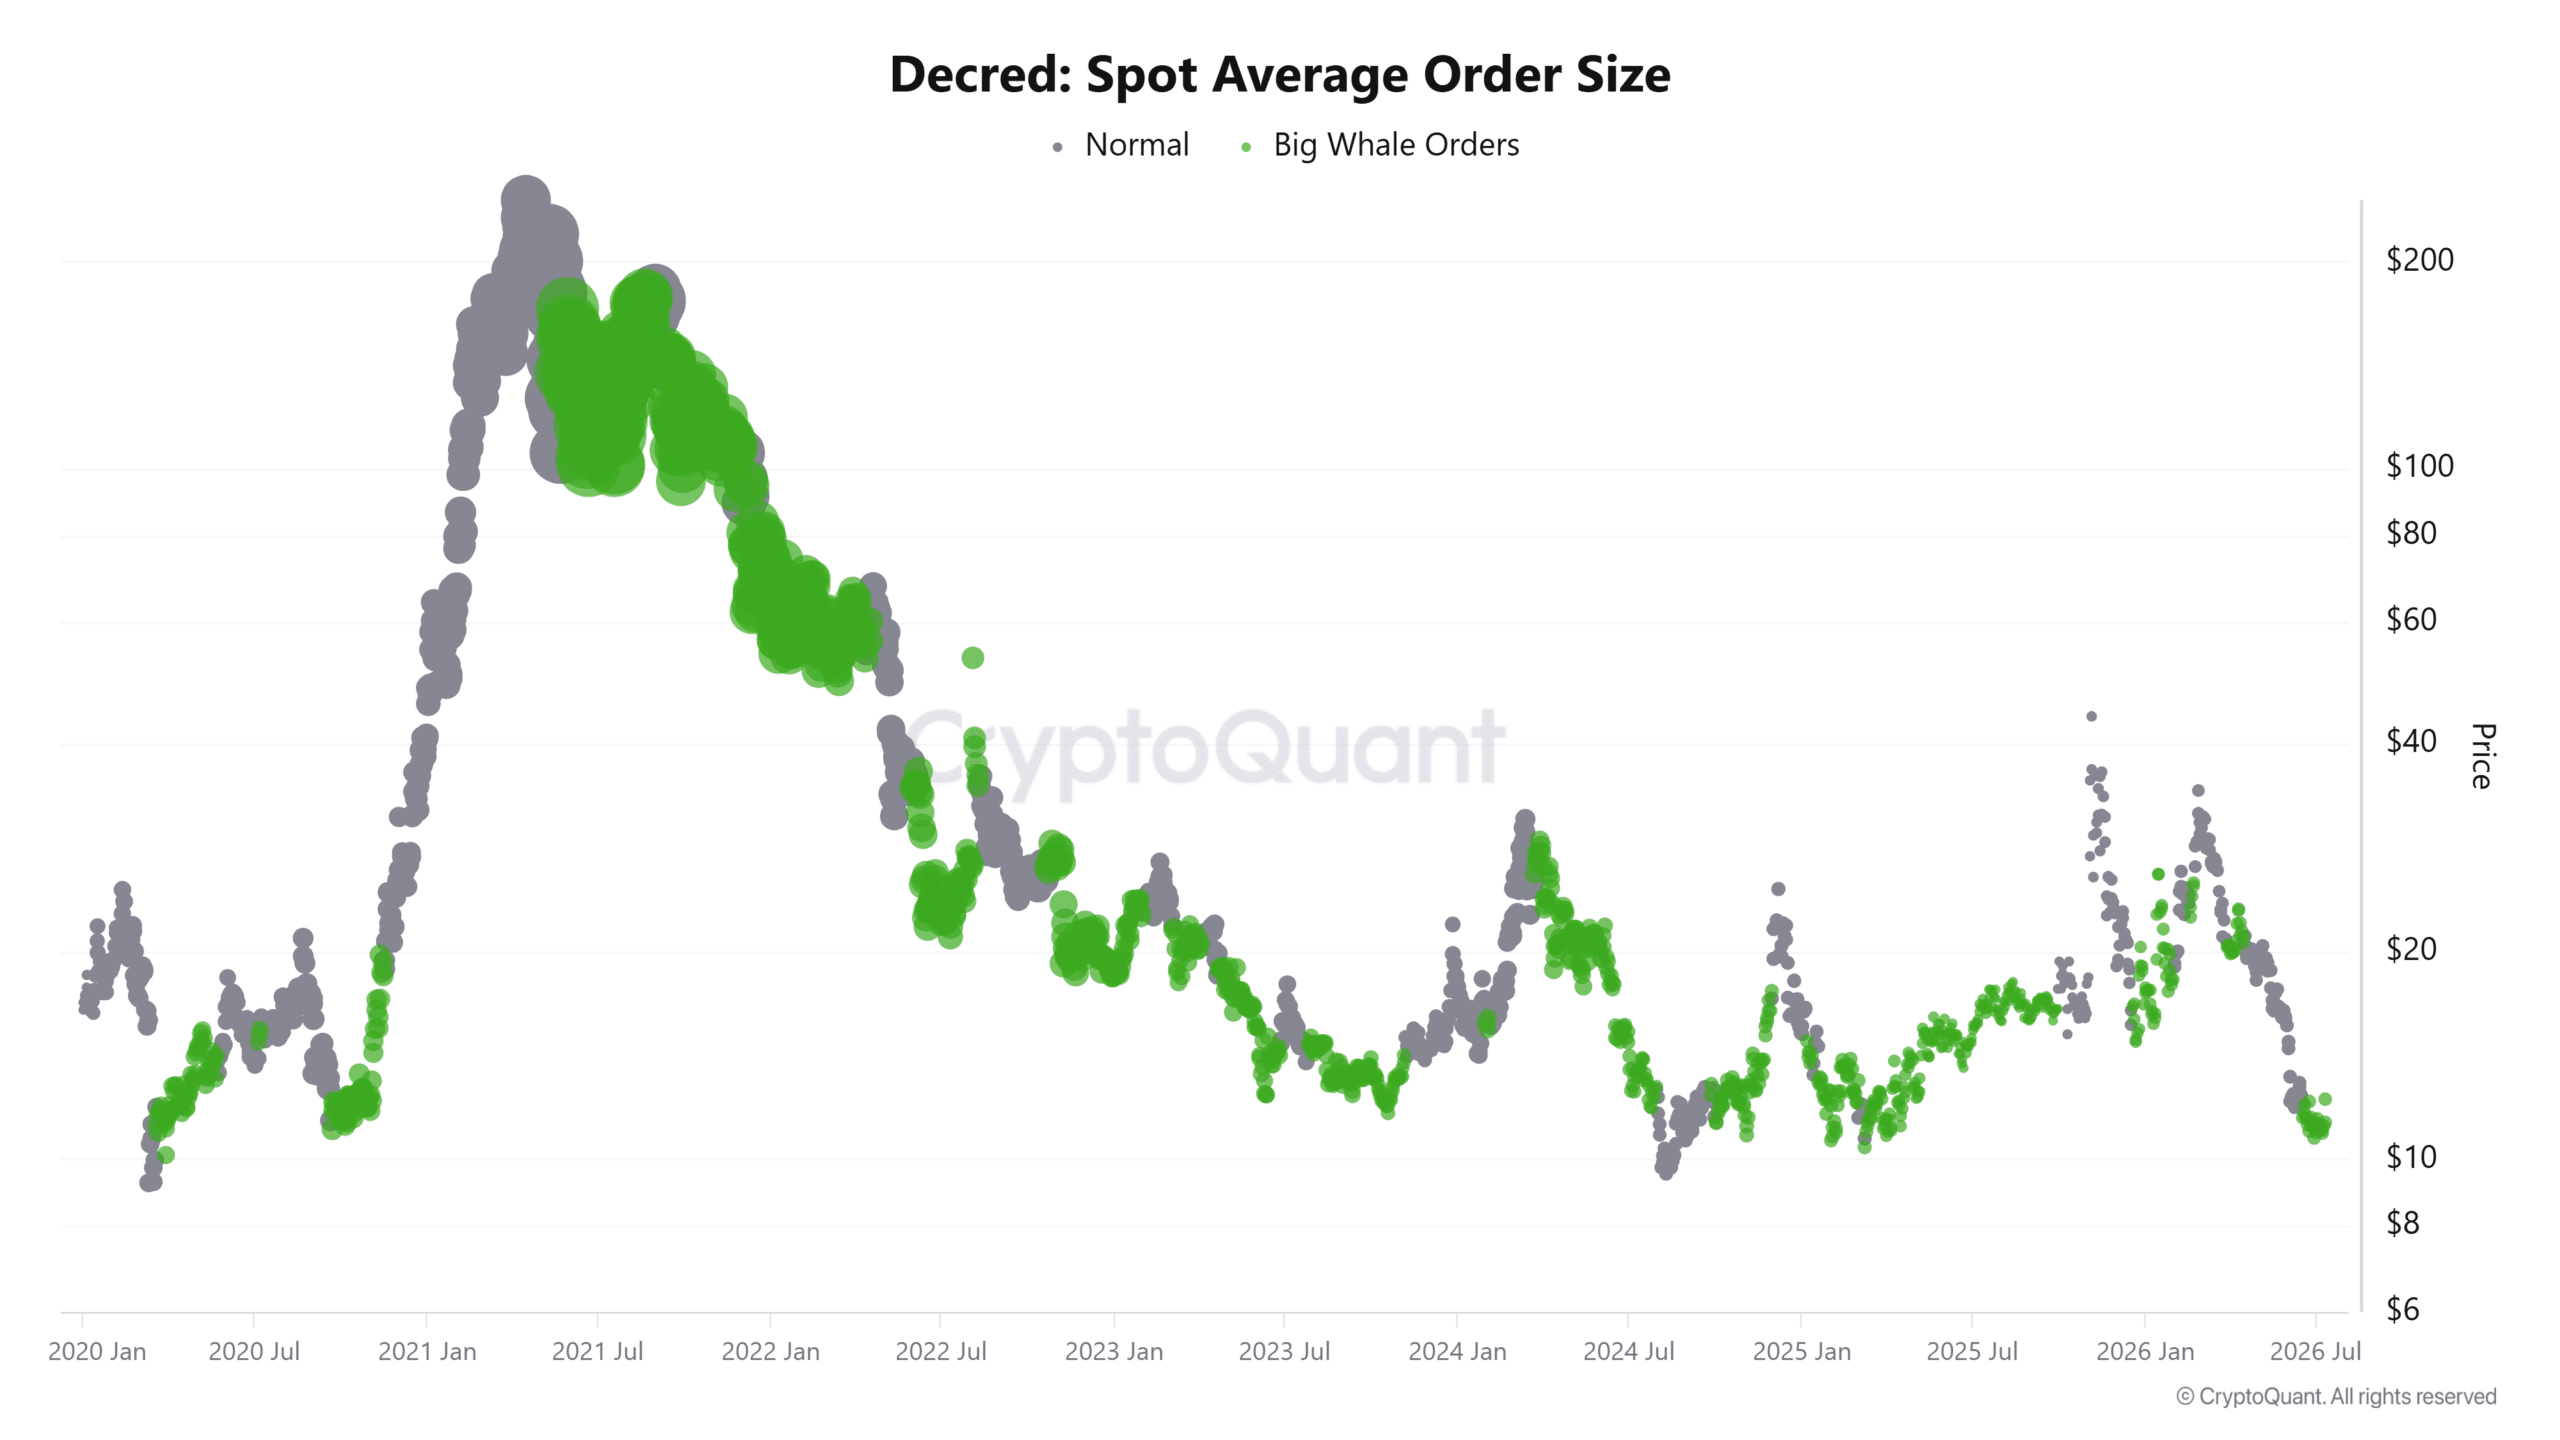
Spot Average Order Size showed the appearance of big whale orders during the rally, revealing that larger participants had become increasingly active. This development aligned with the sharp increase in trading volume instead of contradicting it.

Larger transactions generally reflected stronger capital deployment than retail-driven activity. Although the indicator did not reveal whether every order represented buying or selling, it confirmed institutional-scale participation had increased.

Such participation often carried greater influence over short-term price direction because larger orders absorbed liquidity more efficiently. As interest from bigger players expanded, Decred attracted broader market attention.

Even so, continued participation from these traders would remain necessary if buyers intend to sustain the recent advance.
Source: CryptoQuant

Channel breakout shifted DCR’s technical outlook

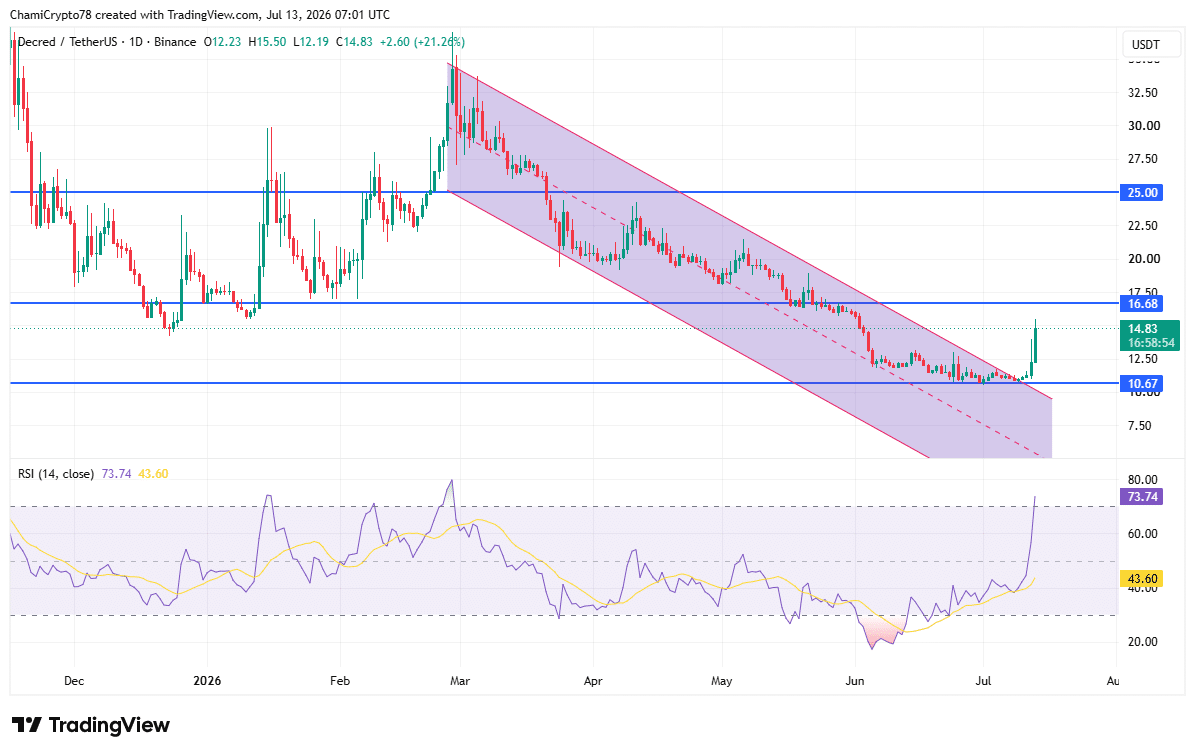
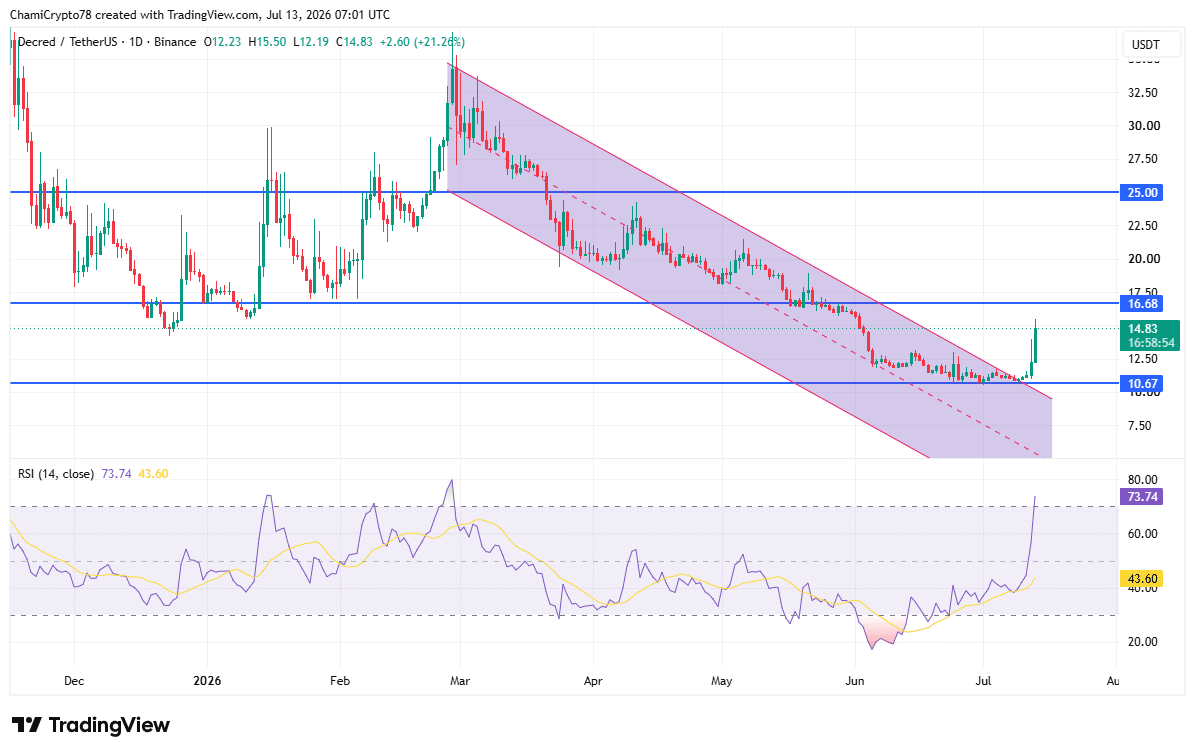
DCR broke above its multi-month descending channel after spending several months respecting lower highs and lower lows. The breakout marked the first decisive violation of the bearish structure visible on the daily chart. Price also rebounded strongly from support near $10.67 before climbing toward the next major resistance at $16.68.

Meanwhile, the Relative Strength Index reached 73.74 as of writing, placing the indicator inside the overbought territory after a sharp rise from neutral conditions. Such readings typically indicate exceptionally strong buying activity, but they also warn of potential short-term exhaustion.

Even so, the breakout remained technically significant because the price closed above the descending channel rather than rejecting from its upper boundary. If buyers defend the breakout zone, DCR could challenge $16.68. Otherwise, profit-taking could trigger a healthy pullback before another attempt higher.
Source: TradingView

Can DCR clear $16.68 next?

Decred’s breakout significantly improved its technical structure after months of sustained weakness.

Rising volume and increased whale-sized orders supported that shift, although seller dominance within Spot Taker CVD showed supply had not disappeared.

If buyers continue absorbing aggressive selling, DCR could reclaim $16.68 and strengthen the recovery. Otherwise, persistent selling pressure near resistance could slow the advance before the next directional move develops.


Final Summary

  • Decred broke its long-term downtrend while rising volume reflected renewed market participation.
  • Seller pressure persisted, yet buyers absorbed supply as DCR approached key resistance near $16.68.


Trending Cryptos

Related Questions

QWhat were the key price and volume metrics for Decred (DCR) over the past 24 hours mentioned in the article?

ADecred (DCR) surged 24.03% over the past 24 hours. Daily trading volume jumped 400.65% to roughly $8.3 million, and its market capitalization climbed 24.07% to $242.93 million.

QWhat does the 90-day Spot Taker Cumulative Volume Delta (CVD) indicate about the market for DCR?

AThe 90-day Spot Taker Cumulative Volume Delta remained seller-dominant, indicating that market sell orders continued to exceed aggressive buy orders over the broader period. This highlights that selling pressure persisted even during the price rally.

QWhat does the increase in Spot Average Order Size for DCR suggest about market participants?

AThe increase in Spot Average Order Size suggests the appearance of big whale orders, revealing that larger participants (institutional-scale traders) had become increasingly active. This reflects stronger capital deployment and greater potential influence over short-term price direction.

QWhat was the significant technical development for DCR on the daily chart, and what are the key price levels mentioned?

ADCR broke above its multi-month descending channel, marking a decisive violation of the bearish structure. The price rebounded from support near $10.67 and is now approaching the next major resistance level at $16.68.

QAccording to the article, what are the two potential scenarios for DCR's price action after the breakout?

AIf buyers continue to absorb aggressive selling pressure, DCR could reclaim the $16.68 resistance level and strengthen the recovery. Otherwise, persistent selling pressure near that resistance could slow the advance, potentially triggering a healthy pullback before another attempt to move higher.

Related Reads

Chip Stocks Lead Gains, Driving Nasdaq Rebound; Dow Hits 53,000 for First Time; Oil and Gold Under Pressure; Bitcoin Surges Following Trump's Statement

On Monday, U.S. stocks rallied with the tech-heavy Nasdaq leading gains, breaking a recent losing streak. The Dow Jones Industrial Average closed above the 53,000 mark for the first time. The rebound was fueled by positive news from AI infrastructure leaders: Nvidia confirmed its server roadmap remains unchanged, and Broadcom announced an extended chip partnership with Apple until 2031. However, Morgan Stanley strategist Mike Wilson warned that the semiconductor sector's trajectory resembles that of silver before a sharp correction, hinting at potential bubble risks. In commodities, oil prices remained under pressure. WTI crude traded flat around $68-$69, while Brent fell to its lowest since late February at $71.75. This weakness followed Saudi Arabia's significant price cut for August cargoes—its largest in at least 26 years—raising concerns about oversupply as OPEC+ agreed to boost production targets starting in August. Gold edged down 0.4% to $4,162 per ounce, pressured by a stronger dollar and hawkish-leaning signals from Federal Reserve officials. Bitcoin reversed early losses to surge about 1.4% to $63,571 after former President Donald Trump publicly declared himself a "big believer in cryptocurrency." This statement countered selling pressure from a major firm's $216 million Bitcoin divestment. In bond markets, the 10-year Treasury yield dipped slightly to 4.47%. The dollar index was largely flat, while USD/JPY rose 0.4% to 162.03, nearing a 40-year high and testing Japan's intervention resolve. European equities dipped slightly, with the STOXX 600 closing down 0.35%, retreating from record highs hit after the strong U.S. jobs data.

华尔街日报36m ago

Chip Stocks Lead Gains, Driving Nasdaq Rebound; Dow Hits 53,000 for First Time; Oil and Gold Under Pressure; Bitcoin Surges Following Trump's Statement

华尔街日报36m ago

Trading

Spot

Hot Articles

How to Buy RE

Welcome to HTX.com! We've made purchasing Re (RE) simple and convenient. Follow our step-by-step guide to embark on your crypto journey.Step 1: Create Your HTX AccountUse your email or phone number to sign up for a free account on HTX. Experience a hassle-free registration journey and unlock all features.Get My AccountStep 2: Go to Buy Crypto and Choose Your Payment MethodCredit/Debit Card: Use your Visa or Mastercard to buy Re (RE) instantly.Balance: Use funds from your HTX account balance to trade seamlessly.Third Parties: We've added popular payment methods such as Google Pay and Apple Pay to enhance convenience.P2P: Trade directly with other users on HTX.Over-the-Counter (OTC): We offer tailor-made services and competitive exchange rates for traders.Step 3: Store Your Re (RE)After purchasing your Re (RE), store it in your HTX account. Alternatively, you can send it elsewhere via blockchain transfer or use it to trade other cryptocurrencies.Step 4: Trade Re (RE)Easily trade Re (RE) on HTX's spot market. Simply access your account, select your trading pair, execute your trades, and monitor in real-time. We offer a user-friendly experience for both beginners and seasoned traders.

1.1k Total ViewsPublished 2026.06.18Updated 2026.06.29

How to Buy RE

Discussions

Welcome to the HTX Community. Here, you can stay informed about the latest platform developments and gain access to professional market insights. Users' opinions on the price of RE (RE) are presented below.

活动图片