Author: Murphy
Since Coinbase's BTC balance is closely related to ETF net inflows/outflows, I focus more on Binance data for short-term observations that are closer to real demand (non-ETF).
Figure 1 shows two significant periods of balance increase from October 21 to November 22, 2025, and January 15 to February 20, 2026, which corresponded to two major declines in BTC price. After November 22, 2025, the balance decreased by 34,145 BTC, and the BTC price stabilized, shifting from a rapid decline to consolidation and a weak rebound.

Figure 1: Binance Exchange BTC Balance
This is similar to the current trend. From February 20, 2026, to the present, Binance's BTC balance has decreased by 25,135 BTC. This period coincides with the U.S.-Iran military tensions, yet the BTC price has largely remained stable, neither falling nor rising significantly.
Is the outflow of BTC from Binance due to real demand? Personally, I believe "yes," or at least "mostly yes."
This can be seen from the structure of "net transfer volume by size." During this period, the main outflows were not from super-large transactions over $10 million but rather from the group transacting between $1 million and $10 million.
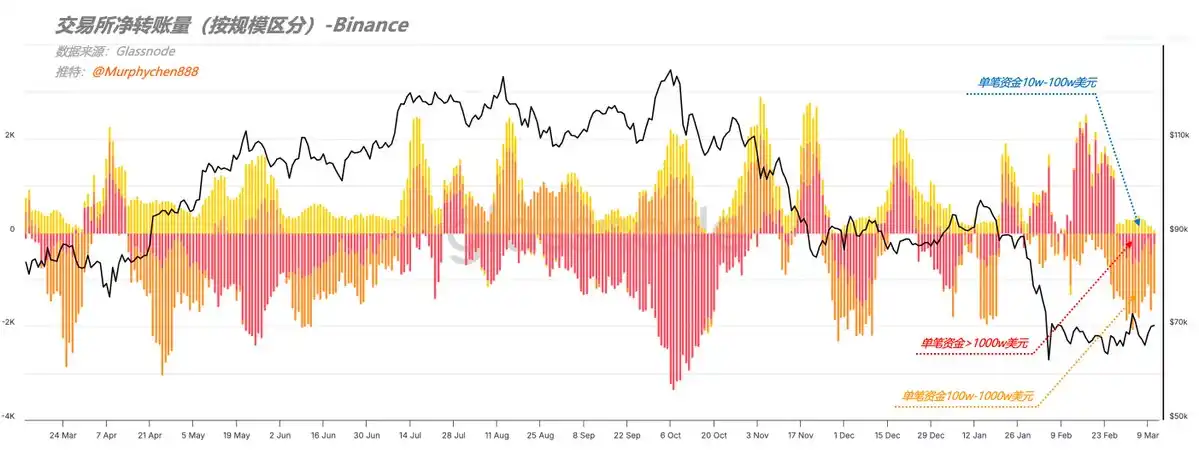
Figure 2: Binance Exchange Net Transfer Volume (by Size)
We know that outflows from super-large transactions often involve market makers, custodians, and other institutional behaviors, while the $1 million to $10 million range is more indicative of high-net-worth investors and individual whale accumulation.
Additionally, the BTC spot volume difference (CVD) on Binance shows a very steep curve. CVD measures the net difference between buy and sell volumes, particularly highlighting the volume difference when buyers or sellers initiate trades actively.

Figure 3: BTC Spot Volume Difference Deviation (Binance)
The algorithm used here compares the 30-day average to the 90-day median deviation, which smooths out daily fluctuations. Thus, a steep curve indicates significantly stronger active buying during this period.
This further supports the above speculation that the current trend is more driven by real on-demand rather than market maker behavior. Additionally, the recent decline in the USDC/USDT exchange rate below 1 suggests stronger demand for USDT as a purchasing power.
This explains why, despite ongoing U.S.-Iran military tensions and employment data exacerbating concerns about economic stagflation/recession, BTC prices have remained largely stable.
Of course, these are only short-term data observations. From a broader perspective, the CVD is still in a overall downward trend on a larger scale, similar to the trend before May 2022.

Figure 4: BTC Spot Volume Difference Deviation (Binance)
After May 2022, the CVD curve began to diverge from the price, with lows gradually rising and moving closer to the 90-day median, indicating a resurgence in active buying and strong demand. However, this will be a prolonged transformation process.
Combined with the cautious attitude of on-chain whale entities toward macroeconomic certainty observed recently, my view is: In the short term,阶段性 demand may support BTC in maintaining consolidation or a weak rebound. However, from a longer-term perspective, the overall trend remains downward. The current demand recovery is still in its early stages, and the mid-term may require a longer structural repair process.