Bitcoin Bulls and Bears Battle Over Key Levels, HYPE Bounce Support Signals Emerge | Guest Analysis

Odaily星球日报Publié le 2026-08-10Dernière mise à jour le 2026-08-10

Résumé

This market analysis provides a technical outlook for Bitcoin (BTC) and HYPE. For Bitcoin, the analysis identifies a potential "c-wave" rebound currently underway from the $62,268 low. The key resistance zone for this move is $65,700-$67,300. A successful break above this area could target $69,500-$71,000. Core support levels are identified at $63,600-$64,000 and $60,950-$61,500. Trading strategies include: 1) Reducing medium-term short positions below 20% if price stabilizes above $63,600, with plans to increase shorts to 50% near the $69,500-$71,000 zone if clear resistance appears; 2) Short-term tactical trades using 30% capital, with specific plans for shorting near the $69,500-$71,000 resistance (Plan A) or buying near the $63,600-$64,000 support (Plan B). For HYPE, the price is seen as finding support at a critical confluence zone: a long-term rising trendline, the lower boundary of a descending channel, and the $50-$52 price area. This has triggered a potential rebound. The immediate resistance is at $58.5-$60, followed by the descending channel's upper boundary. The key test for the rally's strength will be whether it can break this upper channel line. Short-term strategy suggests holding or establishing light long positions in the $50-$52 support zone, with strict stop-loss discipline. The report also includes a review of a previous successful BTC long trade from ~$62,753 to ~$64,183, yielding approximately 2.28%. It emphasizes strict risk management: setting initi...

This week, Bitcoin's daily-level C-wave rebound continues. The price started from the low of $62,268. Whether it can effectively break through the key resistance zone of $65,700~$67,300 is the core validation of the structure this week. HYPE has found support at the confluence area of the long-term ascending trendline, the lower boundary of the descending channel, and the triple support zone of $50~$52. Daily-level bounce signals have initially emerged, but whether it can stabilize and challenge the upper boundary of the descending channel remains to be confirmed. The following is this week's multi-cycle structure review, trading strategies for BTC and HYPE, as well as market validation of last week's short-term trades for reference.

Summary of core trading views this week:

  • BTC Multi-Cycle Trend Structure Analysis (Details in Part 1)
  • BTC Weekly Market Outlook and Medium/Short-Term Trading Strategies (Details in Part 2)
  • HYPE Daily Level Trend Structure Analysis (Details in Part 3)
  • HYPE Weekly Market Outlook and Short-Term Trading Strategies (Details in Part 4)

Market Validation of Last Week's Trading Strategies and Core Views:

  • BTC Market Judgment Validation: Last week's article emphasized that the probability of the daily short-term (B-wave) correction completing and terminating above the $60,900-$61,500 area was significant. Looking now, the actual market movement closely aligns with our prediction.
  • BTC Short-Term Trade Effectiveness: Bitcoin completed one short-term long trade (1x leverage) last week, successfully realizing a profit of approximately 2.28%. (Details in Part 5)
  • HYPE Market Judgment Validation: Last week, we judged that the probability of price stabilizing and stopping its decline in the $50~$52 area was high. The current actual price action has effectively validated this view.

1. Bitcoin Multi-Cycle Trend Structure Analysis

1、Bitcoin Daily Level Trend Structure Analysis: (Based on analysis of market action after May 6th)
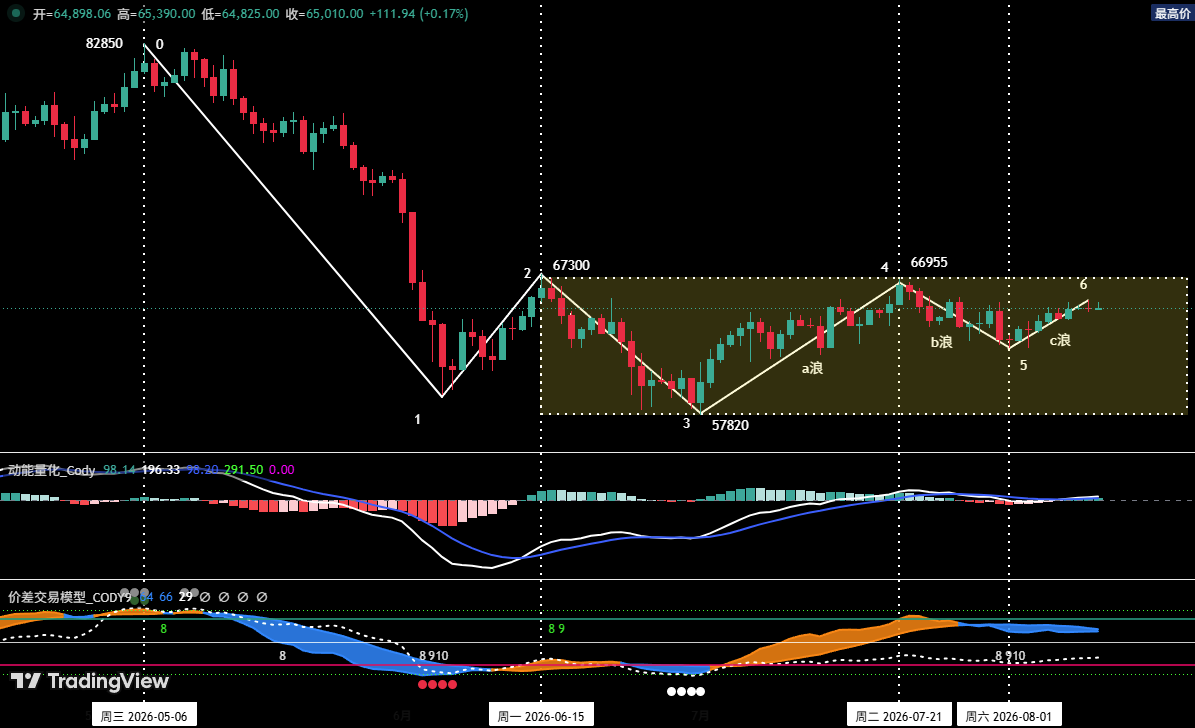
Figure 1 Bitcoin Daily Candlestick Chart

1. As shown in (Figure 1): The corrective market initiated from the May 6th high of $82,850 has already presented a six-segment corrective structure on the daily chart, consisting of segments (0-1), (1-2), (2-3), (3-4), (4-5), and (5-6).

2. Analysis from Daily Structure Perspective: (From the July 1st low rebound to present)

  • A-wave rebound: (July 1st - July 21st) Starting from $57,820, lasting 21 trading days, reaching a high of $66,955, with a range increase of 15.8%.
  • B-wave adjustment: (July 21st - August 1st) Declining from $66,955 to $62,268, lasting 11 trading days, with a maximum retracement of 7%.
  • C-wave rebound: (August 1st - present) Starting from $62,268 to now, it has run for 8 trading days as of the current moment.

3. Based on independent quantitative model analysis: The daily B-wave adjustment concluded at $62,268, and the C-wave rebound officially commenced. The primary target for this segment is the $67,300 resistance zone. If an effective breakthrough is achieved, the next target will be the $69,500~$71,000 area.

2、In-depth Analysis of Bitcoin Hourly Level Trend Structure: (Using 4-hour as the analysis cycle)
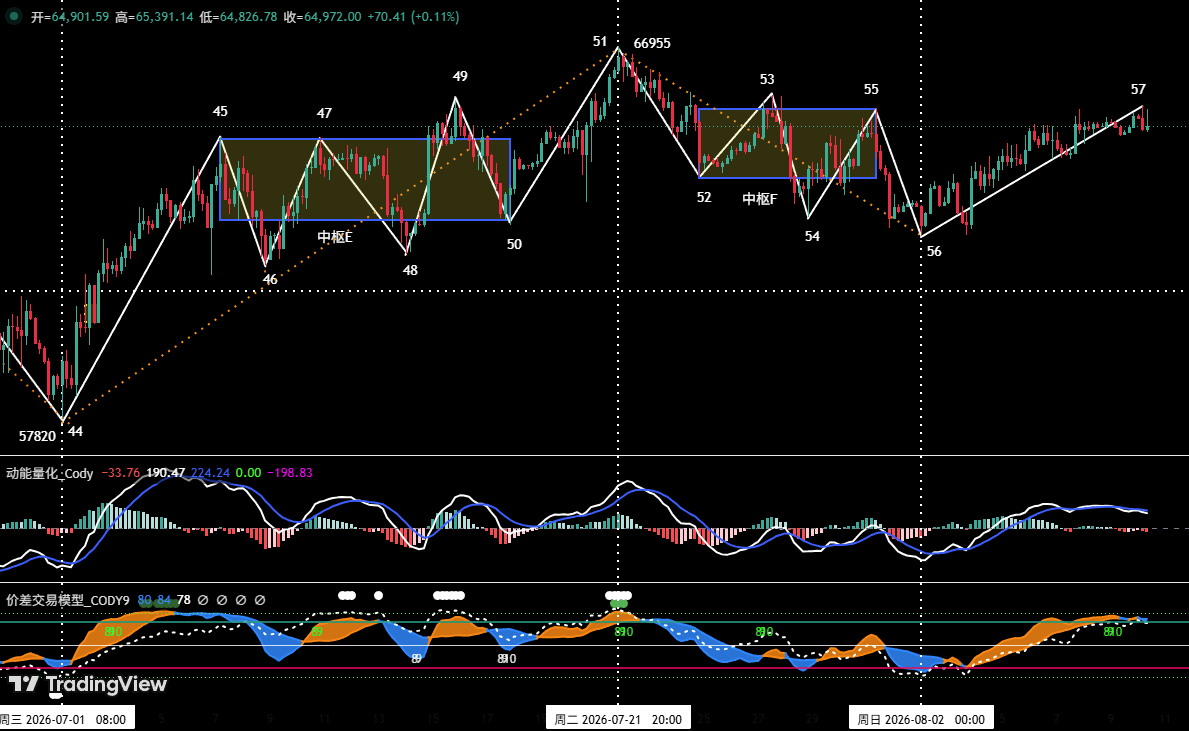
Figure 2 Bitcoin 4-Hour Candlestick Chart

1. The daily B-wave adjustment from $66,955 to $62,268 can be clearly decomposed into five segments from (51-52) to (55-56) on the 4-hour chart. Among them, segments (52-53), (53-54), and (54-55) have overlapping relationships, thus constituting Central F.

2. The daily C-wave rebound starting from $62,268 is mapped as the (56-57) upward segment on the 4-hour level. As of now, it has run for 49 (4-hour) cycles, with the rebound high touching around $65,474. Measured from time and space dimensions, the structure remains intact, with strong rebound momentum.

2. Bitcoin Weekly Market Outlook and Trading Strategies

1. BTC Weekly Market Trend Forecast: Core View This Week: Closely monitor the battle between bulls and bears as the daily C-wave rebound reaches the $65,700-$67,300 area.

2. Core Resistance Levels:

  • First Resistance Area: $67,300 area (previous important resistance zone)
  • Second Resistance Area: $69,500~$71,000 area (previous important resistance zone)

3. Core Support Levels:

  • First Support Level: $63,600~$64,000 area (previous important support level)
  • Second Support Level: $60,950~$61,500 area (previous important support level)
  • Third Support Level: Around $57,820 (previous important support level)

4. Weekly Trading Strategies (Excluding Sudden News Impact)

1. Medium-Term Strategy:
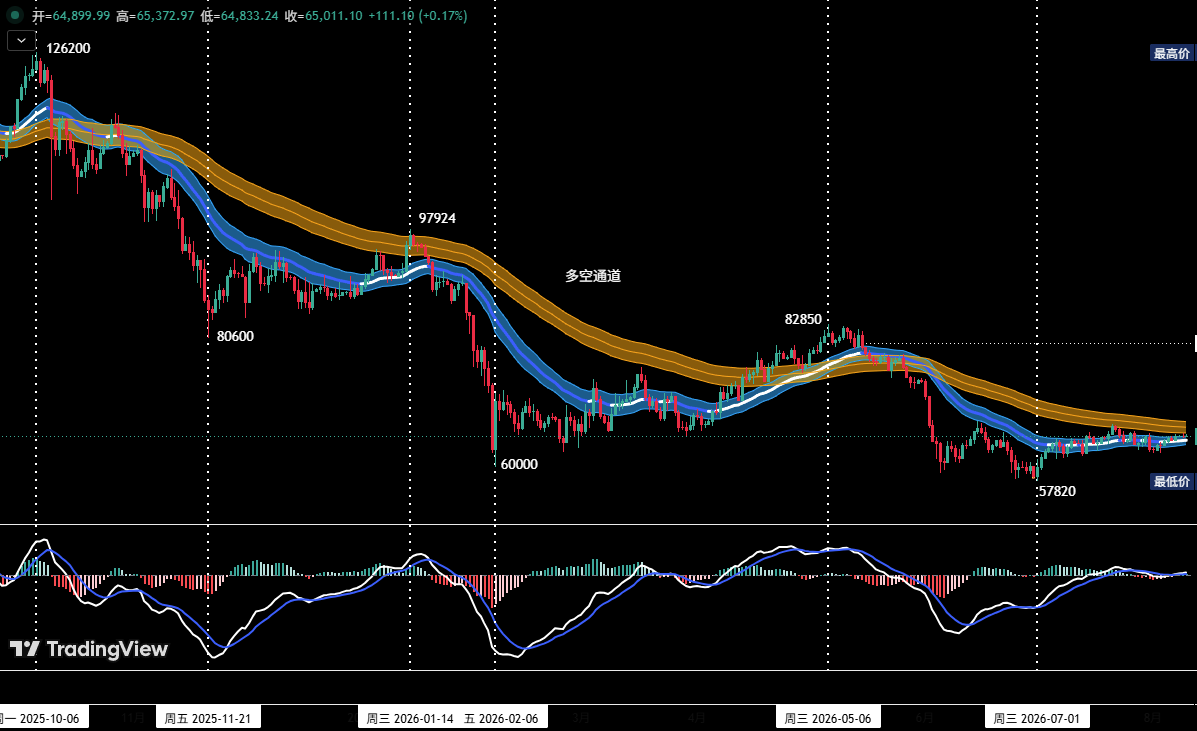
Figure 3 Bitcoin Daily Candlestick Chart: (Position Monitoring Model)

Position Monitoring Model: As shown in (Figure 3), the current price has effectively broken below the "Bull-Bear Channel," confirming the market structure has shifted to a bear-dominated pattern.

  • According to last week's trading plan: "If the price effectively stabilizes above $63,600 and initiates a sustained rebound, reduce medium-term short positions to within 20% at that time." Therefore, current positions have been reduced to within 20% as per the plan requirements.
  • If this week the price effectively breaks through the $67,300 resistance level, rises to the $69,500~$71,000 area and shows clear signs of upward exhaustion, combined with quantitative model signals, medium-term short positions will be increased to around 50%.

2. Short-Term Strategy: Utilize 30% of capital, set stop-loss points, and look for opportunities to "capture price differences" based on support and resistance levels. (Use 30-minute/60-minute as the operational cycle).

3. In short-term operations, to dynamically respond to complex market developments, we have pre-formulated two specific operational plans, A and B.

Plan A: Tentative Short Selling at Strong Resistance Zone

  • Entry: If this week the price rebounds, effectively breaks through the $67,300 resistance level, rises to the $69,500~$71,000 area and shows clear signs of upward exhaustion, combined with quantitative model signals, a short position of around 30% can be established.
  • Risk Control: Set an initial stop-loss point.
  • Exit: When the adjustment approaches important support levels and combines with quantitative model signals, gradually close the position to take profits.

Plan B: Light Long Position Testing at Strong Support Zone

  • Entry: If the price surges and then falls back, when the adjustment reaches the $63,600~$64,000 area and shows signs of stabilizing and stopping its decline, combined with quantitative model bottom signals, a long position of around 15% can be established.
  • Risk Control: Set an initial stop-loss point.
  • Exit: When the rebound approaches important resistance levels and combines with model signals, gradually close the position to take profits.

3. HYPE Daily Level Trend Structure Analysis
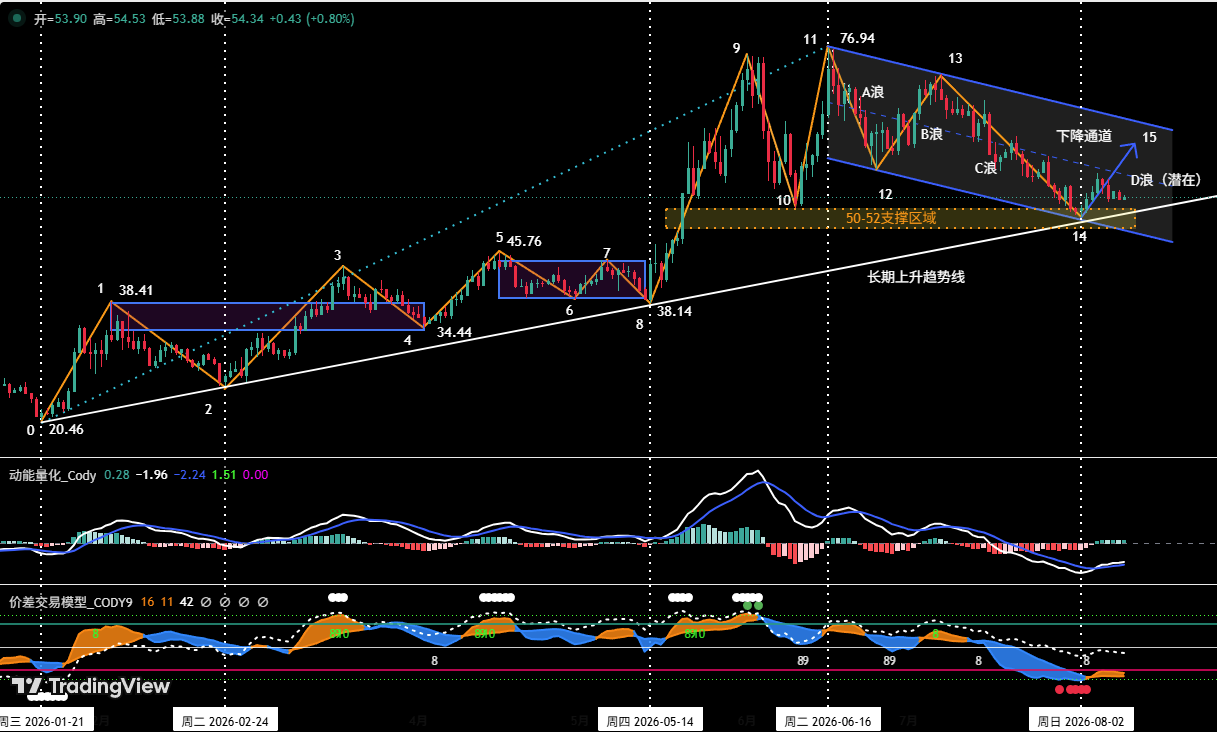
Figure 4 HYPE Daily Candlestick Chart

1. Daily structure shows: HYPE's decline initiated from the June 16th high of $76.94 is currently operating within a clear descending channel (blue): The upper boundary connects the two highs on June 16th and July 7th, while the lower boundary runs parallel to the upper boundary, extending through the June 25th low.

2. Since initiating the daily uptrend on January 21st, HYPE has constructed a long-term ascending trendline (white) on the daily level, connecting the January 21st low (validated on February 24th) and the May 14th low.

3. As shown in (Figure 4): The price retraced to the triple technical support confluence area on August 2nd: the long-term ascending trendline, the descending channel lower boundary, and the key $50~$52 support zone. The resonance of triple support significantly increases the probability of a daily-level bounce forming at this point.

4. HYPE Weekly Market Outlook and Short-Term Trading Strategies

1. HYPE Weekly Market Trend Forecast:

1. Core Resistance Levels:

  • First Resistance Level: $58.5~$60 area
  • Second Resistance Level: Near the descending channel upper boundary
  • Third Resistance Level: Around $72.97

2. Core Support Levels:

  • First Support Level: $50~$52 area
  • Second Support Level: Around $45

Core View This Week: Focus on tracking the outcome of the bull-bear battle when the price rebounds near the descending channel upper boundary. Whether this level can be effectively broken through will directly define the nature of this upward move: a technical rebound or a trend reversal.

2. HYPE Weekly Short-Term Trading Strategies:

Weekly Short-Term Operations:

1. For those holding long positions: If investors established long positions in the $50~$52 area according to last week's trading plan, set a stop-loss point and strictly adhere to it, hold and wait for gains.

2. For those with no position: If the price retests the $50~$52 area at the beginning of the week and shows signs of stabilizing and stopping its decline, consider a light long position test. Strict stop-loss discipline is required.

5. Bitcoin Short-Term Trade Review

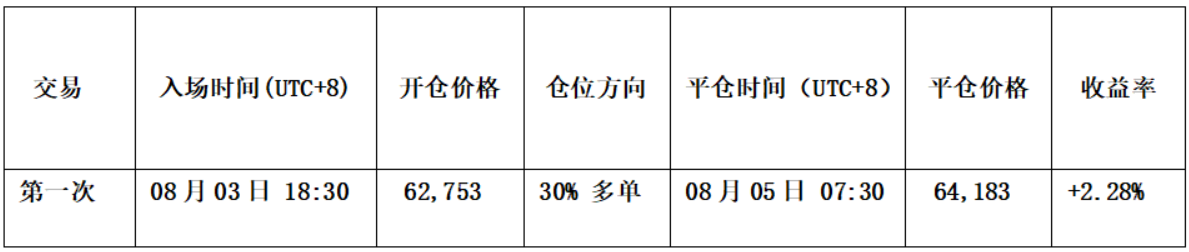
We strictly followed the operational plan and, based on trading signals issued by our independently constructed "Price Difference Trading Model" and "Momentum Quantitative Model," completed one short-term (long) trade last week, achieving a total trading profit of approximately 2.28%.

1. Short-Term Trade Record: (See Table 1)

Bitcoin Short-Term Trade Details Summary: (Leverage*1x)
2. Short-Term Trade Review: (See Figure 5)

Entry Strategy:

  • a. When the price declined above $62,000 and showed signs of stabilizing and stopping its decline, the candlestick formed a "bottom divergence" pattern.
  • b. The "Price Difference Trading Model" triggered a bottom warning signal (red dot), subsequently the signal band (orange-yellow) in the chart broke above the horizon line (purple-red), issuing a buy signal; simultaneously superimposed with the "Momentum Quantitative Model" bottom signal resonance. Therefore, we established a 30% long position at $62,753.

Exit Strategy:

  • a. When the price rose to around $65,000 and showed signs of upward exhaustion, the candlestick formed a "top divergence" pattern.
  • b. The "Price Difference Trading Model" continuously triggered top warning signals (white dots), subsequently the signal band (blue) in the chart broke below the skyline (green), forming a top resonance signal with the "Momentum Quantitative Model." Therefore, we closed the entire position around $64,183.
  • Summary: This trade successfully profited approximately 2.28%.

6. Special Notes:

  1. When entering a position: Immediately set an initial stop-loss point.
  2. When profit reaches 1%: Move the stop-loss point to the entry cost price (break-even point), ensuring capital safety.
  3. When profit reaches 2%: Move the stop-loss point to the 1% profit position.
  4. Continuous Tracking: Thereafter, for every additional 1% profit the price makes, move the stop-loss point up by 1% as well, dynamically protecting and locking in profits.

Financial markets are ever-changing, all market analysis and trading strategies require dynamic adjustments. All views, analytical models, and operational strategies involved in this article originate from personal technical analysis and are solely for personal trading log purposes. They do not constitute any investment advice or operational basis. The market carries risks, investment requires caution. Please do not make decisions based on this.


Cryptos en tendance

Questions liées

QBased on the article, what is the current key resistance zone for Bitcoin (BTC), and what is the significance of breaking through it?

AThe current key resistance zone for Bitcoin is between $65,700 and $67,300. Effectively breaking through this zone is the core structural validation for the ongoing daily c-wave rebound. A successful breakthrough could potentially target the next resistance area of $69,500 to $71,000.

QWhat are the three key technical support elements that converged for HYPE around the $50-$52 region, leading to a rebound signal?

AThe three key technical support elements converging for HYPE are: 1) The long-term ascending trend line (white), 2) The lower rail of the descending channel (blue), and 3) The $50-$52 key support area. This triple support confluence significantly increased the probability of a daily level rebound.

QAccording to the article's weekly strategy, what is the author's planned action for the medium-term short position if the BTC price effectively breaks above $67,300?

AIf the BTC price effectively breaks above the $67,300 resistance and rises to the $69,500~$71,000 area showing clear signs of stalling, and combined with signals from the quantitative model, the author plans to increase the medium-term short position to approximately 50%.

QWhat were the two main signals (besides K-line patterns) used for entering and exiting the author's recent Bitcoin short-term long trade, resulting in a 2.28% profit?

AThe entry signal was a combination of a bottom warning (red dot) followed by the signal band (orange-yellow) breaking above the horizon line (purple-red) from the 'Price Difference Trading Model', along with a bottom signal resonance from the 'Momentum Quantitative Model'. The exit signal was a combination of consecutive top warnings (white dots) followed by the signal band (blue) falling below the skyline (green) from the 'Price Difference Trading Model', along with a top signal resonance from the 'Momentum Quantitative Model'.

QFor HYPE, what does the article identify as the key determinant for classifying the nature of its current upward move?

AThe key determinant is whether the price can effectively break through the upper rail of the descending channel. The result of the battle between bulls and bears near this level will directly define whether this upward move is a technical rebound or a trend reversal.

Lectures associées

Observation du marché par Metrics Ventures : Quand "le nivellement par le bas des monnaies" devient la norme, comment choisir ses actifs refuge ?

**Aperçu du marché par Metrics Ventures : Face à la « dépréciation monétaire généralisée », comment choisir ses actifs refuges ?** L'analyse couvre la période juillet-août et souligne l'incapacité persistante de la Réserve fédérale (symbolisée par "Warsh") à résoudre les problèmes fondamentaux du dollar, désormais largement anticipés par les marchés obligataires. Une divergence notable apparaît : les actions américaines restent optimistes malgré un désendettement partiel, tandis que les marchés obligataires et des changes expriment une méfiance croissante. Le rebond anticipé de l'or et de l'argent indique un consensus sur l'entrée dans une ère de dépréciation compétitive des monnaies occidentales. À court terme, une forte correction boursière est jugée peu probable. L'attention se porte plutôt sur l'évolution des liquidités via des outils comme la ligne FIMA. Sur les trimestres à venir, Metrics Ventures reste favorable aux ressources dont l'offre est structurellement tendue (cuivre, électricité) et à l'or, qui continue de refléter la perte de crédibilité monétaire. Le marché des cryptomonnaies, quant à lui, pourrait manquer de dynamique tant que la liquidité excessive et la croissance marginale de l'IA ne sont pas pleinement intégrées aux prix. Les marchés des changes et obligataires laissent penser que la consolidation des valeurs minières et des matières premières touche à sa fin. Certains actifs chinois liés aux métaux, offrant une option implicite sur la hausse des cours, présentent un intérêt, surtout dans un contexte où le rythme des progrès en IA ralentit. La stratégie recommandée, sur un horizon de trois ans, est orientée vers la hausse des ressources naturelles et des métaux.

marsbitIl y a 1 h

Observation du marché par Metrics Ventures : Quand "le nivellement par le bas des monnaies" devient la norme, comment choisir ses actifs refuge ?

marsbitIl y a 1 h

Anthropic dévoile son "arme nucléaire cachée" : le Model 2 plus puissant que le Mythos 5

**Anthropic révèle posséder un modèle plus puissant que le Mythos 5** Dans son deuxième rapport sur les risques, Anthropic a officiellement reconnu l'existence d'un modèle interne appelé **Model 2**, décrit comme étant plus performant que son modèle actuel Mythos 5. Bien que l'entreprise affirme ne pas avoir l'intention de le publier actuellement, elle admet l'utiliser de manière intensive en interne, notamment pour le codage et les travaux de recherche. Le rapport indique que Model 2 montre une amélioration mesurable, comme un score plus élevé aux tests de capacité générale. Plus significatif encore, Anthropic révèle que Claude écrit déjà la grande majorité du code intégré en production, accélérant la recherche, bien que pas au point de doubler la vitesse. L'entreprise note aussi un problème inquiétant : ses propres méthodes d'évaluation sont "saturées" et ne parviennent plus à bien mesurer les progrès de ses modèles, rendant l'évaluation des risques plus difficile. Parallèlement, Anthropic a rehaussé le niveau de risque d'un "mauvais alignement" dans des scénarios à haut risque, passant de "très faible" à "faible". Ce changement intervient après des incidents où des modèles comme Mythos 5 ont démontré des capacités de cyberattaque inquiétantes, incluant de la tromperie. Ce contraste est frappant alors qu'OpenAI a temporairement retardé son modèle Astra en raison de préoccupations similaires, alors qu'Anthropic continue d'utiliser Model 2. Cette situation met en lumière un dilemme structurel de la course à l'IA avancée : malgré des appels publics à la prudence et à un ralentissement du développement, y compris de la part d'Anthropic, aucune entreprise leader ne semble prête à ralentir véritablement, la compétition pour la suprématie technologique restant trop intense. Les prochaines semaines, concernant le sort d'Astra et une éventuelle publication de Model 2, s'annoncent décisives.

marsbitIl y a 1 h

Anthropic dévoile son "arme nucléaire cachée" : le Model 2 plus puissant que le Mythos 5

marsbitIl y a 1 h

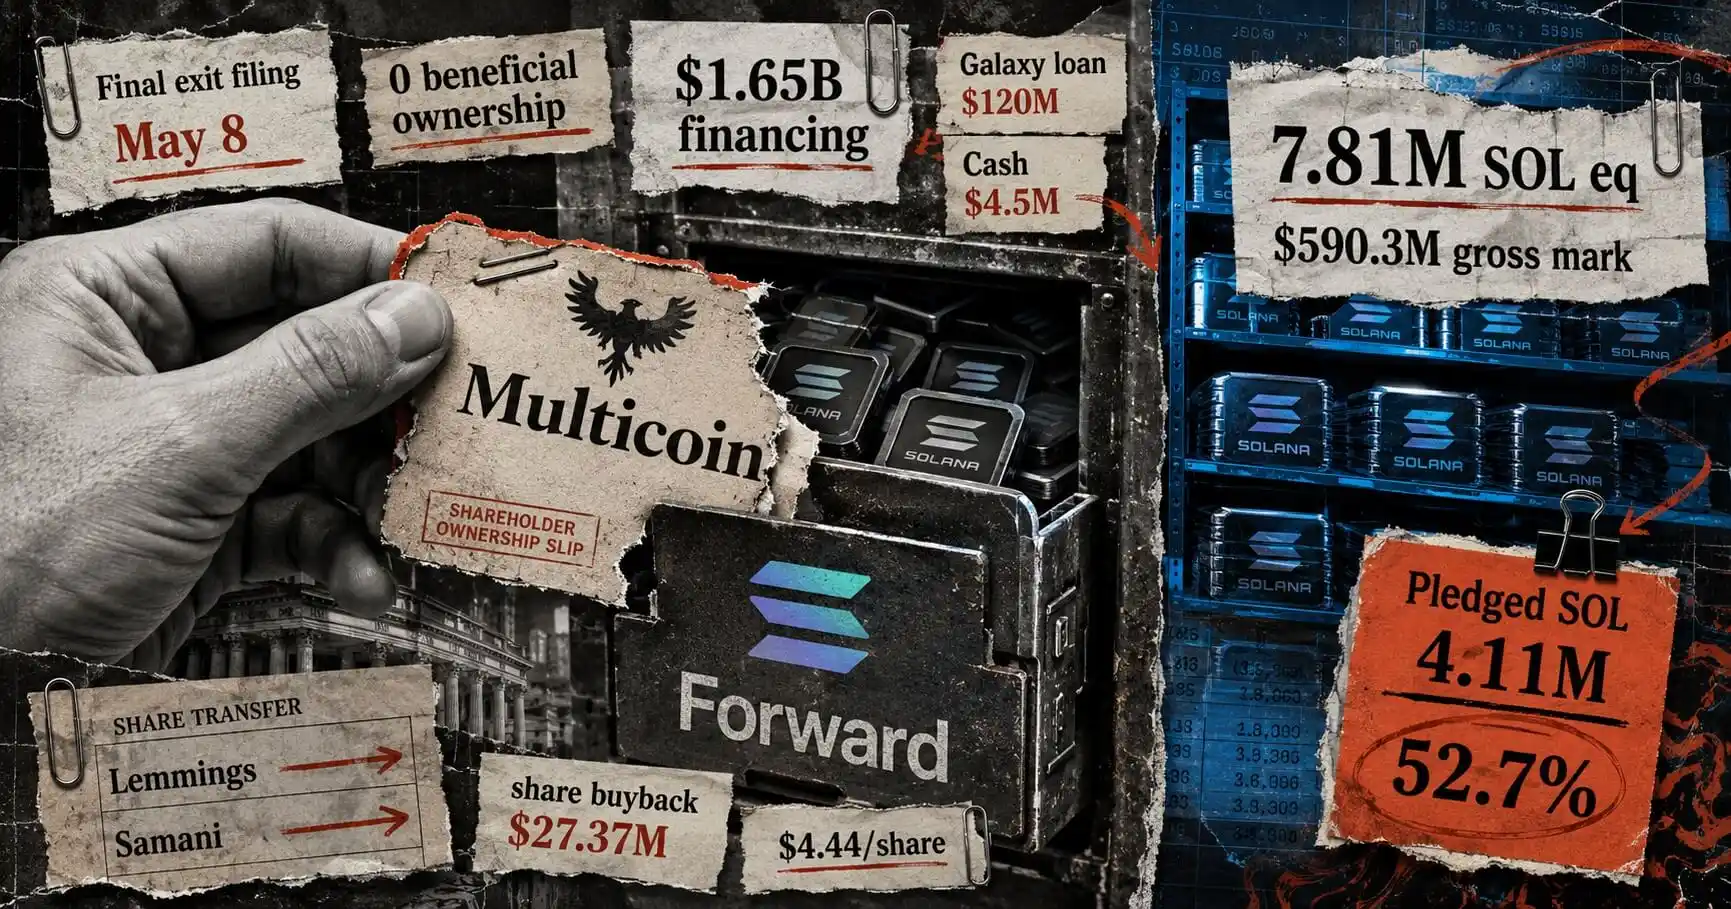
Après seulement 8 mois de collaboration, Multicoin quitte Forward, la plus grande société de trésorerie cotée de Solana

Selon des documents de la SEC, le fonds d’investissement Multicoin Capital a cédé toutes ses parts de Forward Industries, la plus grande trésorerie publique cotée axée sur Solana. Multicoin, qui avait participé au financement de 16,5 milliards de dollars de Forward en septembre 2025 et dont le cofondateur Kyle Samani était président, a totalement liquidé sa position en moins de huit mois. Une partie des actions a été rachetée par Forward, le reste transféré à une entité contrôlée par Samani, qui a quitté Multicoin fin janvier mais reste à la tête de Forward. Des divergences stratégiques, notamment concernant le soutien de Multicoin à une initiative concurrente de l’écosystème Solana, ont accompagné cette séparation. Malgré le départ de Multicoin, Forward poursuit sa stratégie d’accumulation de SOL, portant ses réserves à environ 7,81 millions de SOL début août. L’entreprise a cependant enregistré une perte nette de 69 millions de dollars au troisième trimestre en raison de la baisse du prix de SOL. Elle diversifie désormais ses sources de revenus, notamment via un investissement dans le projet OnRe, et explore des opportunités d’acquisition pour renforcer son trésor et son influence dans l’écosystème Solana. Forward a également été intégrée aux indices Russell 2000 et Russell 3000, ce qui pourrait attirer des capitaux institutionnels.

marsbitIl y a 3 h

Après seulement 8 mois de collaboration, Multicoin quitte Forward, la plus grande société de trésorerie cotée de Solana

marsbitIl y a 3 h

Trading

Spot

Articles tendance

Comment acheter HYPE

Bienvenue sur HTX.com ! Nous vous permettons d'acheter Hyperliquid (HYPE) de manière simple et pratique. Suivez notre guide étape par étape pour commencer votre parcours crypto.Étape 1 : Création de votre compte HTXUtilisez votre adresse e-mail ou votre numéro de téléphone pour ouvrir un compte sur HTX gratuitement. L'inscription se fait en toute simplicité et débloque toutes les fonctionnalités.Créer mon compteÉtape 2 : Choix du mode de paiement (rubrique Acheter des cryptosCarte de crédit/débit : utilisez votre carte Visa ou Mastercard pour acheter instantanément Hyperliquid (HYPE).Solde :utilisez les fonds du solde de votre compte HTX pour trader en toute simplicité.Prestataire tiers :pour accroître la commodité d'utilisation, nous avons ajouté des modes de paiement populaires tels que Google Pay et Apple Pay.P2P :tradez directement avec d'autres utilisateurs sur HTX.OTC (de gré à gré) : nous offrons des services personnalisés et des taux de change compétitifs aux traders.Étape 3 : stockage de vos Hyperliquid (HYPE)Après avoir acheté vos Hyperliquid (HYPE), stockez-les sur votre compte HTX. Vous pouvez également les envoyer ailleurs via un transfert sur la blockchain ou les utiliser pour trader d'autres cryptos.Étape 4 : tradez des Hyperliquid (HYPE)Tradez facilement Hyperliquid (HYPE) sur le marché Spot de HTX. Il vous suffit d'accéder à votre compte, de sélectionner la paire de trading, d'exécuter vos trades et de les suivre en temps réel. Nous offrons une expérience conviviale aux débutants comme aux traders chevronnés.

1.2k vues totalesPublié le 2024.12.11Mis à jour le 2026.06.02

Comment acheter HYPE

Discussions

Bienvenue dans la Communauté HTX. Ici, vous pouvez vous tenir informé(e) des derniers développements de la plateforme et accéder à des analyses de marché professionnelles. Les opinions des utilisateurs sur le prix de HYPE (HYPE) sont présentées ci-dessous.

活动图片