Three Key Bitcoin On-Chain Metrics to Watch Now

tokeninsight_enPublished on 2025-06-08Last updated on 2025-06-11

Introduction

Understanding Bitcoin’s market goes beyond just watching price movements. On-chain metrics provide deeper insights into investor behavior and market cycles by analyzing blockchain data directly. This article explores three key on-chain indicators – MVRV (Market Value to Realized Value), Bitcoin balance on exchanges, and the 1+ year HODL wave – and how they help paint a data-driven picture of Bitcoin’s market health.

MVRV Z-Score (Market Value to Realized Value)

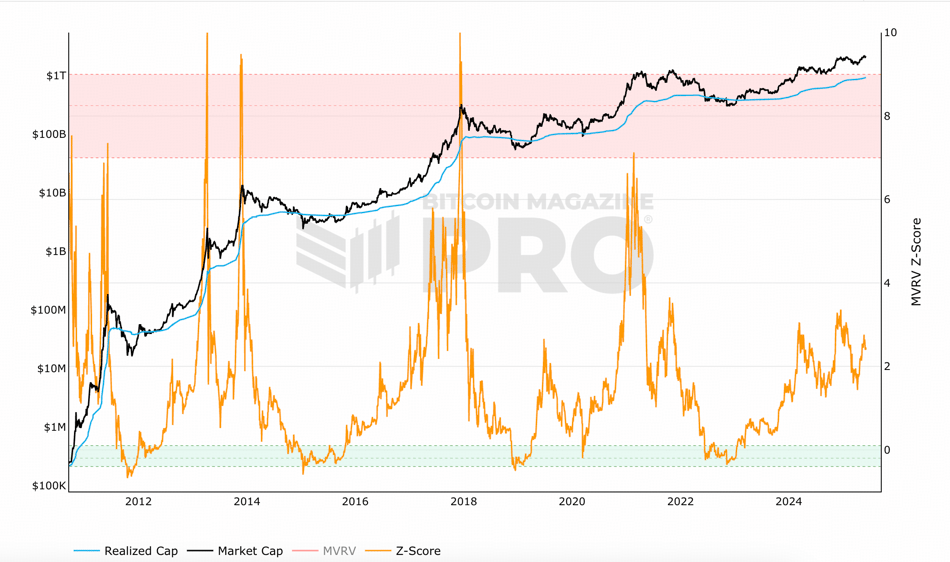
Bitcoin’s MVRV Z-Score chart, showing that current levels remain well below historical peaks. Higher MVRV Z-Score values (red areas) signaled past cycle tops, while low values (green) coincided with bear market lows.
Source: https://www.bitcoinmagazinepro.com/charts/mvrv-zscore/

What is MVRV?

MVRV stands for Market Value to Realized Value. In simple terms, it’s the ratio of Bitcoin’s total market capitalization to its realized capitalization. The market cap is just the current price times the circulating supply. The realized cap, in contrast, values each coin at the price when it last moved on-chain (essentially an aggregate “cost basis” for all BTC). By comparing these, MVRV shows the gap between current price and the average price at which coins were acquired. If the ratio is high, the average holder is in profit – on average, coins are worth much more now than what their owners paid. If MVRV is low or below 1.0, it means many holders would be sitting on losses if they sold at current prices.

Why is MVRV important?

This metric is a barometer of market sentiment and valuation extremes. A high MVRV indicates the market value is far above the aggregated cost basis, suggesting potential overvaluation – in such periods investors have large unrealized profits, so there may be greater temptation to sell (historically, MVRV spikes have aligned with major price tops). Conversely, a very low MVRV (especially below 1) means the market is trading near or even under the average on-chain cost basis, indicating possible undervaluation or capitulation – past bear market bottoms saw MVRV in this low range when most investors were underwater on their positions. In practice, analysts consider MVRV as a gauge of fair value vs. hype: it helps identify when Bitcoin is extremely overvalued or undervalued relative to what holders actually paid.

MVRV Z-Score

The MVRV Z-Score is a statistical refinement of the basic MVRV ratio. It compares Bitcoin’s market value to its realized value and then normalizes the difference using the historical standard deviation of that difference.

While MVRV gives a simple ratio, the Z-Score adds statistical depth, identifying extremes more precisely. Historically:

  • A Z-Score above 7–8 has aligned with market tops (euphoria, overvaluation).
  • A Z-Score near or below 0 has marked bottoms (despair, capitulation).

Unlike raw MVRV, which can drift over time due to structural shifts in realized cap, the Z-Score accounts for historical volatility, making it more robust for cycle analysis.

Potential Problem

The fundamental problem with the MVRV-Z Score lies in the fact that it is constructed entirely from on-chain data. Today, a substantial majority of Bitcoin trading occurs off-chain — particularly on centralized exchanges, ETFs as well as in the derivatives markets.

For example, if a large investor accumulates Bitcoin on Coinbase but leaves it in the exchange wallet without withdrawing to self-custody, there will be no on-chain movement. As a result, the realized value component of MVRV-Z does not update. Yet the market is clearly absorbing a large buy-side volume, a signal that MVRV-Z fails to capture.

MVRV-Z Score remains a powerful tool for identifying long-term valuation extremes based on historical price behavior and UTXO flows, it is fundamentally constrained by its on-chain-only perspective.

Bitcoin Balance on Exchanges

Total BTC held on exchanges over time (orange) versus Bitcoin’s price (black). Exchange balances grew steadily until 2020, peaking around 3.4 million BTC, then began declining. By 2025, exchange reserves have fallen near multi-year lows (signaling more coins in self-custody).

What is the “balance on exchanges” ?

This simply measures how much Bitcoin is held in wallets belonging to centralized exchanges. On-chain analytics can identify known exchange addresses and sum up all BTC in those wallets. The result is an estimate of the total supply sitting on exchanges available for trading.

Why is this important?

Exchange balance is often interpreted as an indicator of selling pressure and investor sentiment. The logic goes: when lots of BTC are parked on exchanges, those coins are just one quick sell order away from hitting the market – indicating potential supply overhang. Conversely, when the exchange balance drops, it means investors are pulling coins into cold storage, making them less immediately available for sale – a sign of accumulation and confidence (investors are comfortable holding, not looking to liquidate).

Historical trends support this view: rising exchange reserves have tended to coincide with bear markets or price declines (investors send BTC to exchanges, presumably to sell), whereas sustained declines in exchange-held BTC have often accompanied bull markets (coins moving off exchanges as people HODL for the long term).

Potential Problem

The landscape of custody is evolving. In late 2024–2025, a significant new factor was the rise of Bitcoin ETFs and institutional custodians. These products led to coins moving out of retail exchanges into custodial cold storage for ETFs. The exchange balance metric saw a drop (because those coins left exchanges), but this wasn’t due to individual hodlers—it was a shift in where coins are held.

According to Glassnode's analysis, when you combine exchange holdings with ETF custodial wallets, the total has remained relatively stable around ~3 million BTC, meaning the apparent outflows were largely a transfer from one type of custodian to another rather than a true supply squeeze.

Declining Exchange Balances Are Enhancing the Accuracy of MVRV Z-Score

One of the most frequently cited limitations of the MVRV Z-Score lies in its exclusive reliance on on-chain data. As a metric that compares Bitcoin’s market capitalization to its realized capitalization (where realized cap tracks the aggregated cost basis of all coins based on their last on-chain movement), the MVRV Z-Score fails to capture any activity that occurs off-chain.

In such a context, if large volumes of Bitcoin are bought and held within exchange wallets without being withdrawn to self-custody, those transactions remain invisible to the realized cap component. The result is a potential distortion: the metric may suggest under- or overvaluation based on incomplete data about actual cost basis and market sentiment.

However, this core limitation may be becoming less severe in the current market environment. A significant structural shift has occurred in Bitcoin custody patterns since 2020, as evidenced by the sharp and sustained decline in the total BTC balance held on centralized exchanges.

This mass withdrawal behavior has important implications for the MVRV Z-Score. As more BTC leaves exchanges, those movements typically generate on-chain activity. These withdrawals register new timestamps and prices for the UTXOs involved, thereby updating the realized cap. As a result, a growing portion of market activity that was previously invisible to MVRV is now being incorporated into its dataset. The consequence is that the MVRV Z-Score may now more accurately reflect market sentiment and aggregated cost basis than it did during earlier periods of heavy exchange dominance.

However, the rise of ETFs and institutional custodianship introduces new layers of abstraction: while coins may leave retail exchanges, they often move into large custodial aggregators whose on-chain patterns may be difficult to interpret, limiting the granularity of insight available from realized cap updates.

Most U.S.-based spot Bitcoin ETFs were launched in early 2024, during the early phase of a bull market. Since their inception, these ETFs have primarily been in an accumulation phase, buying large quantities of BTC from exchanges and transferring them into institutional-grade custodial wallets. These are first-time acquisitions, meaning they involve on-chain settlement: coins are purchased (often OTC or via prime brokers), then withdrawn from exchange wallets and deposited into ETF custodians’ wallets—triggering UTXO updates in the process.

Because these transactions involve actual on-chain movements—either withdrawals from exchange hot wallets or direct transfers into segregated custody—they are captured in the realized cap calculation. Thus, the MVRV Z-Score does reflect the cost basis of these ETF-acquired coins, even though those coins now sit in wallets that may appear relatively static afterward.

1+ Year HODL Wave (Long-Term Holder Supply)

Bitcoin “1+ Year HODL Wave” – percentage of supply untouched for at least one year. In prior cycle peaks (2017, 2021), this percentage dropped significantly as long-term holders sold off, whereas currently it remains elevated, indicating many are still holding their coins.

Source: https://www.bitcoinmagazinepro.com/charts/1-year-hodl-wave/

What is the 1+ Year HODL Wave?

The term HODL waves refers to a visualization of Bitcoin’s supply divided by the last time each coin moved (its “age”). The 1+ year HODL wave specifically measures the proportion of Bitcoin that hasn’t been moved from one address to another in at least one year. In plain language, it’s the share of BTC being held by long-term holders (LTHs) – people who haven’t touched their coins for a year or more.

Why is it important?

The HODL wave is a window into holder behavior and market cycles. Generally, long-term holders set the floor and ceiling of cycles: they accumulate during bear markets (increasing the 1y+ wave as coins age without moving), and they distribute during bull markets (spending some of those old coins, which shrinks the 1y+ percentage).

A rising 1+ year HODL wave indicates coins aging and staying put – a sign of accumulation and strong conviction. This often happens in bear phases when prices are low and patient investors or “smart money” keep buying or holding. Conversely, when the 1+ year band starts to decline, it means previously dormant coins are on the move – typically indicating profit-taking by long-term holders as the market heats up.

In bull markets, long-term holders gradually sell or redistribute coins to newer buyers, which shows up as a drop in the percentage of 1y+ old coins. Thus, this metric provides insight into where we are in the cycle: if the long-term HODLer cohort is at all-time highs, it suggests we’re still in a strong-hands, accumulation-heavy phase; if that cohort rapidly shrinks, it can signal a distribution phase associated with market tops.

Potential Problem

On its own, the HODL wave doesn’t tell you if those long-term holders will continue to hold or are about to sell en masse. It’s a bit like looking at a reservoir of water without knowing when the dam will open. You know a lot of water (supply) is stored up, but timing the release requires other data. The metric is most powerful when combined with others – for example, pairing a decline in HODL wave with a spike in exchange inflows and a high MVRV would strongly indicate a top forming. But the HODL wave by itself is more informative about the past and present state of holdings than the immediate future.

Combining Metrics for Deeper Insights

No single metric can capture the full complexity of Bitcoin’s market. Each of the three indicators above – MVRV, exchange balances, and the HODL wave – shines light on one dimension of market behavior. MVRV is about investors’ profitability (and thus greed/fear), exchange balance is about traders’ positioning (liquid vs. cold storage), and HODL wave is about long-term holder conviction. Taken together, they give a holistic view of the market’s state.

At major cycle tops, you tend to see confluence in these metrics: MVRV will be very high (signaling overvaluation and big unrealized profits), HODL wave will start dropping (long-term holders finally spending coins), and exchange balances may tick up (coins flowing to exchanges to be sold). No single metric is a perfect sell signal, but together these paint a powerful warning.

Current data (mid-2025) from these metrics collectively points to a robust market: valuations aren’t at extreme danger levels, supply on exchanges is constrained, and hodlers remain historically resolute.


Trending Cryptos

Related Reads

In Just 11 Days, Claude Rewrote Millions of Lines of Code, an Epic AI Engineering Feat Sparks Fury

In just 11 days, Bun's founder Jarred Sumner used Anthropic's Claude AI models to rewrite its million lines of code from Zig to Rust. This move sparked significant controversy, particularly from Zig's creator, Andrew Kelley, who publicly criticized Sumner's engineering practices and the decision to use AI for such a massive rewrite. Bun, a high-performance JavaScript/TypeScript runtime and rival to Node.js, was originally written in Zig. After Anthropic acquired Bun, the team encountered persistent stability and memory safety bugs in the Zig codebase. These issues, combined with Zig's strict policy against LLM-generated code, led to the decision to rewrite in Rust. The rewrite was executed using Claude AI tools at an estimated API cost of $165,000, dramatically reducing the expected time and financial cost. Andrew Kelley's response was scathing. He blamed the original bugs on poor engineering habits, calling Bun's Zig code a collection of "hacks on top of hacks." He expressed relief that Bun was no longer associated with Zig, fearing it would misrepresent the language and attract low-quality, AI-generated contributions. The tech community is divided; some view Kelley's critique as unprofessional, while others see it as a defense of engineering integrity. A major concern about the AI-driven rewrite is the resulting code quality. The translation from Zig left approximately 27,000 lines of unsafe Rust code, raising fears about long-term maintainability and technical debt. The debate centers on whether this project is a milestone in AI-assisted development or a future maintenance nightmare.

marsbit50m ago

In Just 11 Days, Claude Rewrote Millions of Lines of Code, an Epic AI Engineering Feat Sparks Fury

marsbit50m ago

From Auto Finance to Bitcoin to AI Engines: An Analysis of Cango's 'What Not to Do' Strategy

From Auto Finance to Bitcoin and Now AI: Cango's "What Not to Do" Strategy Cango, a Chinese auto finance platform that went public on the NYSE in 2018, is undergoing its third major transformation. After selling its entire auto business in 2024, it pivoted to become a large-scale Bitcoin miner, acquiring 50 exahash of mining rigs from Bitmain. However, its true goal was never Bitcoin, but owning and controlling energy infrastructure. Now, Cango is pivoting again. While most listed Bitcoin miners are leasing power to giant hyperscalers for AI training clusters, Cango is taking the opposite path. It has launched an AI inference subsidiary called EcoHash, focusing not on training but on distributed inference. The company's strategy hinges on the insight that over 70% of mining industry power is controlled by small, independent sites (10-50 MW), which are too small for hyperscalers but ideal for low-latency AI inference. Cango aims to partner with these small operators, providing the AI technology, customers, and financing through its EcoLink software layer, which can distribute workloads across sites for reliability. Cango maintains a hybrid model, running roughly 31.7 EH/s of Bitcoin mining for cash flow while aggressively cleaning its balance sheet—slashing long-term debt by 94.5% to $30.6 million and raising $75 million for its AI venture. Its first AI deployment will be at a 50 MW site in Georgia. The strategy faces skepticism, given the high costs of converting mining sites and the potential for an AI bubble. However, Cango's leadership believes discipline around "what not to do"—avoiding direct competition with hyperscalers in training—positions it to capture the long-tail demand for distributed AI inference power.

Foresight News1h ago

From Auto Finance to Bitcoin to AI Engines: An Analysis of Cango's 'What Not to Do' Strategy

Foresight News1h ago

Strategy's Bitcoin Sales Cap Far Exceeds $1.25 Billion: A Detail the Market Overlooked

The article discusses how MicroStrategy's potential Bitcoin sales go far beyond the announced $1.25 billion "reserve-building capacity." It clarifies a key distinction in the company's "BTC Monetization Program": selling Bitcoin to *build* a new dollar reserve (the $1.25B cap) versus selling to *replenish* the existing USD Reserve after it's used for expenses like preferred share dividends. The recent $216M BTC sale for dividend payments was a "replenishment," leaving the headline $1.25B building quota untouched. The plan actually outlines three potential funding pools from BTC sales: 1) Building the reserve ($1.25B cap), 2) Covering preferred share/ debt costs (no specified cap), and 3) Funding buyback programs (up to $20B). This means the structured sales potential exceeds $30 billion, not including uncapped replenishment sales. The piece argues this marks MicroStrategy's shift from a passive "buy-and-hold" Bitcoin proxy to an actively managed entity using BTC as a balance-sheet tool to manage its complex capital structure (common stock, preferred shares, debt, reserve). This creates new dynamics and potential conflicts, as actions benefiting one part (e.g., selling BTC to pay dividends) may pressure another (e.g., undermining the "never sell" narrative). Investors must now parse the company's specific terminology ("build" vs. "replenish") to understand the true scope of future BTC sales, which is significantly larger than the market initially perceived.

marsbit1h ago

Strategy's Bitcoin Sales Cap Far Exceeds $1.25 Billion: A Detail the Market Overlooked

marsbit1h ago

Goldman Sachs Report Deconstructs the Competitive Landscape of China's AI Large Models: Who Will Be the Long-Term Winner?

Goldman Sachs analyzes China's AI large language model (LLM) landscape, identifying key players and a strategic shift towards efficiency and global expansion. The report highlights that Chinese open-source/open-weight models are closing the performance gap with top global proprietary models at significantly lower cost, driven by architectural innovations like MoE. This enables a "two-tier" market: a high-end segment (e.g., GLM5.2, Qwen3.7 Max) with pricing at ~$1 per million tokens, and a low-end, price-sensitive global segment. Open-source strategies aid adoption but limit monetization, as deployments via third-party platforms (e.g., AWS Bedrock, Alibaba Cloud) may not generate direct revenue for model creators. The industry is thus moving towards "open-weight + community license" models with revenue-sharing to improve unit economics. Internationally, the focus is shifting from "token maximization" to ROI-driven enterprise adoption, particularly in non-U.S. markets. Major cloud platforms are integrating Chinese models (e.g., DeepSeek, MiniMax). Using a competitive framework based on pricing power, cost advantage, and financial strength, Goldman Sachs identifies **Zhipu AI** and **DeepSeek** as leaders in foundational text models, and **ByteDance** (with Seedance) leading in multimodal/video generation. **MiniMax** and **Kuaishou** are also rated favorably. The firm forecasts China's AI model API/subscription revenue growing from ~RMB 35bn (2026E) to RMB 879bn by 2030.

marsbit1h ago

Goldman Sachs Report Deconstructs the Competitive Landscape of China's AI Large Models: Who Will Be the Long-Term Winner?

marsbit1h ago

Trading

Spot

Hot Articles

What is $BITCOIN

DIGITAL GOLD ($BITCOIN): A Comprehensive Analysis Introduction to DIGITAL GOLD ($BITCOIN) DIGITAL GOLD ($BITCOIN) is a blockchain-based project operating on the Solana network, which aims to combine the characteristics of traditional precious metals with the innovation of decentralized technologies. While it shares a name with Bitcoin, often referred to as “digital gold” due to its perception as a store of value, DIGITAL GOLD is a separate token designed to create a unique ecosystem within the Web3 landscape. Its goal is to position itself as a viable alternative digital asset, although specifics regarding its applications and functionalities are still developing. What is DIGITAL GOLD ($BITCOIN)? DIGITAL GOLD ($BITCOIN) is a cryptocurrency token explicitly designed for use on the Solana blockchain. In contrast to Bitcoin, which provides a widely recognized value storage role, this token appears to focus on broader applications and characteristics. Notable aspects include: Blockchain Infrastructure: The token is built on the Solana blockchain, known for its capacity to handle high-speed and low-cost transactions. Supply Dynamics: DIGITAL GOLD has a maximum supply capped at 100 quadrillion tokens (100P $BITCOIN), although details regarding its circulating supply are currently undisclosed. Utility: While precise functionalities are not explicitly outlined, there are indications that the token could be utilized for various applications, potentially involving decentralized applications (dApps) or asset tokenization strategies. Who is the Creator of DIGITAL GOLD ($BITCOIN)? At present, the identity of the creators and development team behind DIGITAL GOLD ($BITCOIN) remains unknown. This situation is typical among many innovative projects within the blockchain space, particularly those aligning with decentralized finance and meme coin phenomena. While such anonymity may foster a community-driven culture, it intensifies concerns about governance and accountability. Who are the Investors of DIGITAL GOLD ($BITCOIN)? The available information indicates that DIGITAL GOLD ($BITCOIN) does not have any known institutional backers or prominent venture capital investments. The project seems to operate on a peer-to-peer model focused on community support and adoption rather than traditional funding routes. Its activity and liquidity are primarily situated on decentralized exchanges (DEXs), such as PumpSwap, rather than established centralized trading platforms, further highlighting its grassroots approach. How DIGITAL GOLD ($BITCOIN) Works The operational mechanics of DIGITAL GOLD ($BITCOIN) can be elaborated on based on its blockchain design and network attributes: Consensus Mechanism: By leveraging Solana’s unique proof-of-history (PoH) combined with a proof-of-stake (PoS) model, the project ensures efficient transaction validation contributing to the network's high performance. Tokenomics: While specific deflationary mechanisms have not been extensively detailed, the vast maximum token supply implies that it may cater to microtransactions or niche use cases that are still to be defined. Interoperability: There exists the potential for integration with Solana’s broader ecosystem, including various decentralized finance (DeFi) platforms. However, the details regarding specific integrations remain unspecified. Timeline of Key Events Here is a timeline that highlights significant milestones concerning DIGITAL GOLD ($BITCOIN): 2023: The initial deployment of the token occurs on the Solana blockchain, marked by its contract address. 2024: DIGITAL GOLD gains visibility as it becomes available for trading on decentralized exchanges like PumpSwap, allowing users to trade it against SOL. 2025: The project witnesses sporadic trading activity and potential interest in community-led engagements, although no noteworthy partnerships or technical advancements have been documented as of yet. Critical Analysis Strengths Scalability: The underlying Solana infrastructure supports high transaction volumes, which could enhance the utility of $BITCOIN in various transaction scenarios. Accessibility: The potential low trading price per token could attract retail investors, facilitating wider participation due to fractional ownership opportunities. Risks Lack of Transparency: The absence of publicly known backers, developers, or an audit process may yield skepticism regarding the project's sustainability and trustworthiness. Market Volatility: The trading activity is heavily reliant on speculative behavior, which can result in significant price volatility and uncertainty for investors. Conclusion DIGITAL GOLD ($BITCOIN) emerges as an intriguing yet ambiguous project within the rapidly evolving Solana ecosystem. While it attempts to leverage the “digital gold” narrative, its departure from Bitcoin's established role as a store of value underscores the need for a clearer differentiation of its intended utility and governance structure. Future acceptance and adoption will likely depend on addressing the current opacity and defining its operational and economic strategies more explicitly. Note: This report encompasses synthesised information available as of October 2023, and developments may have transpired beyond the research period.

718 Total ViewsPublished 2025.05.13Updated 2025.05.13

What is $BITCOIN

Discussions

Welcome to the HTX Community. Here, you can stay informed about the latest platform developments and gain access to professional market insights. Users' opinions on the price of BTC (BTC) are presented below.

活动图片