Ведущий трейдер предупреждает о Солане: прорыв ниже $117 может спровоцировать «медленное кровотечение»

cryptonews.ruPublished on 2024-09-30Last updated on 2025-03-31

  • Солана (SOL) тестирует критическую поддержку около $117 (горизонтальный + 1,618 уровень Фибоначчи)
  • Аналитик Mags выделяет вариант «бык» (отскок от $117) против варианта «медведь» (падение ниже $117)
  • Пара SOL/BTC также тестирует поддержку брелока после отклонения от трендовой линии

Solana (SOL) подвергается пристальному вниманию после того, как не смогла удержаться выше своей 20-дневной экспоненциальной скользящей средней (EMA) около $133. Этот уровень теперь выступает в качестве ключевого верхнего сопротивления для альткоина.

Токен SOL в настоящее время находится вблизи критической технической точки. Криптоаналитик «Mags» выделяет две отдельные возможности впереди: сильный отскок к новым максимумам или медленное снижение цены к более низким уровням поддержки.

Каковы два сценария Мэгса для SOL?

Mags отметил на X (ранее Twitter), что SOL достиг нового ATH ранее в этом цикле на уровне $295, но оказался неспособным поддерживать импульс выше него. Он также указал на значительную медвежью дивергенцию, появившуюся на еженедельном индексе относительной силы (RSI) примерно в то же время, что указывает на ослабление базовой силы перед недавним откатом.

Согласно анализу Мэгса, SOL сейчас тестирует ключевой горизонтальный уровень поддержки. Этот уровень, около $117, как сообщается, оставался сильным в течение последнего года и совпадает с отметкой коррекции Фибоначчи 1,618, полученной из предыдущего ценового колебания.

Дневной RSI в настоящее время составляет около 40. Магистр отметил, что этот уровень RSI ранее выступал в качестве сильной зоны поддержки для цены SOL во время предыдущих коррекций.
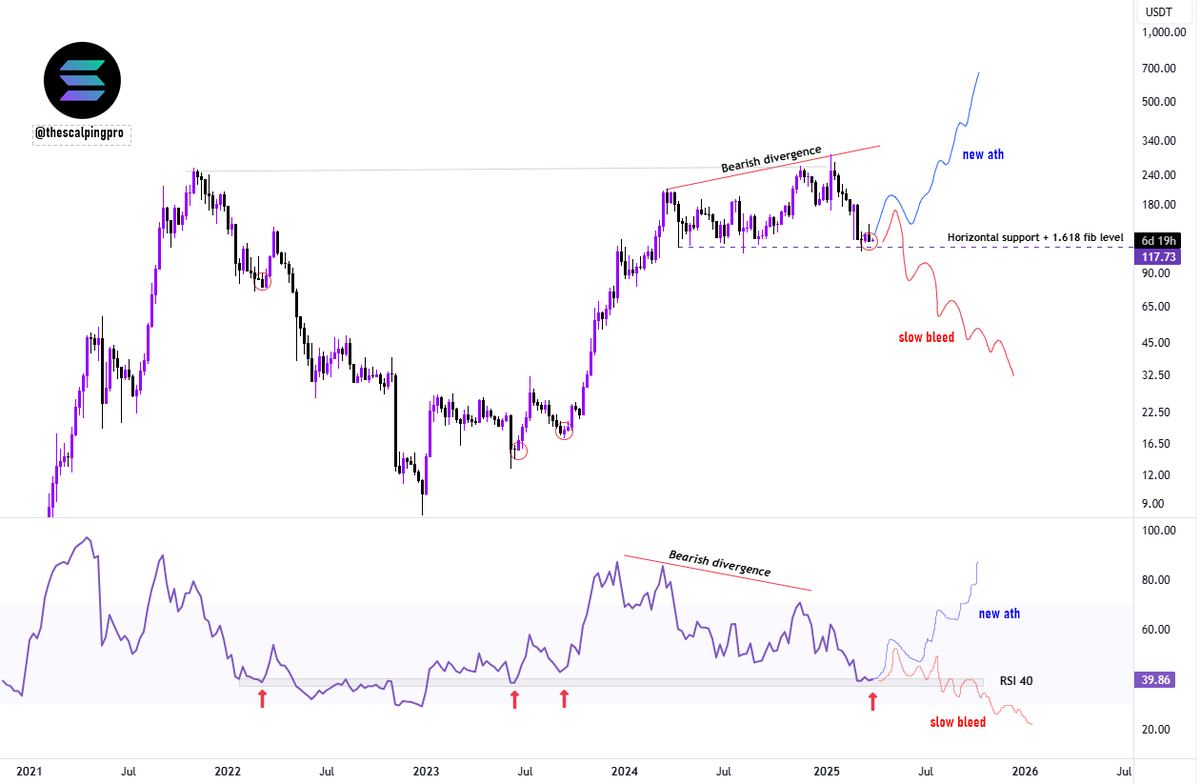
Он предполагает, что если история повторится, разворот цены может произойти из этого слияния горизонтальной поддержки и показаний RSI около 40, что позволит SOL потенциально восстановить восходящий импульс. Однако решительный прорыв ниже области $117 может вместо этого сигнализировать о продолжительном нисходящем давлении.

Мэгс выделил два основных сценария, основанных на текущих уровнях:

  • Бычий случай (синий сценарий): Если SOL удастся эффективно удержать уровень поддержки ~$117, может последовать сильный отскок. Это может потенциально привести к прорыву и продолжению движения к новым максимумам, подкрепленному RSI, у которого есть пространство для роста.
  • Медвежий сценарий (красный сценарий): Если любой отскок от текущих уровней будет слабым и не сможет удержаться, SOL может войти в модель «медленного кровотечения». Это подразумевает прорыв как горизонтальной поддержки, так и уровня Фибоначчи 1,618 около $117, что будет указывать на медвежье продолжение, нацеленное на более низкие ценовые уровни.

По теме: Настроения Соланы (SOL) стремительно растут: позитивных комментариев в 18 раз больше, чем негативных

Пара SOL/BTC также находится на ключевом техническом этапе

Торговая пара SOL/BTC отражает похожую ситуацию, также находясь на критическом техническом этапе, согласно Mags. Другой график, предоставленный аналитиком, показывает, что SOL недавно отклонился от долгосрочного сопротивления падающей трендовой линии против Bitcoin, сформировав более низкие максимумы.

#SOLBTC : SOL/BTC is also testing the 0.618 support level after facing rejection from the falling trendline, adding further confluence to the above scenarios. pic.twitter.com/DBHFyeYIjY

— Mags (@thescalpingpro) March 31, 2025

Родственный: Момент «прорыва» Соланы? Хакатон и BlackRock сигнализируют о растущей экосистеме

Пара SOL/BTC в настоящее время тестирует поддержку вблизи критического уровня Фибоначчи 0,618. Это добавляет техническое слияние, подчеркивая важность текущей зоны поддержки для производительности SOL относительно как доллара США, так и биткоина.

Это долгосрочное сопротивление трендовой линии SOL/BTC оставалось непоколебимым в течение нескольких месяцев, что указывает на постоянное избыточное давление продаж на SOL по сравнению с Bitcoin в течение этого периода. Если SOL/BTC сможет решительно восстановить эту трендовую линию, это может сигнализировать о бычьем возрождении Solana по сравнению с Bitcoin.

И наоборот, неспособность удержать текущую поддержку Фибоначчи 0,618 может привести к дальнейшему относительному снижению, потенциально подтверждая последствия медвежьей дивергенции, наблюдаемые на графике пары USDT.
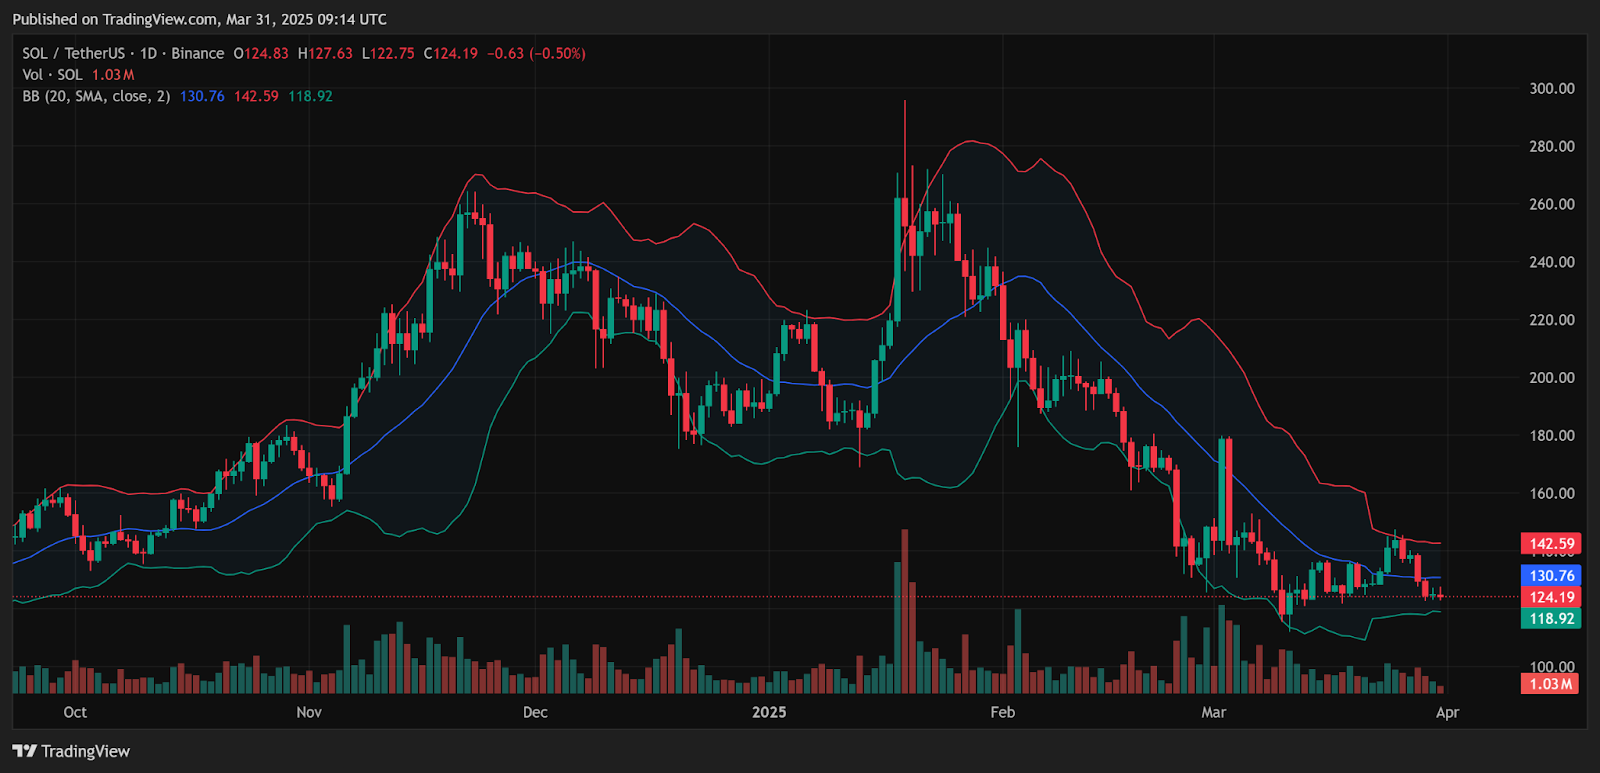
Если посмотреть на дневной график SOL/USDT, полосы Боллинджера (BB) предлагают дополнительный контекст. Цена в настоящее время торгуется ниже средней полосы BB (около $130,76). Сейчас она приближается к тесту поддержки нижней полосы BB, расположенной около $118,92.


Trending Cryptos

Related Reads

Collateral Dollars: How Does a 'Second-Layer Dollar' Above Stablecoins Form?

Collateral Dollars: How Does a "Second Layer of Dollars" Form on Top of Stablecoins? Most assume stablecoins replicate Eurodollar functions, expanding the offshore dollar system. However, stablecoins primarily replace specific functions like operational dollar balances for settlement. They do not inherently create new dollar credit; they substitute existing claims. The key question is: what happens when financial intermediaries use stablecoins as collateral to create a new layer of dollar-denominated claims? This "collateral dollar" channel operates through secured lending, not direct money creation. A money-like event only occurs when a liability issued against the controlled stablecoin is funded, rolled over, or accepted at near-par value by another balance sheet. The discount (haircut) prices the gap between "effective control over the token" and "reliable convertibility to bank dollars." Elasticity stems not from the stablecoin itself but from the liability issued against it and the willingness of third-party balance sheets to treat that liability as a near-par asset. Compared to the traditional Eurodollar system—where elasticity originates from bank deposit creation—the stablecoin collateral chain is structurally different. Eurodollar deposits are credit-expansive from inception. Stablecoins are initially substitutive; elasticity emerges later if an intermediary's liability against them gains monetary acceptance. Stablecoins disrupt specific tiers of the offshore dollar system, mainly replacing operational settlement balances. They do not replace the need for full dollar balance-sheet capacity (credit lines, hedging, maturity transformation). For systemic impact, the second-layer liability must pass three tests: transferability, funding capacity, and monetary acceptance (being fundable or held at par by others). Pressure transmission also differs. In the Eurodollar system, stress moves up a hierarchy of claims. In a stablecoin collateral chain, the second-layer liability can lose its money-like status well before the underlying stablecoin faces a run, often triggered by haircut increases and margin calls that create a dynamic spiral of falling token prices and rising discounts. In conclusion, the "collateral dollar" is not the stablecoin itself. It is the second-layer liability issued against a controlled token balance that is willing to be funded and maintained at near-par value. Its existence depends on that liability surviving the leap from "token liquidity" to "bank dollar liquidity."

marsbit52m ago

Collateral Dollars: How Does a 'Second-Layer Dollar' Above Stablecoins Form?

marsbit52m ago

Collateral Dollars: How the 'Second-Layer Dollar' Above Stablecoins Takes Shape?

"Collateralized Dollars: How a 'Second Layer of Dollars' Forms on Top of Stablecoins" Most assume stablecoins replicate Eurodollars and expand the offshore dollar system, but this is not accurate. Stablecoins primarily replace certain functions within the existing system, especially operational dollar balances for daily settlement. The critical question is what happens when financial intermediaries create a new layer of dollar claims *on top of* stablecoins. This article explains how this new collateralized funding channel works. Stablecoins introduce tokenized private dollar claims. Even if issuers and reserves are within the US legal perimeter, their circulation and use as collateral can become economically "offshore." Enforceable control over collateral opens a secured credit channel but does not itself create a monetary claim. A true monetary event occurs only when another balance sheet funds, rolls over, or accepts a liability issued against the controlled token at near-par value. The discount prices the gap between "effective control over the token" and "reliable convertibility into bank dollars." Elasticity comes from the balance sheet issuing the liability against the token and from third-party willingness to treat that liability as a near-par asset. Collateralized Dollars are not the stablecoins themselves; they are the second-layer liability that another balance sheet is willing to issue, fund, and maintain at near-par against a controlled token balance. The Eurodollar system is a hierarchy of claims, with elasticity originating in expandable bank liabilities. In contrast, the stablecoin collateral chain starts with a tokenized asset. It gains systemic significance only when an intermediary's liability against that token is treated as money-like by other balance sheets. Key determining factors include: who has effective control, the legal/operational path to bank dollars, and whether the resulting claim can still be financed near-par under stress. Pressure in this new channel manifests differently. The upper-layer (intermediary) claim fails first, losing its money-like status, potentially while the underlying stablecoin remains solvent. Increased haircuts and forced sales can create a destructive feedback loop, widening the very gap the discount measures. In conclusion, the Eurodollar analogy has limits. Reserve quality supports the underlying token's solvency, but the leverage, credit, and liabilities built atop it face a separate test. Collateral eligibility is not monetary acceptance. Only when a claim built on stablecoins survives the leap from "token liquidity" to "bank dollar liquidity" do Collateralized Dollars truly exist.

链捕手58m ago

Collateral Dollars: How the 'Second-Layer Dollar' Above Stablecoins Takes Shape?

链捕手58m ago

Don't Be Misled by the $1.25 Billion Cap: MicroStrategy's Three-Pronged Bitcoin Sale Pools Hide Massive Selling Pressure

Don't Be Misled by the $1.25B Cap: Strategy's Three-Tier Bitcoin Sales Plan Hides Massive Potential Selling Pressure Strategy recently sold 3,588 BTC (~$216M) to fund a dividend and replenish its dollar reserve, while claiming its $1.25B "reserve build" capacity remains fully available. This highlights a key nuance: the widely cited $1.25B limit applies only to sales for "Building" the reserve. Strategy's broader capital framework, however, allows Bitcoin sales for three primary purposes, each with different scales: 1. **Building the Reserve:** Selling BTC to raise up to $1.25B for the reserve. 2. **Covering Priority Share Expenses:** Selling BTC to pay dividends/interest or to replenish the reserve after such payments are made from it (no specified limit). 3. **Share Repurchase Funding:** Selling BTC to fund up to $1B each in convertible note and common stock repurchases (totaling $2B potential). Combined, just the capped "Build" and "Repurchase" channels could facilitate over $3B in Bitcoin sales, excluding the uncapped "Cover Expenses" channel. The accounting distinction between "Building" (adding cash before a payout) and "Replenishing" (adding cash after a payout) is operationally blurry but allows sales like the recent $216M transaction without touching the $1.25B "Build" quota. This gives Strategy significant flexibility. The move signifies a strategic shift: Strategy is transforming from a simple Bitcoin accumulator into an active capital manager, akin to a hedge fund. Bitcoin is now a financial lever to balance pressures between common stock, convertible notes, dollar reserves, and Bitcoin holdings. This creates inherent tensions—actions benefiting one part of the capital structure may harm another. Investors must understand that the potential Bitcoin sales are far greater than the surface-level $1.25B figure. Strategy has become a complex financial entity where every term in its disclosures matters. Betting on it now is a wager on its active capital management skill to navigate these internal contradictions without a systemic failure.

Foresight News1h ago

Don't Be Misled by the $1.25 Billion Cap: MicroStrategy's Three-Pronged Bitcoin Sale Pools Hide Massive Selling Pressure

Foresight News1h ago

Trading

Spot

Hot Articles

Discussions

Welcome to the HTX Community. Here, you can stay informed about the latest platform developments and gain access to professional market insights. Users' opinions on the price of SOL (SOL) are presented below.

活动图片