Bitcoin (BTC) has been clinging to the 200-day simple moving average ($84,359), which suggests that the bulls have kept up the pressure. That improves the prospects of an upside breakout, signaling the corrective phase may be ending.
Derive founder Nick Forster told Cointelegraph that the current pullback is a normal correction that Bitcoin experiences during long-term rallies. He anticipates that Bitcoin’s cycle peak is yet to come.
A positive sign in favor of bulls is that the US spot Bitcoin exchange-traded funds (ETFs) have again started to witness inflows. According to Farside Investors data, spot Bitcoin ETFs have recorded $525 million in inflows since March 14.

Crypto market data daily view. Source: Coin360
However, not everyone is bullish on Bitcoin. CryptoQuant founder and CEO Ki Young Ju said in a post on X that Bitcoin could remain in a bearish or sideways trend for the next 6-12 months as the bull cycle is over.
Could Bitcoin break out of the 200-day SMA, triggering a rally in altcoins? Let’s analyze the charts of the top 10 cryptocurrencies to find out.
Bitcoin price analysis
Bitcoin is facing selling at the 200-day SMA, but the bulls have not given up much ground. That suggests the bulls are not dumping their positions as they expect a breakout in the near term.
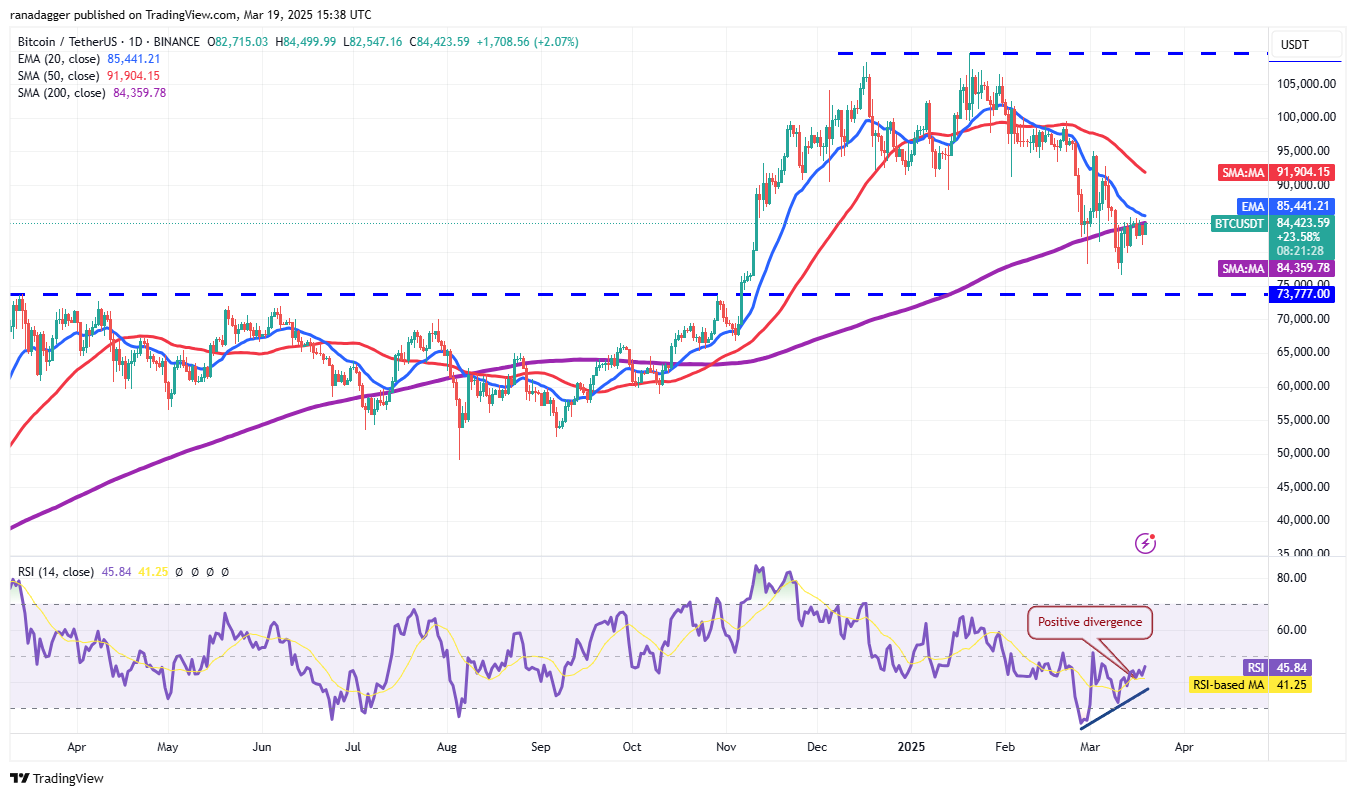
BTC/USDT daily chart. Source: Cointelegraph/TradingView
The bullish momentum is expected to pick up on a break and close above the 20-day exponential moving average ($85,441). The BTC/USDT pair could then climb to the 50-day SMA ($91,904).
This optimistic view will be negated in the near term if the price turns down sharply from the 20-day EMA and breaks below $80,000. The pair may then tumble to $76,606. Buyers are expected to defend the $76,606 to $73,777 zone with all their might.
Ether price analysis
The narrow range trading in Ether (ETH) resolved to the upside on March 19, indicating that the bulls have overpowered the bears.

ETH/USDT daily chart. Source: Cointelegraph/TradingView
Sellers will try to halt the relief rally at the breakdown level of $2,111, but if the bulls prevail, the ETH/USDT pair could ascend to the 50-day SMA ($2,468). If this level is also crossed, the pair could surge to $2,850.
Instead, if the price turns down sharply from $2,111, it will signal that the bears are trying to flip the level into resistance. The bears will gain the upper hand if they sink and maintain the price below $1,800.
XRP price analysis
XRP (XRP) surged above the moving averages on March 19, opening the doors for a rally to the resistance line.

XRP/USDT daily chart. Source: Cointelegraph/TradingView
If the price turns down from the resistance line, the XRP/USDT pair is likely to find support at the 20-day EMA ($2.36). A bounce off the 20-day EMA increases the likelihood of a break above the resistance line. The pair may then climb to $3.
On the other hand, if the price turns down from the resistance line and breaks below the moving averages, it heightens the risk of a drop to $2. Sellers will be in control on a close below $2.
BNB price analysis
BNB (BNB) closed above the 50-day SMA ($618) on March 17, but the bulls are struggling to sustain the higher levels.

BNB/USDT daily chart. Source: Cointelegraph/TradingView
The pullback is expected to find support at the 20-day EMA ($602). If the price rebounds off the 20-day EMA with strength, it will suggest a change in sentiment from selling on rallies to buying on dips. That increases the possibility of a break above $644. The BNB/USDT pair could then rally to $686.
Conversely, a break and close below the 20-day EMA suggests that the bulls are booking profits. That may sink the pair to $550.
Solana price analysis
Solana (SOL) rebounded off the $120 to $110 support zone on March 18, indicating that the bulls are aggressively defending the zone.

SOL/USDT daily chart. Source: Cointelegraph/TradingView
If buyers catapult the price above the 20-day EMA ($137), it will suggest the start of a sustained recovery. The SOL/USDT pair could rally to the 50-day SMA ($167) and, after that, to $180.
Contrarily, if the price turns down from the 20-day EMA, it will signal that the bears remain in control. A break below the support zone suggests the start of the next leg of the downtrend. There is minor support at $98, but if the level breaks down, the pair could plummet to $80.
Cardano price analysis
Cardano (ADA) has been trading between the uptrend line and the moving averages for the past few days, indicating indecision about the next directional move.

ADA/USDT daily chart. Source: Cointelegraph/TradingView
The downsloping moving averages and the RSI just below the midpoint give a slight edge to the bears. If the price turns down from the moving averages and breaks below the uptrend line, the ADA/USDT pair could drop to $0.58 and eventually to $0.50.
On the contrary, a break and close above the moving averages suggests that the bulls are back in the game. The pair could ascend to $1.02, where the bears are expected to sell aggressively.
Dogecoin price analysis
Dogecoin (DOGE) is facing selling near the 20-day EMA ($0.18), indicating that the bears are active at higher levels.

DOGE/USDT daily chart. Source: Cointelegraph/TradingView
The bears will try to sink the price below the $0.14 support. If they manage to do that, it will signal the resumption of the downtrend. The DOGE/USDT pair could plunge to psychological support at $0.10.
If buyers do not give up much ground from the current level, it improves the prospects of a break above the 20-day EMA. If that happens, the pair could climb to $0.25 and thereafter to $0.29.
Chainlink price analysis
Chainlink (LINK) has risen to the 20-day EMA ($14.66), but the bulls are expected to face stiff resistance from the bears.

LINK/USDT daily chart. Source: Cointelegraph/TradingView
If the price turns down from the 20-day EMA, the bears will again try to sink the LINK/USDT pair below the $12 support. If they manage to do that, the pair could descend to the crucial support at $10.
Alternatively, a break and close above the 20-day EMA suggests that the breakdown below the channel was a bear trap. The pair may climb to the 50-day SMA ($17.22) and later to $19.25.
UNUS SED LEO price analysis
UNUS SED LEO (LEO) has been trading in a tight range between $10 and $9.60 for the past few days, suggesting that the bulls are holding on to their positions as they anticipate a move higher.

LEO/USD daily chart. Source: Cointelegraph/TradingView
If buyers drive and maintain the price above $10, the LEO/USD pair will complete a bullish ascending triangle pattern. The pair may then start an upmove toward the pattern target of $12.04.
Contrary to this assumption, if the price turns down and breaks below $9.60, it will signal that the bulls have given up. The pair may then drop to the uptrend line, which is again expected to attract buyers.
Toncoin price analysis
Toncoin (TON) has been facing resistance at the 50-day SMA ($3.56), but a positive sign is that the bulls have not ceded ground to the bears.

TON/USDT daily chart. Source: Cointelegraph/TradingView
That increases the likelihood of a break and close above the 50-day SMA. If that happens, the TON/USDT pair could climb to $4.50 and then to $5. Sellers are expected to mount a vigorous defense near $5.
This positive view will be invalidated in the near term if the price turns down and breaks below the 20-day EMA ($3.26). That will indicate selling at higher levels. The pair may then slump to $3.
This article does not contain investment advice or recommendations. Every investment and trading move involves risk, and readers should conduct their own research when making a decision.