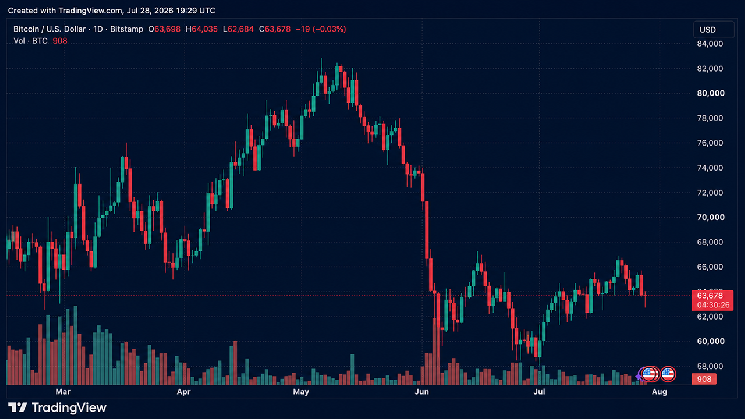
Pal, the founder of the financial media platform Real Vision and a former Goldman Sachs hedge fund manager, is one of the most authoritative macroeconomics experts in the cryptocurrency sphere, closely followed by many. For the past seven months, he has primarily argued that digital asset prices are determined by liquidity conditions, not fundamentals. In his post on X, Pal explained:
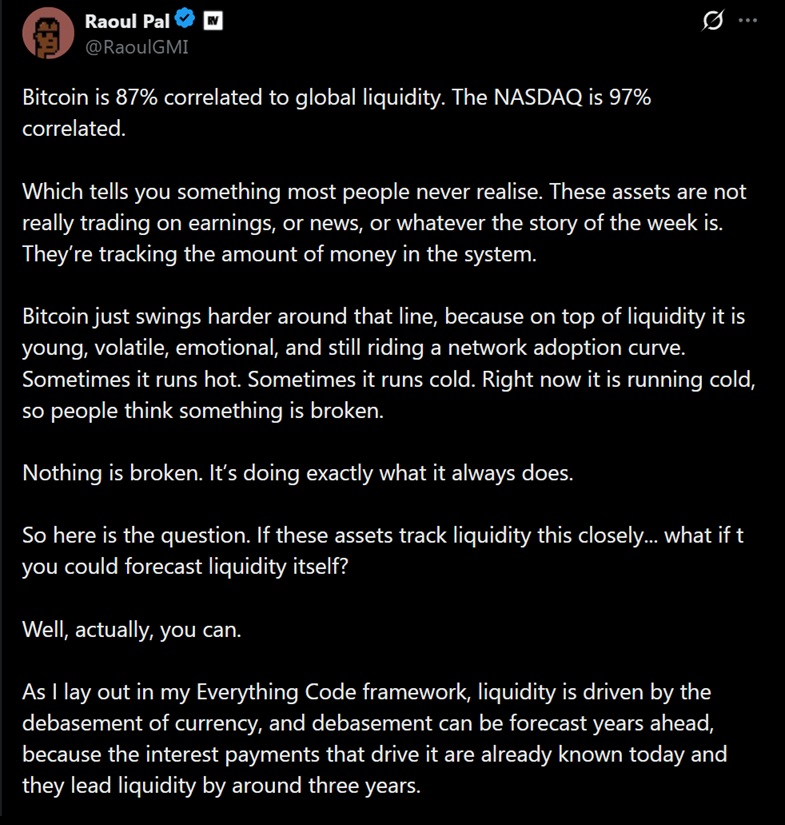
"Bitcoin is 87% correlated with global liquidity. The Nasdaq index is 97%. This reveals something most people never realize. These assets aren't actually trading based on earnings, news, or some event of the week. They are tracking the amount of money in the system."
Global liquidity refers to the total volume of funds available for injection into financial markets, typically measured by central bank balance sheets, the global M2 indicator (broad money supply), and growth in bank lending.
Analysts at crypto market maker Keyrock developed an eight-month lag model tracking how Treasury bill issuance affects Bitcoin's yield—this model supports Pal's claim of a correlation. The firm's net liquidity indicator, defined as the Federal Reserve's balance sheet minus Treasury cash balances and reverse repo operation balances, aims to isolate the amount of spending power actually entering markets at a given time.
A Familiar Theory, Updated Data
The figures cited by Pal build upon a position he elaborated on in May, when he told Real Vision viewers that Bitcoin maintains approximately a 90% correlation with the global money supply, arguing that governments' reliance on issuing short-term debt forces central banks to inject liquidity in a recurring cycle.
"Every four years there is a rollover of global debt, and central banks are forced to inject liquidity to avoid systemic collapse," Pal stated then. This thesis underpins his $450,000 Bitcoin price target, which he says is contingent on whether central banks can significantly expand liquidity by year-end.
An Even Tighter Correlation with the Nasdaq
An even more striking figure in Pal's post may be the 97% correlation he assigned to the Nasdaq—the U.S. stock index dominated by technology companies. Such a tight correlation suggests Bitcoin and mega-cap tech stocks are now trading as near-identical indicators of the same liquidity conditions, rather than distinct asset classes reacting to different catalysts. This stance contradicts the notion that Bitcoin trades primarily driven by its own supply dynamics, halving cycles, or adoption news.
Pal is not alone in making this argument: MicroStrategy (Nasdaq: MSTR) Executive Chairman Michael Saylor stated earlier this month that the traditional four-year Bitcoin cycle defined by halving "is no longer the dominant model," pointing instead to ETF inflows, corporate treasury Bitcoin accumulation, sovereign reserves, and global liquidity conditions as more significant drivers. He added:
Over the next decade, Bitcoin's trajectory will be less determined by miner issuance and more by capital flows.
That said, neither Pal nor the correlation data cited in his post are accompanied by an original dataset or published methodology, and the strength of the relationship between Bitcoin and liquidity has fluctuated throughout 2026 as liquidity impulses have waxed and waned. Keyrock's own tracking shows Bitcoin's reaction to Treasury issuance lags by about eight months, meaning any current correlation metrics likely reflect liquidity conditions from several months ago, not in real-time.
The next major factor that could challenge the Real Vision founder's thesis will be whether central banks continue the balance sheet expansion he says is necessary to sustain his $450,000 target.