Aave Whale "Midnight Pump" Drains Borrowers of $6 Million Every Night, Who's Behind This?

marsbitDipublikasikan tanggal 2026-07-29Terakhir diperbarui pada 2026-07-29

Abstrak

A "whale" is repeatedly causing interest rate spikes on Aave's USDC pool by temporarily withdrawing nearly $190 million in liquidity every night around 23:30 UTC and returning it within an hour. This action, tracked to a specific Ethereum address, spikes the pool's utilization above its 92% target, sharply increasing variable borrowing rates for all users in the pool during that window. Analysis suggests this is likely a fund performing a daily compliance ritual—withdrawing funds to prove ownership for a snapshot before redepositing them. While the time window for these withdrawals has tightened from June to July, the practice imposes a significant cost. Calculations show this activity costs borrowers in the pool an extra $1.7 million per year. For context, a single $1 million loan incurs about $3,280 in extra annual interest. The transparency of DeFi exposes how traditional financial compliance processes can create a hidden tax for decentralized finance users, highlighting a need for adapted regulatory frameworks.

Author: Cooper Duschang

Compiled by: Deep Tide TechFlow

Deep Tide Guide: Someone is draining $190 million in liquidity from Aave's USDC pool every night and returning it half an hour later—this operation is forcing all borrowers to pay an extra $6 million in interest annually. Deep Tide tracked the on-chain flow of funds and found this is most likely a mandatory daily process for a certain fund to prove to its investors that "we indeed hold this money." The transparency of DeFi has exposed the invisible tax that traditional financial compliance processes impose on on-chain users.

Core Discovery

Since May, the utilization rate of Aave's USDC pool has been spiking daily during the midnight UTC period. The reason is that someone withdraws $190 million USDC around 23:30 and deposits it back within an hour. This affects the interest rates for all lenders and borrowers in the pool.

By tracing the fund flow from this wallet, we found the behavior most consistent with the explanation: a certain institution needs to withdraw funds from the DeFi pool daily to take a snapshot proving asset ownership, and then deposit them back.

This "pump-and-dump" time window has become increasingly tight in July, consistently centered around midnight UTC. Compared to a scenario with no liquidity withdrawal, this operation is causing all USDC borrowers to pay an extra $6 million per year.

How Does Aave's Utilization Mechanism Work?

Aave's dual-interest rate model incentivizes borrowing and lending based on a target utilization rate. When utilization is below the target, the interest rate increases slowly; when it exceeds the target, the rate spikes sharply. The utilization formula is (Total Borrowed / Total Deposited). For example, the more assets borrowed, the closer the utilization gets to 100%.
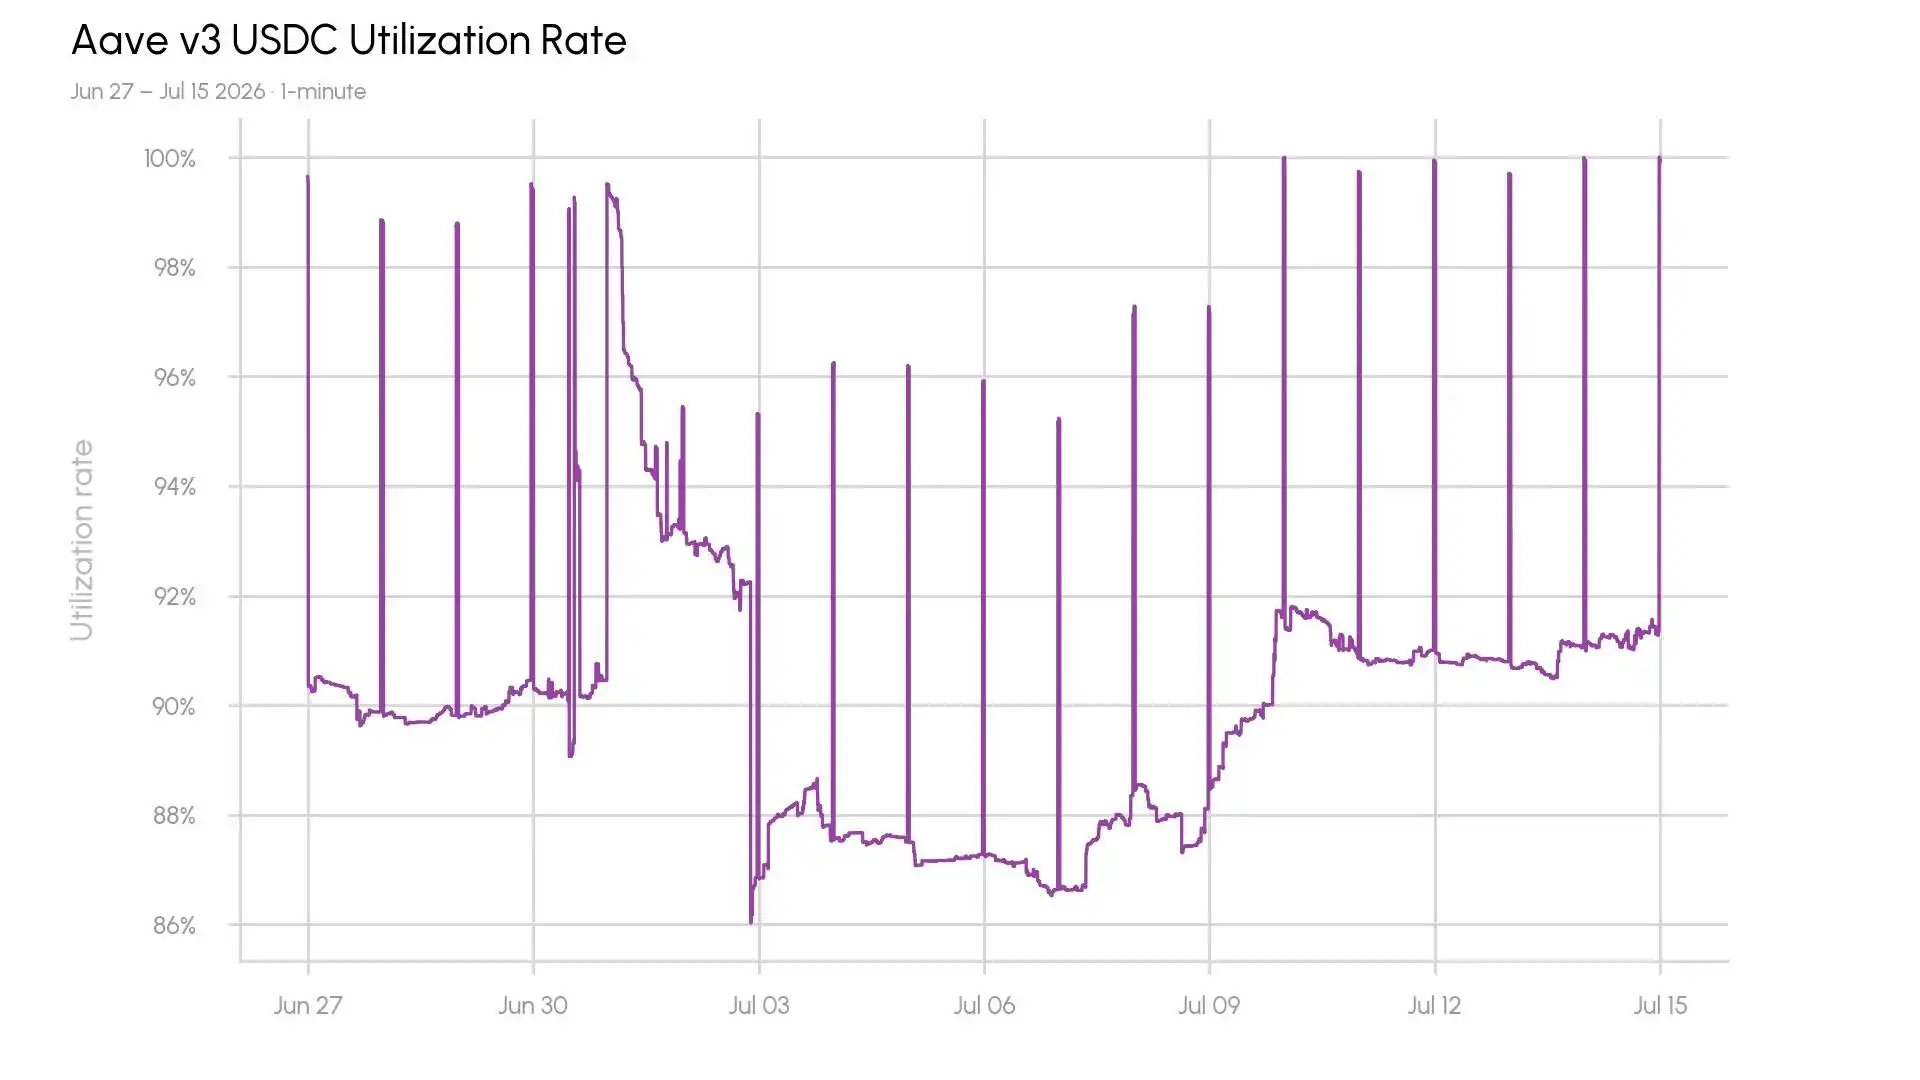
Figure: Aave's dual-interest rate model—the borrowing rate curve steepens sharply after exceeding the target utilization rate (e.g., 92%). Source: Coin Metrics / Talos

The target utilization rate for the USDC market on Aave's Ethereum main instance is 92%. After exceeding the target, the interest rate curve becomes very steep—from 92% to 100% utilization, the borrowing rate skyrockets from 4% to 14%. This discourages borrowing demand or encourages more people to deposit USDC to meet the demand.

The utilization rate in Aave's USDC market typically fluctuates around 90%. However, since May, minute-level data shows repeated sharp spikes in utilization.
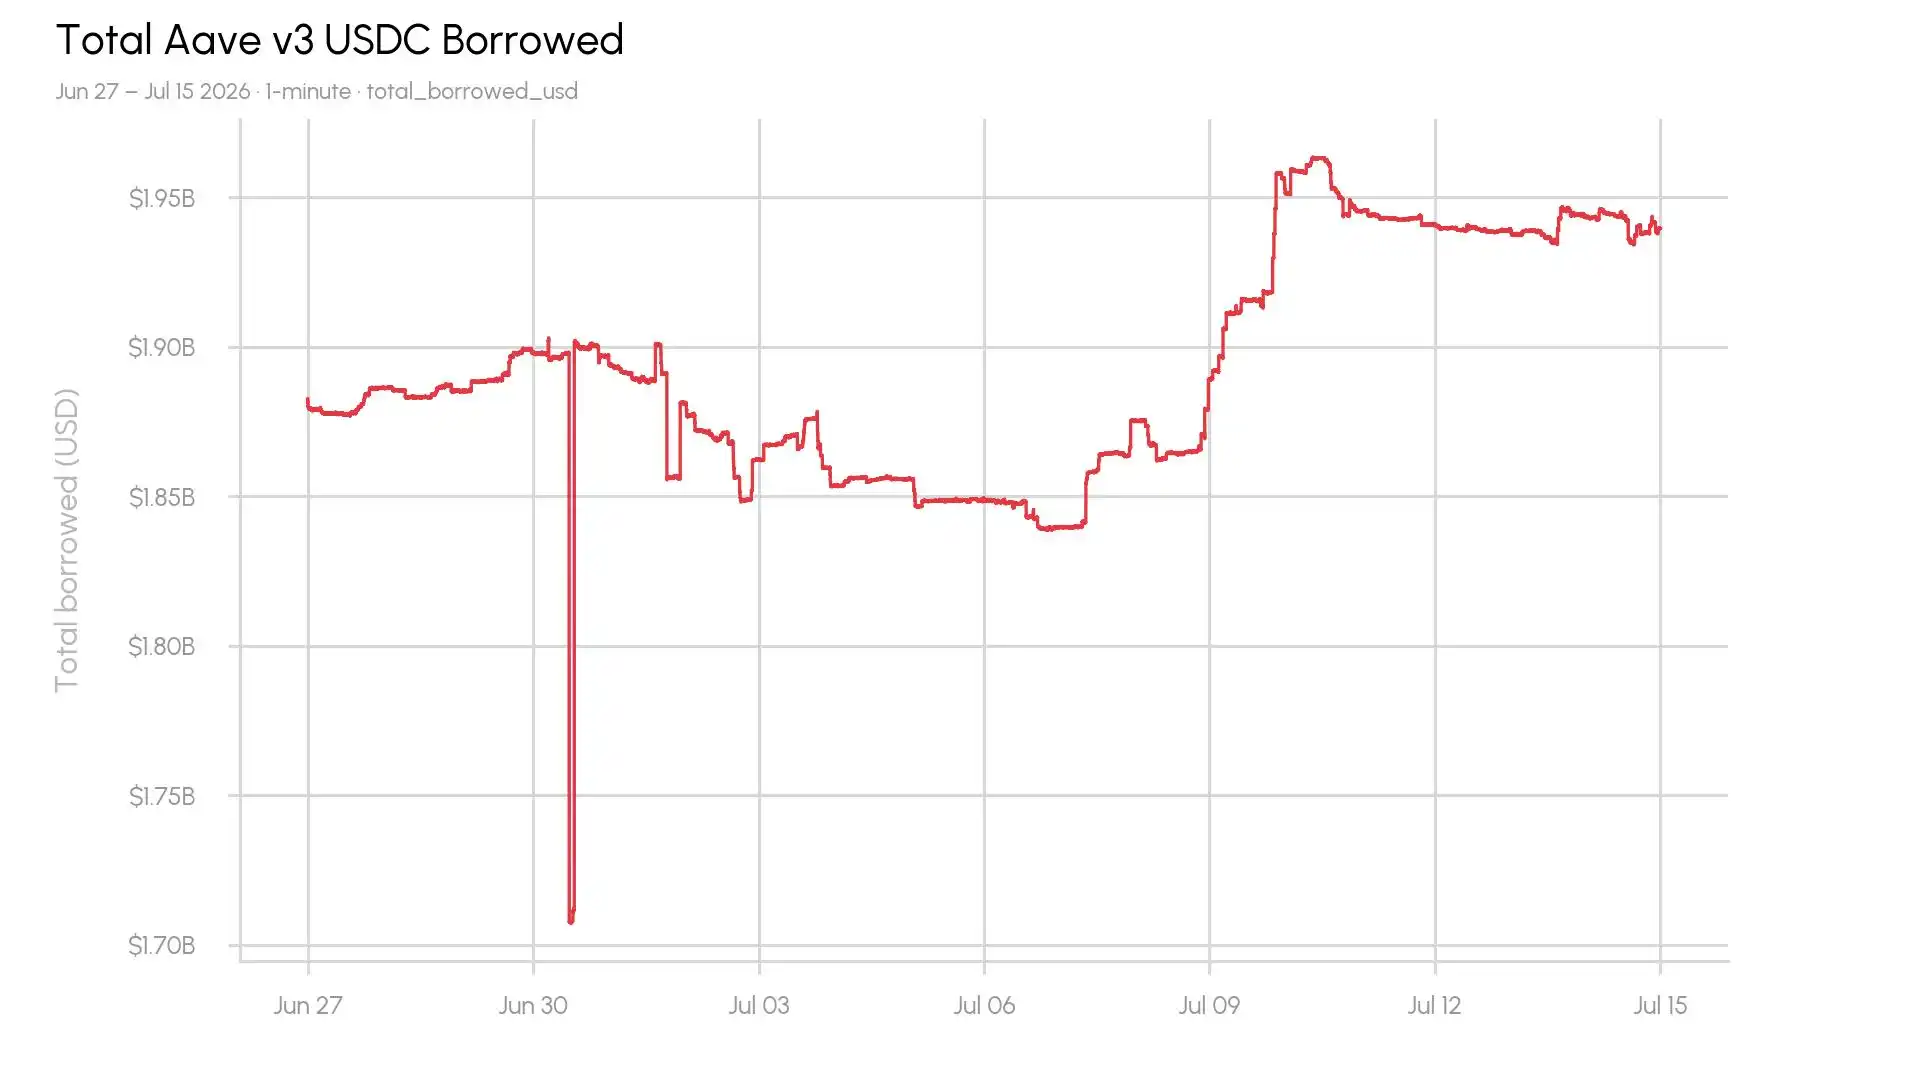
Figure: Minute-level data of Aave USDC market utilization, showing regular midnight spikes since May. Source: Coin Metrics / Talos

Why Do These Spikes Occur?

Excluding governance adjustments or oracle manipulation, only two variables affect the utilization rate: the amount of USDC deposited and the amount borrowed.

Apart from a brief dip in borrowing, the total borrowed amount has averaged $1.89 billion since June 27th. If borrowing hasn't consistently surged—which would push utilization higher—then the amount of USDC deposited must be plummeting.

Between 23:30 UTC and latest 00:30 UTC, over $150 million in USDC deposits are withdrawn and redeposited. The available borrowing liquidity plummets from about $210 million to as low as $33,000.
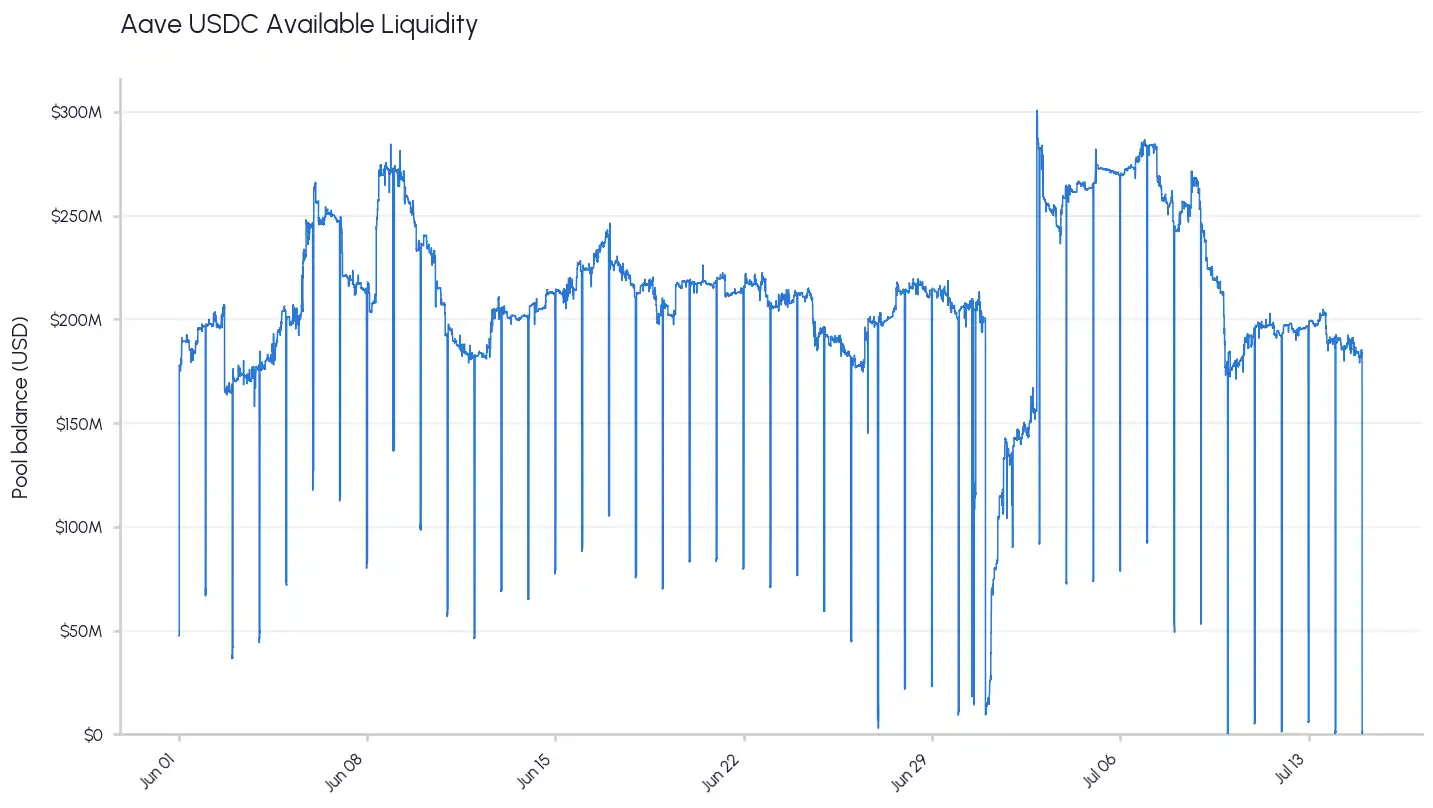
Figure: Over $150 million USDC withdrawn and redeposited daily between 23:30–00:30 UTC, available liquidity crashes from ~$210 million to a low of $33k. Source: Coin Metrics / Talos

Who Is Creating These Spikes?

Ethereum's pseudonymity allows us to publicly track addresses and transactions without exposing the user or intent. We found the address moving $190 million every night: 0x56957E411Ea83a0B4A0689C1fB0D1e5eA0d20149.
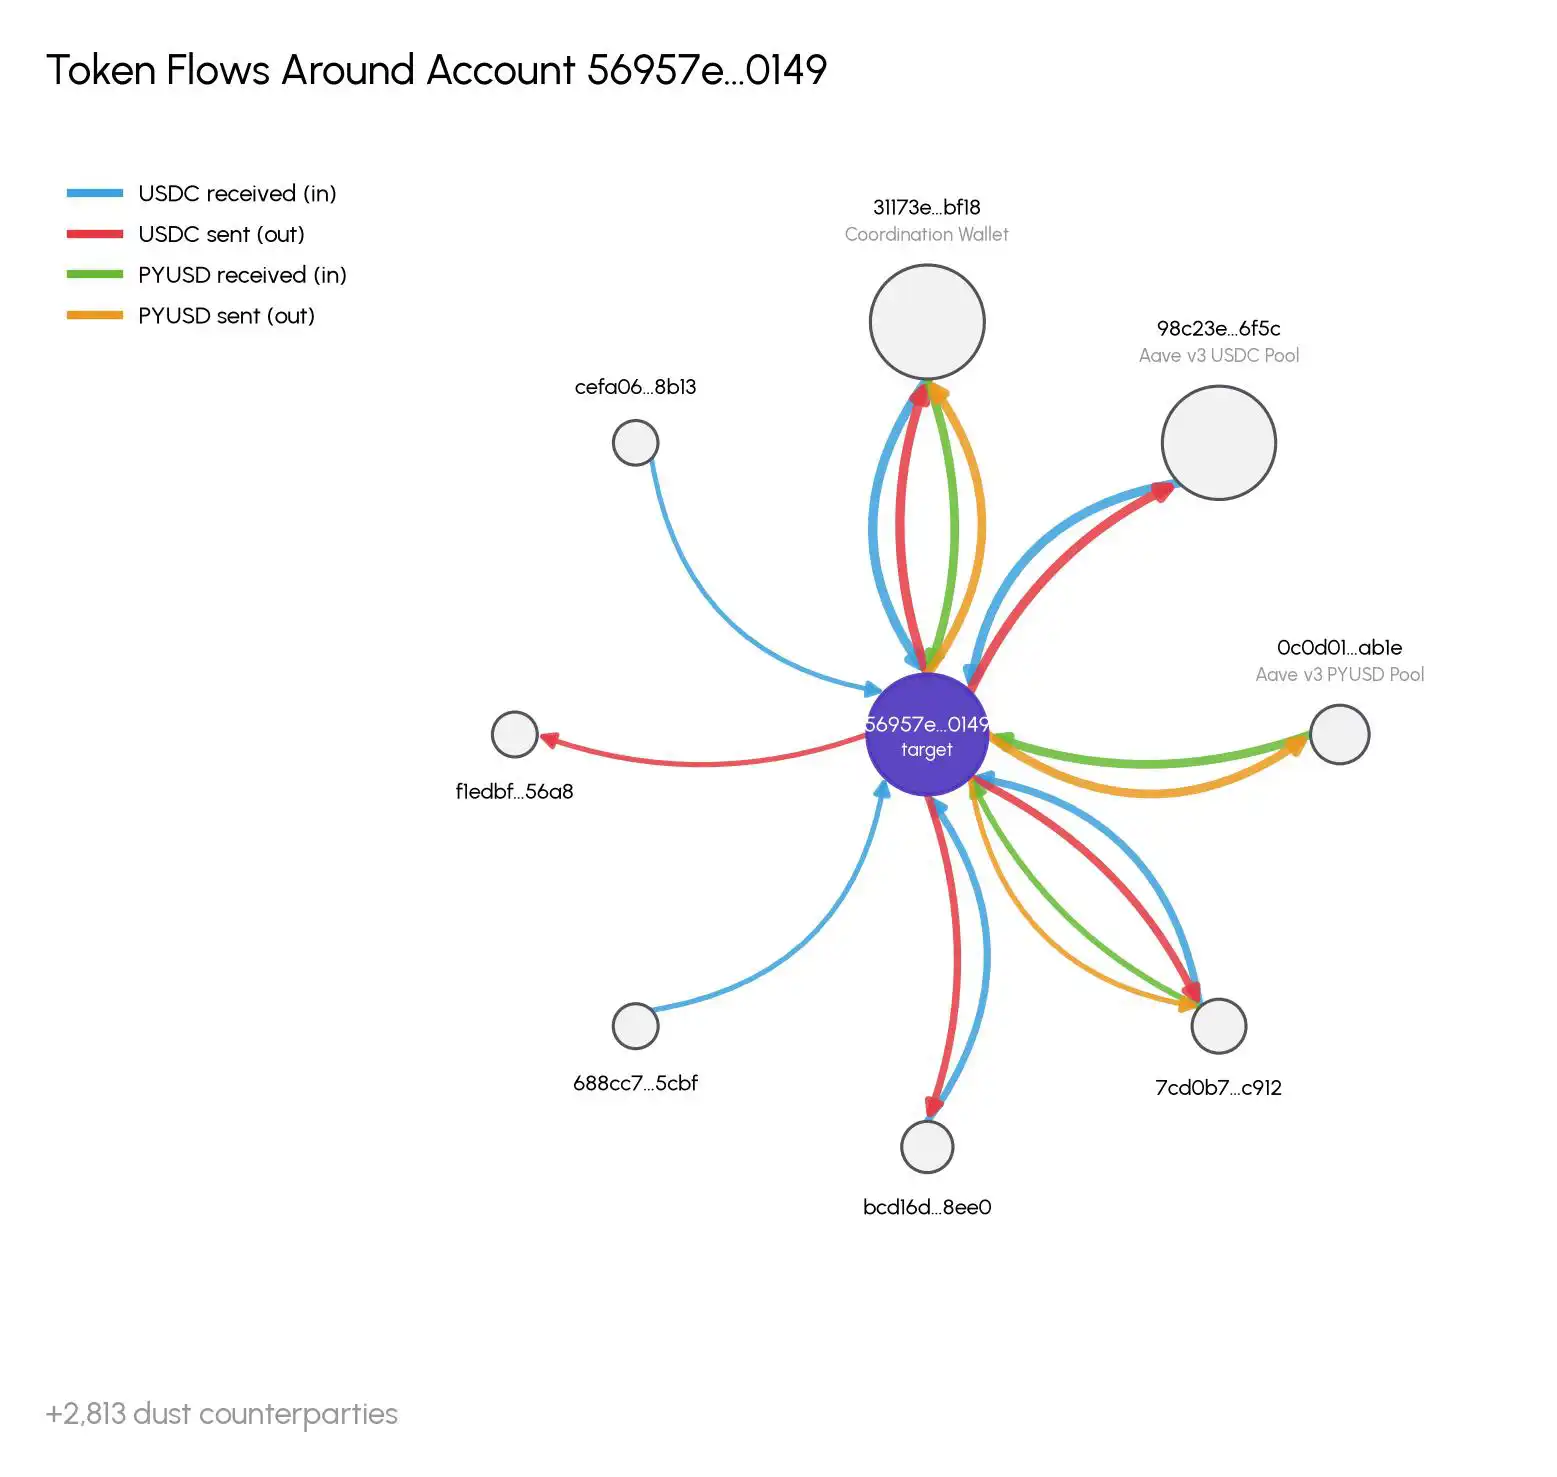
Figure: Fund flow path of the involved address 0x5695...0149, withdrawing liquidity from Aave for a snapshot each night before returning it. Source: Coin Metrics / Talos

This account received funds on December 5th, 2025. Examining balance changes and fund flows, we traced that the target address performed similar operations on Aave's PYUSD pool in December and January. The target address receives USDC, deposits it into the Aave pool, withdraws around 23:30 UTC, and sends it to 0x31173Ed183e5a9450C3671018ec4d770c8A8bF18 a few minutes later. The USDC is then returned shortly after 00:00 UTC and redeposited into the Aave pool.

This "coordinating wallet" 31173e...bf18 receives funds from the target address and another address holding sUSDS by depositing USDC to earn yield. This combined capital is sent nightly to a third, upper-level wallet: 0xf1edbf98dda764ec51de3776371f0f7d6f6156a8.

This is likely a process where an investor is required to prove their holdings daily by withdrawing liquidity from DeFi pools for snapshot purposes.

From June to July, the average time window for pumping and dumping has tightened. The withdrawal time shifted from 23:20 to 23:34, and the return time shortened from 00:34 to 00:09. The average interval between withdrawal and return was 259 blocks in June, shrinking to 177 blocks in July.
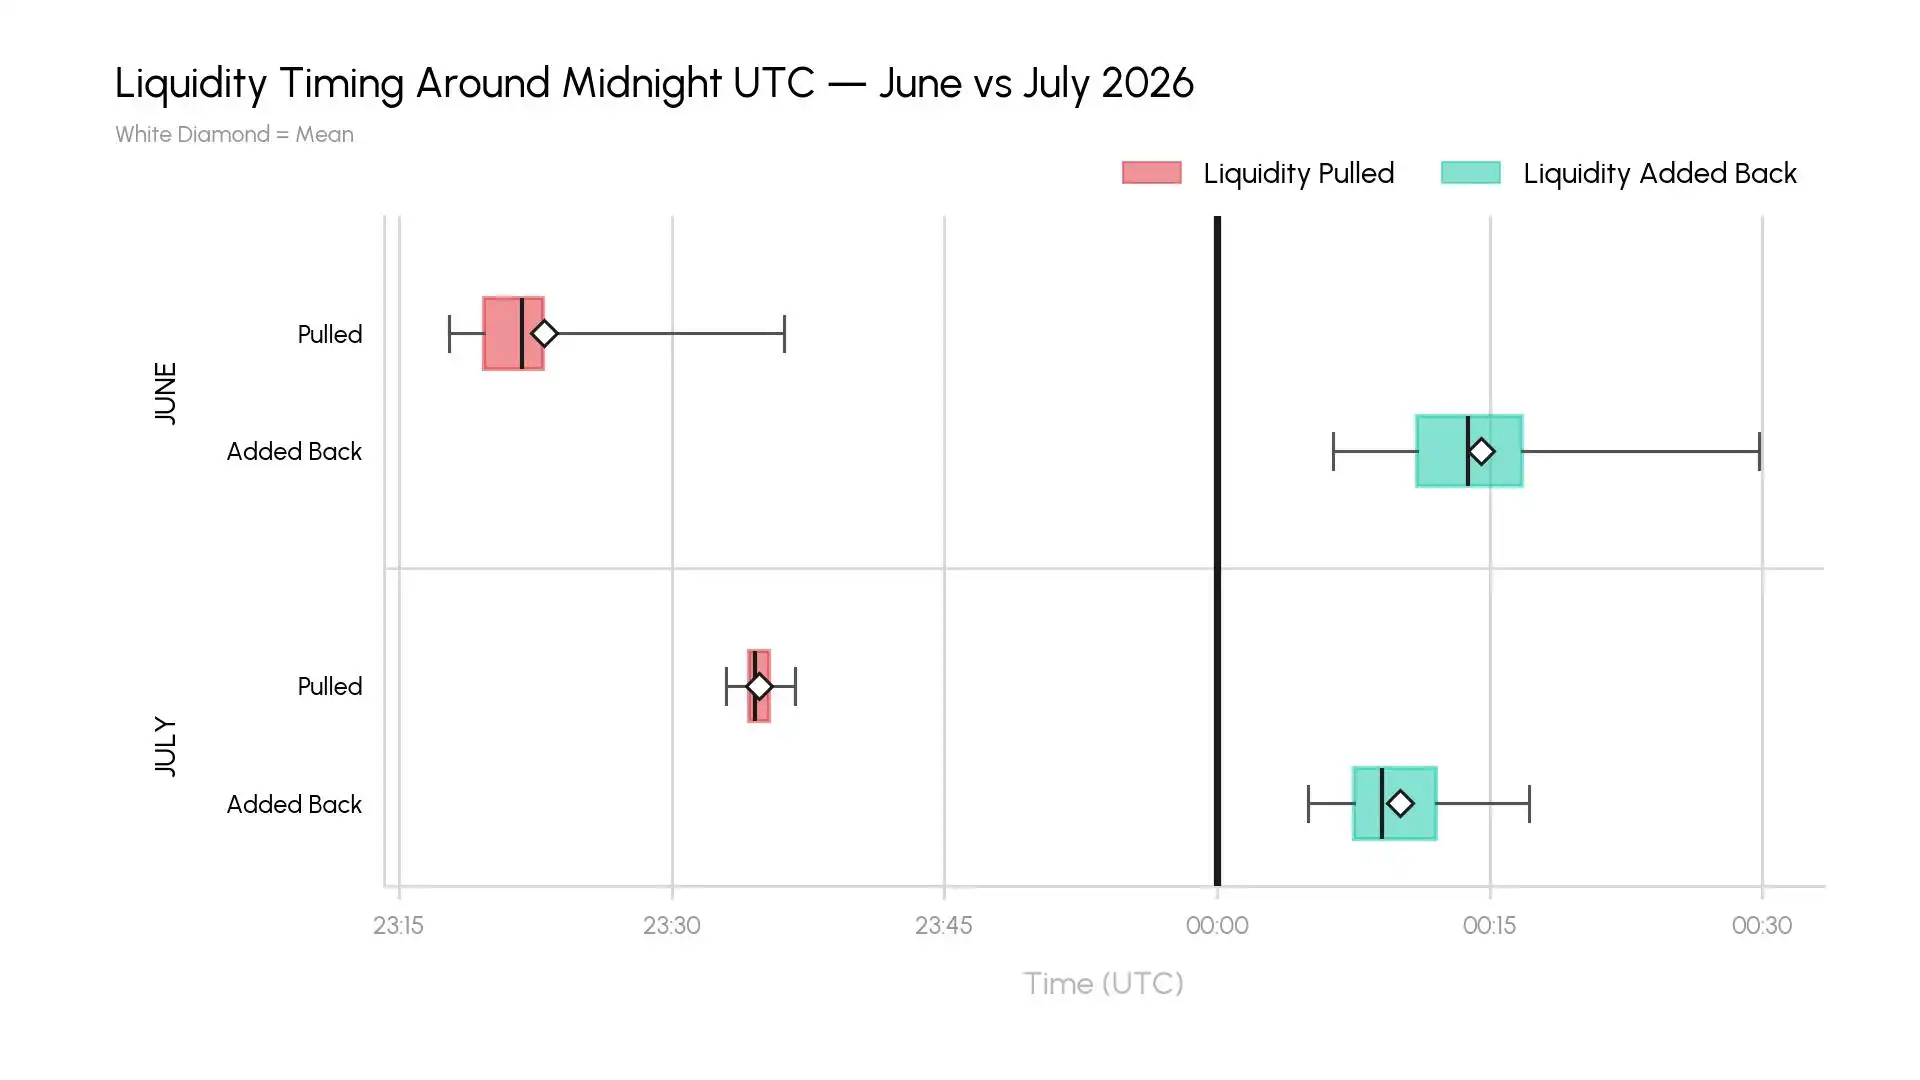
Figure: The withdrawal and return time window tightened from June to July, with the interval shortening from an average of 259 blocks to 177 blocks. Source: Coin Metrics / Talos

What Is the Impact on Borrowers?

The utilization spikes caused by liquidity withdrawal benefit depositors but harm borrowers. When utilization spikes, the floating borrowing rate also spikes, leading to temporarily higher repayments calculated per block.

Yield or interest on Aave is streamed per block. With an average Ethereum block time of 12 seconds, about 5 blocks are produced per minute. We decomposed the floating borrowing APR to simulate how a $1 million borrowing position is affected by minute-by-minute changes in the borrowing rate.
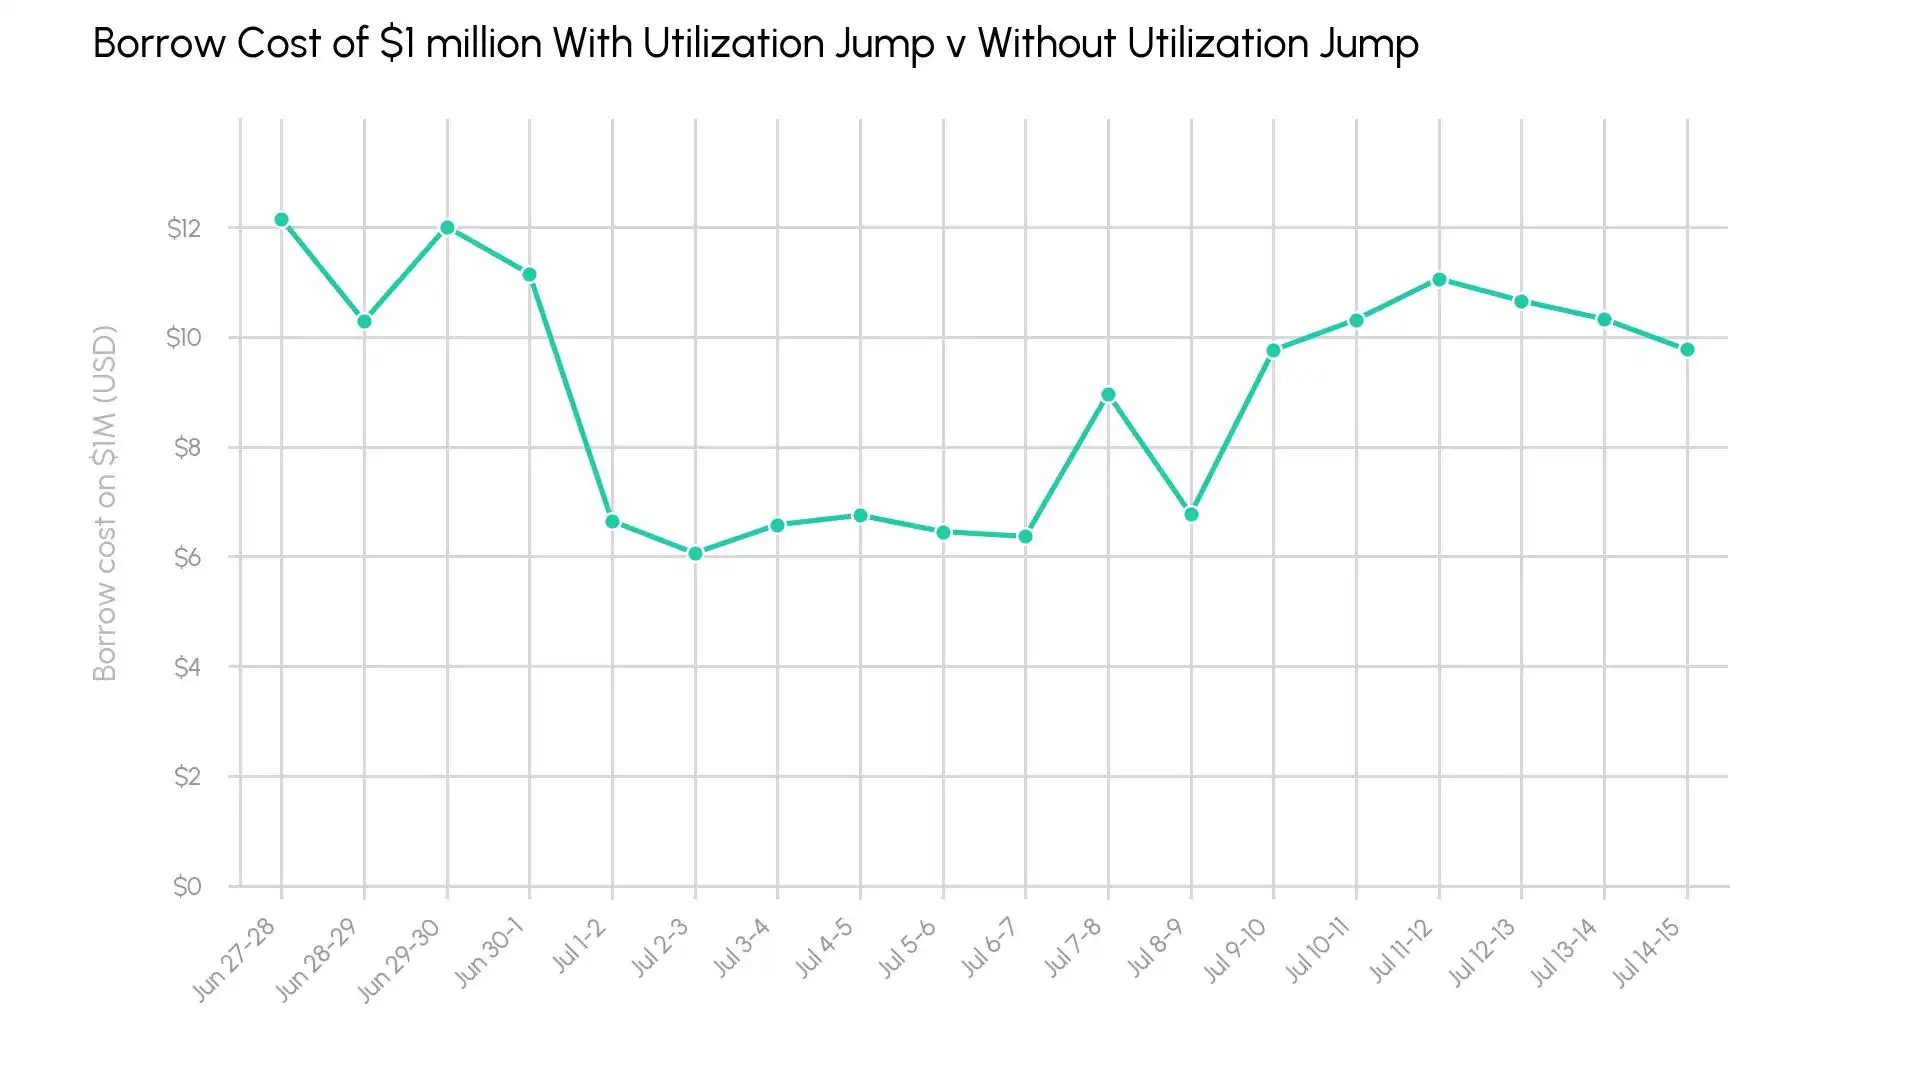
Figure: Minute-by-minute borrowing rate changes for a $1 million borrowing position during liquidity withdrawal, costing an extra ~$9 per night over 18 days. Source: Coin Metrics / Talos

Over 18 days, when liquidity was withdrawn, a borrower with a $1 million position paid an average of $9 more per day compared to a simulated scenario where liquidity was not temporarily altered. This would amount to a loss of about $3,280 annually. For the total $1.89 billion borrowed in the USDC pool, this costs all borrowers an extra $17,000 per night, or $6 million per year. Borrowers are paying more for activities unrelated to their own loans.

Why Does This Matter?

We believe these consistent utilization spikes most closely align with an explanation of a fund proving its holdings. Establishing regulations and improving workflows around DeFi investments could help reduce these negative impacts on lending pools. The transparency of blockchain can aid in tracking fund flows within blockchain protocols without needing to send funds to a designated address to prove they exist and are under the control of approved parties.

Today, lenders and borrowers must monitor not only the health of their own positions but also those in the entire pool. Tracking funds and deciphering their intent can help assess new risks and predict liquidity and interest rate changes.


Kripto yang Sedang Tren

Pertanyaan Terkait

QWhat is the primary impact of the 'midnight liquidity draining' phenomenon described in the article?

AThe primary impact is that it costs all USDC borrowers on Aave an estimated $6 million extra in interest payments annually. This occurs because withdrawing $190 million in liquidity from the USDC pool temporarily spikes the utilization rate, triggering Aave's steep interest rate curve and increasing borrowing costs for everyone until the funds are redeposited.

QAccording to the article, what is the most likely explanation for the consistent nightly withdrawals and redeposits of funds on Aave?

AThe most likely explanation is that a fund or institutional investor is required to prove its asset holdings daily for compliance or reporting purposes. The process involves withdrawing funds from the DeFi pool (like Aave) to take a 'snapshot' proving ownership and control, before quickly returning the funds.

QHow does Aave's interest rate model respond when the utilization rate of a pool exceeds its target (e.g., 92% for USDC)?

AAave uses a dual interest rate model. When the utilization rate exceeds the target (like 92%), the borrowing interest rate curve becomes very steep. For the USDC pool, this means rates can jump sharply from around 4% at 92% utilization to as high as 14% at 100% utilization, designed to discourage further borrowing or incentivize more deposits.

QWhat specific wallet address was identified as being responsible for the nightly liquidity movements, and what pattern did its activity show over time?

AThe wallet address identified is 0x56957E411Ea83a0B4A0689C1fB0D1e5eA0d20149. Analysis showed that from June to July, the time window for its 'withdraw-and-redeposit' operation became more compact. The average interval between withdrawal and redeposit shortened from 259 blocks in June to 177 blocks in July, indicating a faster process.

QWhy does the article suggest that DeFi's transparency is a double-edged sword in this context?

ADeFi's transparency allows for the public tracking of these fund flows and the identification of the systemic issue, exposing how traditional financial compliance processes can impose a hidden cost (the 'invisible tax' of extra interest) on other protocol users. However, it also means lenders and borrowers must now monitor not just their own positions but also the health and activity of the entire pool to anticipate such risks.

Bacaan Terkait

Industri Blockchain Beralih ke Fase Adopsi Massal dan Efisiensi

Industri blockchain memasuki fase adopsi massal dan efisiensi infrastruktur, sesuai laporan Bitwise untuk kuartal kedua 2026. Terjadi perbedaan signifikan antara sentimen pasar dan metrik fundamental: aktivitas on-chain meningkat, tetapi pendapatan dari biaya turun karena ruang blok menjadi lebih murah dan luas. Ethereum mencatat staking aktif rekor 40,2 juta ETH (33% pasokan), didorong oleh aliran institusional. Meski throughput transaksi meningkat, pendapatan jaringan turun 51% (menjadi $64 juta) akibat pembaruan yang membuat biaya blob hampir nol. Yield staker hanya 2,84%. Di Solana, volume transaksi tinggi (10 miliar), namun nilai ekonomi turun ke $51 juta karena berkurangnya kemacetan jaringan. Sektor aset tokenisasi dunia nyata (RWA) seperti saham meledak, dengan perdagangan saham token tumbuh 2479x, didorong oleh masuknya saham seperti SpaceX. Jaringan khusus seperti Hyperliquid justru sukses, menghasilkan pendapatan $175 juta dengan diversifikasi ke pasar komoditas dan indeks (32% volume). Avalanche mengalami pertumbuhan transaksi namun pendapatan fee anjlok, sementara fokus beralih ke jaringan Layer 1 berdaulat untuk korporasi seperti FIFA. Ekosistem NEAR mengalami transformasi dengan menurunnya penggunaan gas, digantikan oleh pertumbuhan "Intents". Fitur baru diluncurkan, memungkinkan pembayaran layanan AI melalui staking NEAR tanpa menggunakan kartu bank. Jaringan Tempo yang didukung Stripe menunjukkan adopsi korporat nyata, memproses $386 juta transfer stablecoin, termasuk untuk pembayaran kontraktor oleh Deel. Kesimpulannya, industri bergeser dari era biaya tinggi dan spekulasi ke fase adopsi massal, di mana ruang blok yang murah mendorong pertumbuhan transaksi dan menarik partisipasi institusional.

cryptonews.ru2m yang lalu

Industri Blockchain Beralih ke Fase Adopsi Massal dan Efisiensi

cryptonews.ru2m yang lalu

Analis Memprediksi Pergerakan Bitcoin pada Agustus

Analis keuangan Andrey Poroshin dari Bitbanker memperkirakan pergerakan Bitcoin pada Agustus 2024. Menurutnya, Bitcoin menyelesaikan bulan Juli di bawah tekanan karena kurangnya pendorong makroekonomi baru dan ketidakpastian regulasi. Rilis kebijakan Federal Reserve AS yang netral juga tidak memberikan sinyal kuat ke pasar. Poroshin menyebut level biaya penambangan di AS, sekitar $73-75 ribu, sebagai patokan penting, sedangkan harga saat ini berada di bawahnya. Ia menilai kebangkrutan bursa BitMEX pada Juli sebagai tanda "kapitalisasi tangan lemah", yang sering kali bertepatan dengan pembentukan zona pembalikan tren. Untuk Agustus, analis memperkirakan Bitcoin mungkin pertama-tama menguji kisaran $60-62 ribu untuk mengambil likuiditas yang menumpuk, sebelum kemudian pulih kembali ke level $70 ribu. Aktivitas perdagangan bulan Agustus biasanya lebih rendah karena musim liburan, sehingga pergerakan harga cenderung bersifat teknis tanpa impuls tajam. Pergerakan yang lebih signifikan diperkirakan baru terjadi pada September, menyusul sinyal baru dari Fed dan kemungkinan pembahasan kembali undang-undang CLARITY Act di AS. Di sisi lain, faktor geopolitik seperti ketegangan AS-Iran dianggap sudah tidak memberikan tekanan signifikan lagi, karena pasar telah beradaptasi. Sementara itu, di Rusia, wakil menteri keuangan Ivan Chebeskov mengumumkan bahwa investor non-terakreditasi akan segera dapat membeli Bitcoin, Ethereum, dan stablecoin populer secara legal dengan batas tahunan 300 ribu rubel melalui satu perantara.

cryptonews.ru2m yang lalu

Analis Memprediksi Pergerakan Bitcoin pada Agustus

cryptonews.ru2m yang lalu

Raksasa Penyimpanan Meraup Untung Besar, Pihak Bawah Tertekan

Industri penyimpanan global menunjukkan kinerja luar biasa pada laporan keuangan paruh pertama 2026. SK Hynix mencatat laba operasi melonjak 557%, sementara Samsung Electronics mencapai rekor laba. Di China, perusahaan seperti Jiangbolong dan佰维Storage juga mencatat pertumbuhan laba ratusan hingga ribuan persen. Namun, kinerja gemilang ini diikuti penurunan harga saham. Lonjakan laba produsen penyimpanan berarti biaya yang membengkak bagi pelanggan hilir. Pertanyaannya: siapa yang masih mampu membayar? Produsen penyimpanan menuai keuntungan dari ledakan AI, terutama melalui HBM untuk server AI. Sementara itu, perusahaan penyimpanan domestik China juga diuntungkan oleh kenaikan harga produk dan peningkatan pangsa pasar. Namun, beban biaya ini mulai tidak tertahankan bagi rantai pasokan hilir. Di sektor server AI, meskipun ada permintaan kuat, kenaikan harga mulai memeras anggaran belanja modal. Di pasar ponsel, chip penyimpanan kini bisa mencapai 20%-60% dari biaya bahan baku, menekan profitabilitas produsen. Sektor PC dan elektronik konsumen bahkan menunjukkan tanda-tanda permintaan yang runtuh. Pada Juli 2026, penolakan mulai muncul. Beberapa produsen ponsel top China dilaporkan menolak kenaikan harga yang diusulkan pemasok memori. Insiden ini menandai dimulainya perlawanan kolektif terhadap biaya penyimpanan yang melonjak. Ketika kenaikan harga mulai membunuh permintaan, siklus super industri penyimpanan mungkin akan berakhir dengan lebih cepat dari perkiraan.

marsbit21m yang lalu

Raksasa Penyimpanan Meraup Untung Besar, Pihak Bawah Tertekan

marsbit21m yang lalu

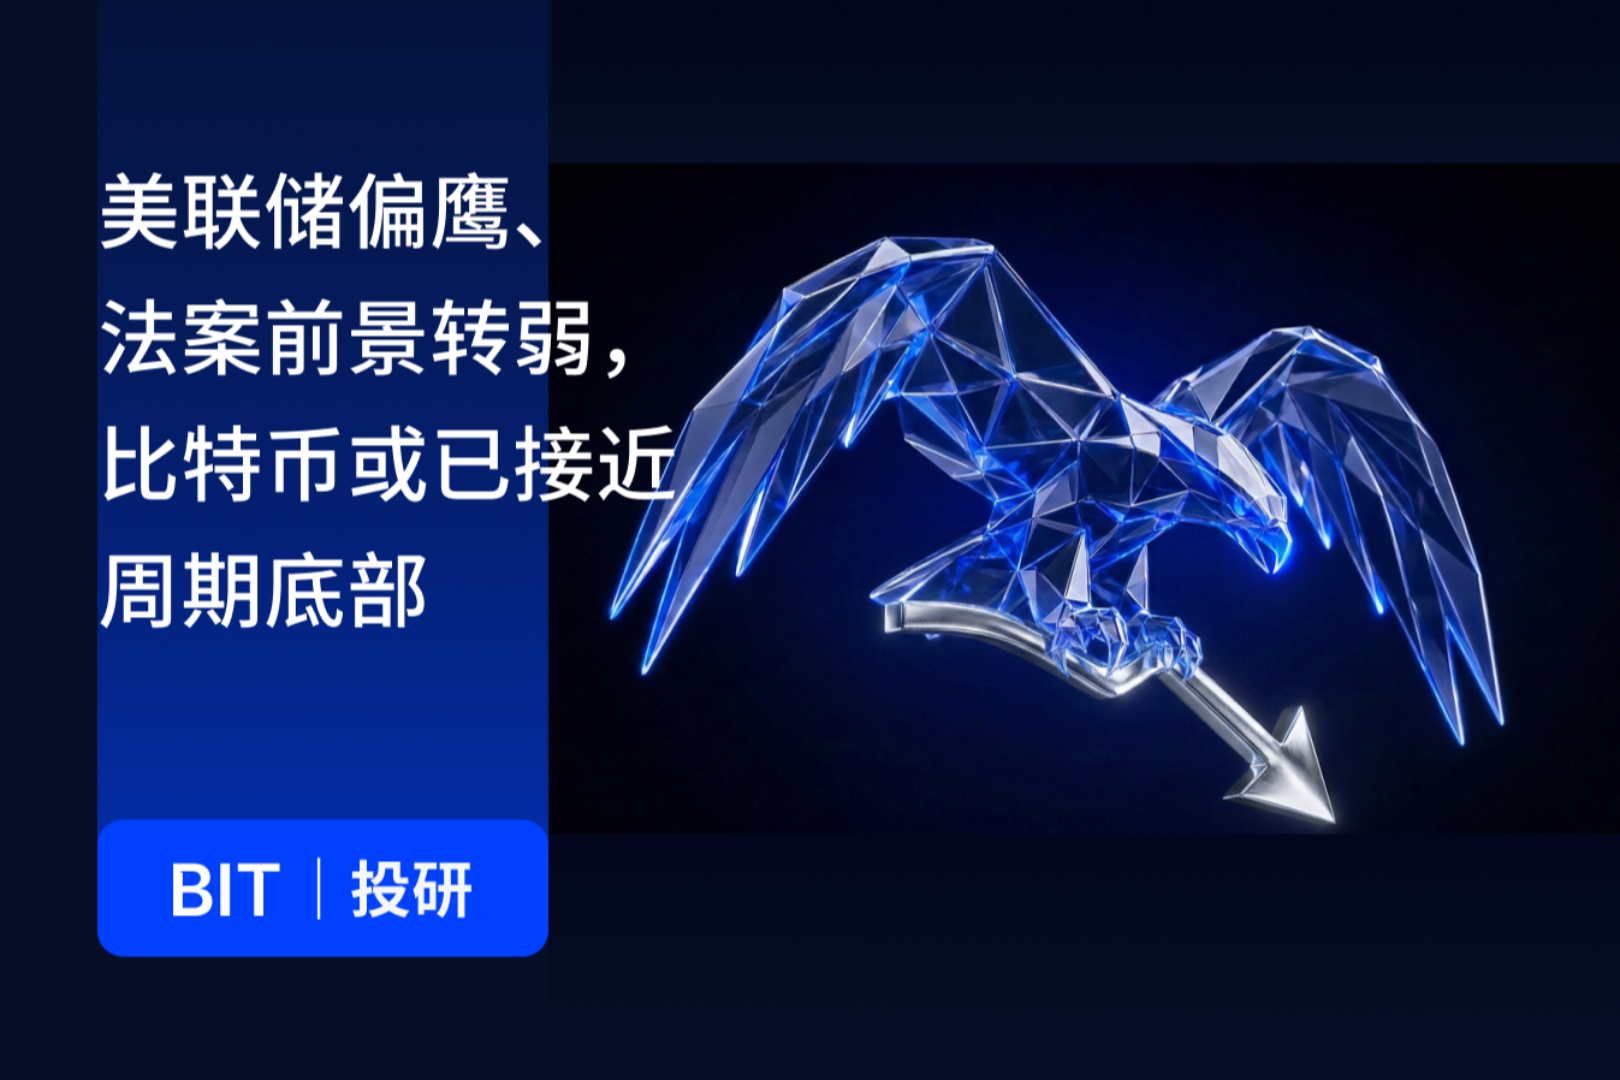
BIT Riset: Dua Faktor Negatif Terus Menekan Pasar, Mengapa Bitcoin Masih Mendekati Titik Terendah Siklus?

Pasar kripto saat ini sedang mengalami fase penyesuaian di bawah pengaruh kebijakan makro dan harapan regulasi. Ketua Fed Kevin Walsh mempertahankan sikap hawkish, mengoreksi ekspektasi pasar terhadap jalur suku bunga. Sementara itu, proses legislasi RUU CLARITY melambat, mengurangi harapan akan berita baik regulasi yang sebelumnya diantisipasi pasar. Meski dua faktor negatif ini terus berkembang, Bitcoin menunjukkan ketahanan kuat dengan bertahan di kisaran $62.000 - $66.000. Volume perdagangan pasar kripto telah turun 80% dari titik tertinggi dan menyusut sekitar 60% dari puncak kuartal keempat 2025, dengan kapitalisasi pasar turun sekitar 50%. Pasar secara keseluruhan masih kekurangan likuiditas dolar baru. Namun, di tengah volume rendah dan harapan regulasi yang mereda, Bitcoin tidak mengalami penurunan lebih dalam, mengalihkan fokus pasar dari berita jangka pendek ke pertanyaan apakah siklus saat ini telah mendekati titik terendah. Fed yang tetap hawkish dan mendinginnya harapan regulasi terus menekan sentimen pasar. Sejak nama Kevin Walsh diumumkan akhir Januari 2026, sikap kebijakan Fed lebih hawkish dari perkiraan sebelumnya. Sementara itu, probabilitas RUU CLARITY ditandatangani menjadi undang-undang sebelum akhir 2026 hanya 32% per 17 Juli, dengan jendela waktu untuk penyelesaiannya menyempit. Pasar masih kekurangan likuiditas baru. Pasokan stablecoin seperti USDT dan USDC belum pulih ke pertumbuhan berkelanjutan sejak November 2025, menunjukkan belum ada aliran masuk dolar baru ke aset digital. Namun, dibandingkan banyak altcoin, Bitcoin menunjukkan kinerja relatif yang lebih kuat. Model taktis terus mendukung Bitcoin sejak puncak pasar Oktober 2025. Dengan tekanan penjualan historis dan penguncian yang memengaruhi proyek lama, Bitcoin hanya terkoreksi sekitar 3% dalam seminggu terakhir di tengah tekanan bearish yang bertumpuk. Ketahanan ini menunjukkan bahwa investor yang perlu menyesuaikan portofolio mungkin telah melakukannya, sehingga semakin sulit bagi pasar untuk turun lebih dalam dari level saat ini. Secara keseluruhan, pasar masih dipengaruhi oleh kebijakan moneter hawkish, perlambatan regulasi, dan sikap wait-and-see investor. Namun, stabilitas relatif Bitcoin di lingkungan volume rendah dan tanpa likuiditas baru mencerminkan melemahnya tekanan penurunan siklus ini. Jika Bitcoin kemudian berhasil naik kembali di atas $70.000 dan mendorong beberapa indikator berubah menjadi bullish, hal itu akan semakin mengindikasikan bahwa titik terendah siklus ini telah terbentuk.

marsbit27m yang lalu

BIT Riset: Dua Faktor Negatif Terus Menekan Pasar, Mengapa Bitcoin Masih Mendekati Titik Terendah Siklus?

marsbit27m yang lalu

Trading

Spot

Artikel Populer

Cara Membeli PUMP

Selamat datang di HTX.com! Kami telah membuat pembelian Pump.fun (PUMP) menjadi mudah dan nyaman. Ikuti panduan langkah demi langkah kami untuk memulai perjalanan kripto Anda.Langkah 1: Buat Akun HTX AndaGunakan alamat email atau nomor ponsel Anda untuk mendaftar akun gratis di HTX. Rasakan perjalanan pendaftaran yang mudah dan buka semua fitur.Dapatkan Akun SayaLangkah 2: Buka Beli Kripto, lalu Pilih Metode Pembayaran AndaKartu Kredit/Debit: Gunakan Visa atau Mastercard Anda untuk membeli Pump.fun (PUMP) secara instan.Saldo: Gunakan dana dari saldo akun HTX Anda untuk melakukan trading dengan lancar.Pihak Ketiga: Kami telah menambahkan metode pembayaran populer seperti Google Pay dan Apple Pay untuk meningkatkan kenyamanan.P2P: Lakukan trading langsung dengan pengguna lain di HTX.Over-the-Counter (OTC): Kami menawarkan layanan yang dibuat khusus dan kurs yang kompetitif bagi para trader.Langkah 3: Simpan Pump.fun (PUMP) AndaSetelah melakukan pembelian, simpan Pump.fun (PUMP) di akun HTX Anda. Selain itu, Anda dapat mengirimkannya ke tempat lain melalui transfer blockchain atau menggunakannya untuk memperdagangkan mata uang kripto lainnya.Langkah 4: Lakukan trading Pump.fun (PUMP)Lakukan trading Pump.fun (PUMP) dengan mudah di pasar spot HTX. Cukup akses akun Anda, pilih pasangan perdagangan, jalankan trading, lalu pantau secara real-time. Kami menawarkan pengalaman yang ramah pengguna baik untuk pemula maupun trader berpengalaman.

518 Total TayanganDipublikasikan pada 2024.12.12Diperbarui pada 2026.07.09

Cara Membeli PUMP

Diskusi

Selamat datang di Komunitas HTX. Di sini, Anda bisa terus mendapatkan informasi terbaru tentang perkembangan platform terkini dan mendapatkan akses ke wawasan pasar profesional. Pendapat pengguna mengenai harga PUMP (PUMP) disajikan di bawah ini.

活动图片