Bitcoin Volatility Unchanged Amid Dominant Downtrend; HYPE Faces Repeated Tests at Critical Trendline | Guest Analysis

Odaily星球日报Dipublikasikan tanggal 2026-07-13Terakhir diperbarui pada 2026-07-13

Abstrak

This weekly market analysis updates the outlook for Bitcoin (BTC) and HYPE based on recent price action, largely confirming prior predictions. **Bitcoin (BTC) Analysis:** The report maintains that BTC is in a downtrend but currently within a corrective rebound phase that began from the July 1st low of $57,820. This rebound has reached a key resistance near $64,700. The daily chart shows a developing "descending central zone," suggesting a shift into a consolidation/range-bound phase. The 4-hour chart indicates the rebound may be completing, with proprietary models showing potential short-term topping signals near the current levels. **BTC Trading Strategy (July 13-19):** * **Key Levels:** Resistance is at $64,700, $65,700-$67,300, and $69,500-$71,000. Support lies at $60,950-$62,000, $57,820, and $55,000. * **Mid-term:** The overall structure is bearish. Hold ~20% short positions. Consider increasing shorts to 50% if price rallies to the $65,700-$67,300 zone and shows weakness. * **Short-term:** Use 30% capital for tactical trades. Three scenarios are outlined: 1. **A (Buying Dip):** Consider buying if price drops to $60,950-$62,000 support and shows signs of stabilization. 2. **B (Selling Rally):** Consider shorting if price rallies to the $65,700-$67,300 resistance zone with confirming signals. 3. **C (Buying Higher Low):** Consider buying if, after a breakout above $65,700, a pullback finds support above $57,820. **HYPE Analysis:** HYPE performed as...

In last week's report, based on Bitcoin's daily chart structure, we clearly stated the core judgment that "the oversold rebound phase has begun, and the rebound height will determine the subsequent market direction". We also issued a warning for HYPE, indicating a "significantly high probability of adjustment near the Endpoint 61 (72.97 USD)". This week's market trajectory further validated the effectiveness of our analytical framework: Bitcoin completed the multi-stage rebound as expected and touched a key resistance level, while HYPE met resistance and fell back around 72.97 USD as anticipated, with a maximum drop of 9.39%.

Building upon this, this week's report will provide a detailed breakdown of the potential price paths and specific trading strategies for BTC and HYPE, combining the latest 4-hour and daily chart structures with signals from our proprietary quantitative models.

Summary of This Week's Core Trading Views:

• BTC Multi-timeframe Structure Analysis (Details in Part 1)

• BTC Price Forecast and Mid/Short-term Trading Strategies This Week (Details in Part 2)

• HYPE Hourly Structure Analysis (Details in Part 3)

• HYPE Price Forecast and Short-term Trading Strategies This Week (Details in Part 4)

Market Validation of Last Week's Trading Strategies and Core Views:

• Validation of BTC Forecast: Last week's article clearly stated that Bitcoin had entered a daily-level oversold rebound phase, emphasizing that the height of this rebound would determine the market's subsequent direction. The current market trajectory is developing in line with our prediction.

• Validation of HYPE Forecast: Last week's article indicated a significant probability of HYPE undergoing adjustment near "Endpoint 61" (72.97 USD). Currently, market movements are highly consistent with our judgment.

Part 1: Bitcoin's Structure Analysis from Last Week

1. Bitcoin Daily Chart Structure Analysis: (Based on price action post-May 6th)

Bitcoin Daily Candlestick Chart
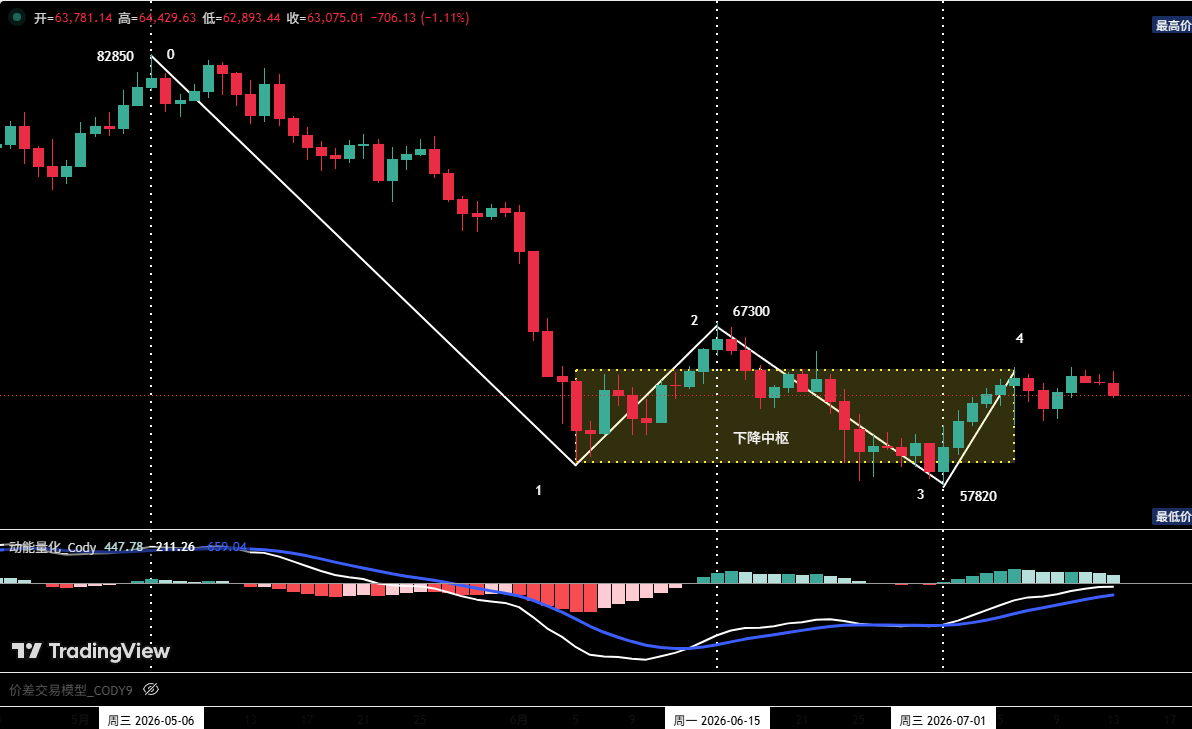
Figure 1

1. As shown in (Figure 1): The corrective move initiated from the May 6th high of $82,850 has presented a four-segment adjustment structure on the daily chart: segments (0-1), (1-2), (2-3), and (3-4).

2. Since touching the low of $57,820 on July 1st, the market is currently developing the rebound segment (3-4), and the price has already broken through the $64,500 resistance level. Last week's commentary explicitly stated: If this rebound first breaks the $64,500 resistance, and then (preferably) breaks the $65,700 resistance, the probability significantly increases for a subsequent stabilization and rebound above the low of $57,820 once the (3-4) rebound segment concludes and corrects.

3. On the daily timeframe, the price overlap across segments (1-2), (2-3), and (3-4) has preliminarily formed a "descending consolidation zone" (as shown in the chart). Based on the above analysis, the market is highly likely to enter a "zone extension" phase next, meaning this "zone" will be composed of five or even more overlapping segments. This signals a short-term market entry into a volatile, range-bound consolidation pattern.

2. In-depth Bitcoin Hourly Structure Analysis: (Using 4-hour as the analysis cycle)

Bitcoin_4-hour Candlestick Chart
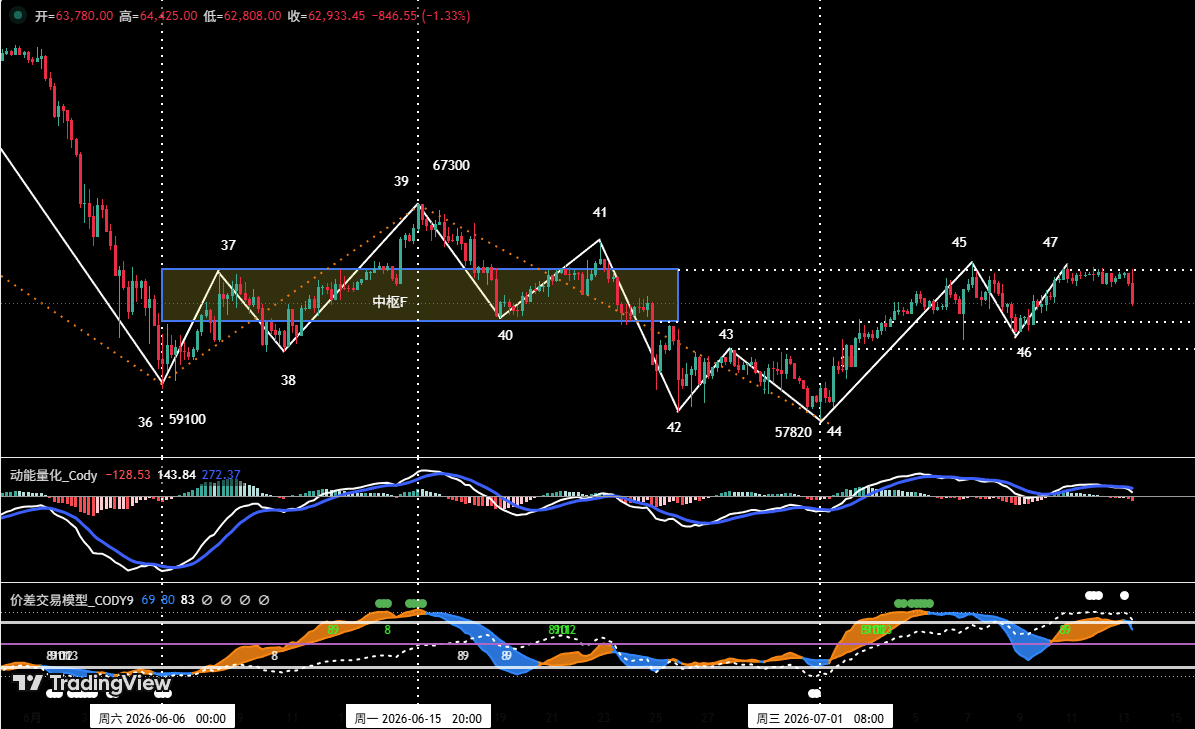
Figure 2

1. On the 4-hour chart, the rebound starting from the July 1st low of $57,820 clearly shows a three-segment structure: (44-45), (45-46), and (46-47).

2. Based on the current structure analysis, the price is in the midst of developing the (46-47) rebound segment. As the local high "Endpoint 47" was being formed, our proprietary "Momentum Quantitative Model" showed a clear bearish divergence signal, and the "Price Difference Trading Model" touched a top warning signal (white dot). Therefore, the probability of a technical correction at the hourly level here is extremely high. If the price corrects as expected, watch for support effectiveness near "Endpoint 46". If signs of stabilization appear around this level, a subsequent rebound will likely occur, with the primary upside target initially being $65,700; if rebound momentum is strong, the next important target is $67,300.

Part 2: Bitcoin Price Forecast and Trading Strategies for This Week (07.13~07.19)

1. BTC Price Forecast for This Week:

This Week's Core View: Focus closely on the price's performance around the key resistance level of $64,700. If a correction occurs as expected, closely observe the effectiveness of support when it falls back near $61,500. Stabilization signals at this level will determine whether the subsequent rebound can continue.

2. Core Resistance Levels:

• First Resistance Zone: $64,700 area (upper bound of previous consolidation zone)

• Second Resistance Zone: $65,700~$67,300 area (previous significant resistance area)

• Third Resistance Zone: $69,500~$71,000 area (previous significant resistance area)

3. Core Support Levels:

• First Support Zone: $60,950~$62,000 area (previous important support area)

• Second Support Level: Near $57,820 (previous important support level)

• Third Support Level: Near $55,000 (previous important support level)

4. Trading Strategies for This Week (Excluding the Impact of Sudden News):

1. Mid-term Strategy: Bitcoin_Daily Candlestick Chart: (Position Monitoring Model)
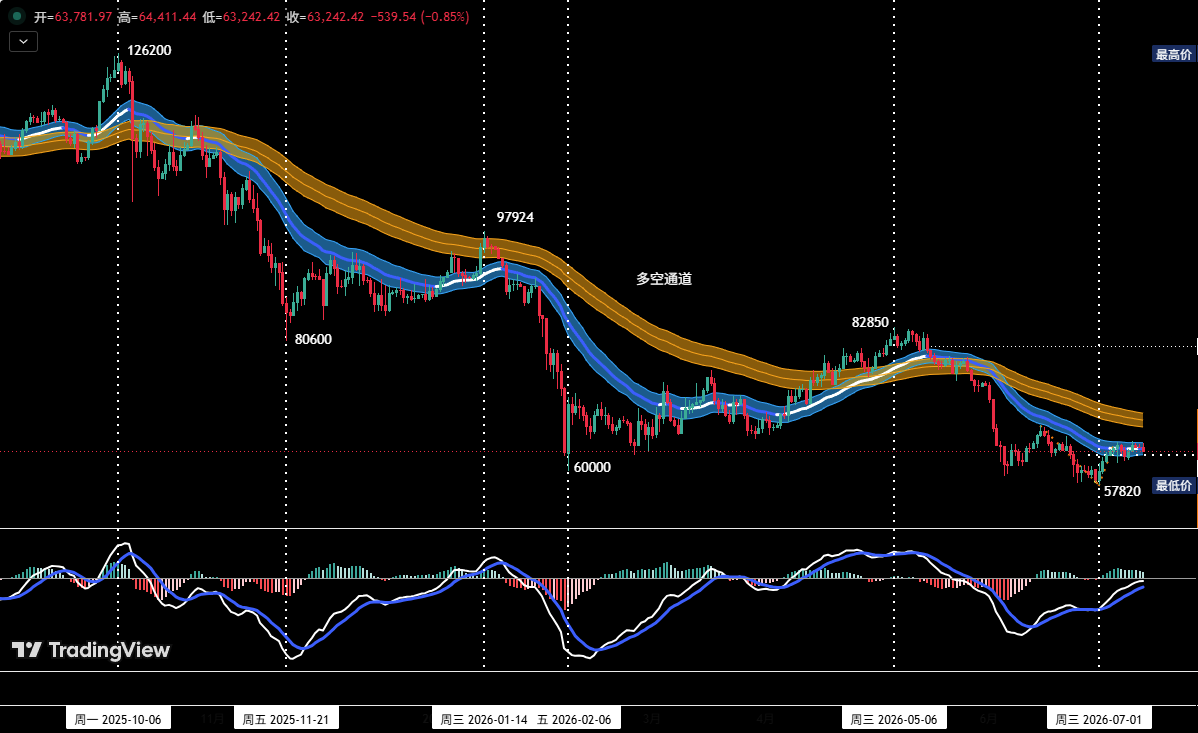
Figure 3

Position Monitoring Model: As shown in (Figure 3), the current price has effectively broken below the "Bull-Bear Channel", confirming a shift to a bear-dominated market structure.

• Current mid-term short positions should be maintained at around 20% for now.

• If the price rebounds to the $65,700~$67,300 area and shows signs of stagnation, combined with top signals from our proprietary quantitative models, consider increasing mid-term short positions to within 50%.

2. Short-term Strategy: Use 30% of capital, set stop-loss points, and look for "price difference" opportunities based on support and resistance levels. (Use 30-minute/60-minute charts as the operation cycle).

3. For short-term operations, to dynamically respond to the market's complex evolution, we have pre-determined three specific contingency plans: A/B/C.

• Plan A: Tentatively go long if support in the $60,950~$62,000 area holds. • Entry: If the price corrects from near $64,700 and, upon falling to the $60,950~$62,000 area, shows signs of stabilization combined with bottom signals from quantitative models, aggressive investors can establish a long position of about 15%. • Risk Control: Set an initial stop-loss. • Exit: Gradually close the position for profit when the price reaches important resistance levels combined with model signals.

• Plan B: Tentatively go short near strong resistance zones. • Entry: If the price rebounds and meets resistance in the $65,700~$67,300 area, combined with top signals from quantitative models, establish a short position of about 30%. • Risk Control: Set an initial stop-loss. • Exit: Gradually close the position for profit when the price adjusts to important support levels combined with model signals.

• Plan C: Lightly test long near strong support zones. • Entry: After the price breaks above $65,700 and then corrects, if signs of stabilization appear above the previous low of $57,820, combined with bottom signals from quantitative models, establish a long position of about 30%. • Risk Control: Set an initial stop-loss. • Exit: Gradually close the position for profit when the price rebounds to important resistance levels combined with model signals.

Part 3: HYPE Hourly Structure Analysis

HYPE_4-hour Candlestick Chart
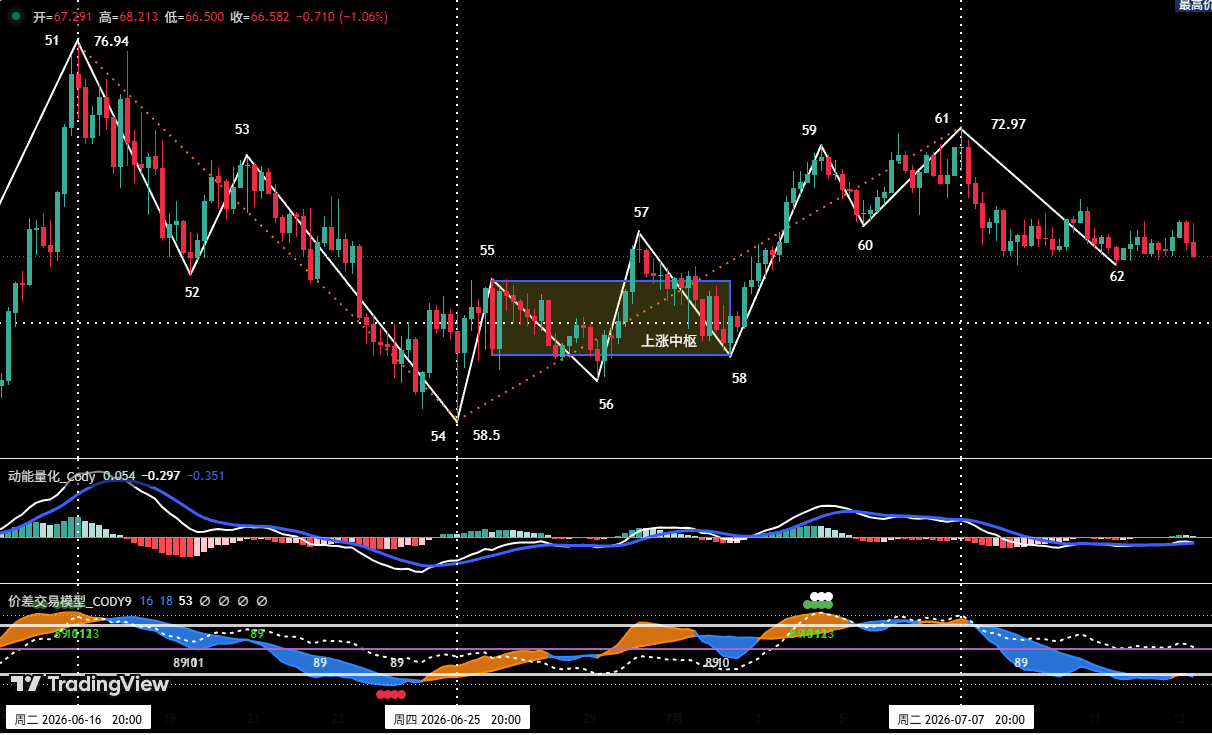
Figure 4

1. As shown in (Figure 4), from the June 25th low of $58.5 (Endpoint 54) to the July 7th high of $72.97 (Endpoint 61), HYPE's move on the 4-hour cycle can be subdivided into a seven-segment upward structure. Among them, segments 55-56, 56-57, and 57-58 overlap to form an "ascending consolidation zone".

2. Last week's commentary pointed out: Since a complete seven-segment upward structure has run from "Endpoint 54 to Endpoint 61", and top warning signals were triggered at "Endpoint 59" and "Endpoint 61" respectively, be alert to short-term adjustment risks. Last week, the market met resistance and began adjusting around $72.97 as expected. During the development of the (61-62) correction segment, the maximum decline was approximately 9.39%.

3. Based on the 4-hour chart analysis, the price is currently developing the (61-62) correction segment. The current "Endpoint 62" has already broken below the previous low "Endpoint 60" ($68.16), which preliminarily damages the structure that has been rising since "Endpoint 54".

Part 4: HYPE Price Forecast and Short-term Trading Strategies This Week

1. HYPE Price Forecast for This Week:

1. Core Resistance Levels:

• First Resistance Level: $68~$69.5 area

• Second Resistance Level: Near $72.97

• Third Resistance Level: Near $76.94

2. Core Support Levels:

• First Support Level: Near $65.5

• Second Support Zone: $60.5~$61.5 area

This Week's Core View on HYPE: Focus on where the current correction "Endpoint 62" concludes, and whether the subsequent rebound height can break through the $72.97 resistance.

2. HYPE Short-term Trading Strategies for This Week: This Week's Short-term Operations: Strategy One: If, after the (61-62) correction segment ends, the price rebounds and breaks the $72.97 resistance—since it would be approaching the strong resistance area of the historical high at $76.94—it is recommended to remain观望 (unallocated/cash).

Strategy Two: Conversely, if after the (61-62) correction segment ends, the price rebound fails to reach $72.97, it is recommended to establish short positions on rallies. Operationally, strict stop-losses must be set, with position size controlled within 30%.

Part 5: Special Reminders:

  1. Upon Entry: Immediately set an initial stop-loss.
  2. When Profit Reaches 1%: Move the stop-loss to the entry cost (breakeven point) to ensure capital safety.
  3. When Profit Reaches 2%: Move the stop-loss to the 1% profit level.
  4. Continuous Tracking: Thereafter, for every additional 1% profit, move the stop-loss up by 1%, dynamically protecting and locking in profits.

Financial markets change rapidly, and all market analysis and trading strategies require dynamic adjustment. All views, analytical models, and operational strategies involved in this article are derived from personal technical analysis, intended solely for personal trading log purposes, and do not constitute any investment advice or operational basis. The market carries risks, investing requires caution. Please do not make decisions based on this content.


Kripto yang Sedang Tren

Pertanyaan Terkait

QAccording to the article, what is the key price level (in USD) where Bitcoin's rebound met resistance and triggered a technical adjustment?

AThe key resistance level where Bitcoin's rebound met resistance was around 64,700 USD. At this point, the self-built 'momentum quantitative model' showed a clear top divergence signal and the 'price difference trading model' triggered a top warning signal, indicating a high probability of a technical adjustment.

QWhat are the three core operational plans (A, B, C) for Bitcoin's short-term trading strategy outlined in the article?

AThe three short-term Bitcoin trading plans are: Plan A: Test buying (go long) if price finds support in the 60,950-62,000 USD zone. Plan B: Test selling (go short) if price encounters resistance in the 65,700-67,300 USD zone. Plan C: Lightly test buying (go long) if price retreats but finds support above the previous low of 57,820 USD after breaking above 65,700 USD.

QFor HYPE, what was the specific price point (referred to as 'endpoint 61') where it encountered resistance and began a correction last week?

AFor HYPE, the specific price point where it encountered resistance and began a correction was at 72.97 USD, which is referred to as 'endpoint 61' in the analysis.

QWhat is the article's overall medium-term (mid-line) stance on Bitcoin's market structure based on the 'Position Monitoring Model'?

AThe article's medium-term stance on Bitcoin, based on the 'Position Monitoring Model', is bearish. The model shows that the price has effectively broken below the 'Bull-Bear Channel', confirming a market structure shift to one dominated by a downtrend. It recommends maintaining a medium-term short position of around 20%.

QWhat is the critical condition for considering to establish a short position in HYPE according to the weekly strategy?

AThe critical condition for considering a short position in HYPE is if, after the (61-62) correction segment ends, the price rebounds but fails to reach the 72.97 USD resistance level. In this scenario, the strategy suggests establishing a short position on rallies, with strict stop-loss and position control within 30%.

Bacaan Terkait

human.tech Meluncurkan Clean SDK untuk Aplikasi Web3 yang Mengutamakan Privasi

human.tech meluncurkan Clean SDK, toolkit yang memungkinkan pengembang membuat aplikasi Web3 yang mengutamakan privasi dan akuntabilitas transparan. SDK ini menyediakan komponen untuk verifikasi identitas tanpa pengetahuan (zero-knowledge), pemeriksaan sanksi, dan transaksi privat tanpa harus menangani data pengguna sensitif atau membangun infrastruktur kepatuhan dari nol. Clean SDK mengatasi tantangan klasik Web3: memungkinkan privasi tanpa mengorbankan akuntabilitas. Dengan menggabungkan zero-knowledge proof dan verifikasi terprogram, aplikasi dapat membuktikan legitimasi pengguna dan dana telah lolos pemeriksaan sanksi, sambil menjaga kerahasiaan identitas pribadi. Shield, aplikasi pertama yang dibangun di atas Clean SDK, diluncurkan bersamaan. Aplikasi ini berfungsi sebagai jembatan privat ke Aztec, memungkinkan pengguna mentransfer aset sambil membuktikan bahwa transfer dilakukan oleh manusia unik dan dana telah diperiksa terhadap sumber sanksi, tanpa mengungkap identitas. SDK ini menawarkan tiga teknik verifikasi inti: Proof of Innocence (pemeriksaan sanksi), Proof of Personhood (verifikasi manusia), dan Proof of Clean Hands (verifikasi identitas pemerintah zero-knowledge). Fitur-fitur ini memungkinkan autentikasi pengguna dan transaksi tanpa membocorkan informasi pribadi. Didesain untuk pengembang di Aztec, Clean SDK memungkinkan integrasi privasi terprogram langsung ke dalam aplikasi terdesentralisasi. Peluncurannya mencerminkan permintaan yang tumbuh akan infrastruktur yang menyeimbangkan privasi dan akuntabilitas secara transparan, tanpa bergantung pada basis data identitas konvensional.

TheNewsCrypto26m yang lalu

human.tech Meluncurkan Clean SDK untuk Aplikasi Web3 yang Mengutamakan Privasi

TheNewsCrypto26m yang lalu

Melepaskan Likuiditas $100 Juta? Kebijakan Baru Pump.fun Menguji Teknik '5-Menit Pump'

Pump.fun, platform peluncuran token meme di Solana, resmi memperkenalkan mode BOOST pada 21 Juli sebagai mekanisme standar baru. Inti dari mode ini adalah mengubah 20% likuiditas yang sebelumnya terkunci secara permanen di pool likuiditas (LP) setelah migrasi token, menjadi pembeli aktif. Dana yang sebelumnya "terjebak" sebagai "likuiditas mati" itu sekarang akan digunakan untuk membeli token tersebut selama 5 menit pertama setelah migrasi ke PumpSwap, menggunakan metode TWAP (Time-Weighted Average Price). Semua token yang dibeli kemudian akan langsung dimusnahkan (burn). Mekanisme ini bertujuan menciptakan tekanan beli jangka pendek sekaligus mengurangi pasokan token yang beredar secara permanen. Pump.fun memperkirakan, kebijakan lama yang mengunci likuiditas menyebabkan pemborosan lebih dari $100 juta per tahun. BOOST berupaya memanfaatkan dana tersebut untuk meningkatkan momentum perdagangan sesaat setelah peluncuran, dengan harapan meningkatkan retensi trader dan volume perdagangan berkelanjutan bagi token-token yang diluncurkan. Namun, beberapa kekhawatiran muncul. Beberapa pihak menilai hal ini bisa mempermudah token berkualitas rendah terlihat sukses di menit-menit awal, dan justru mendorong perilaku peluncuran yang lebih spekulatif. Kekhawatiran lain adalah risiko kejatuhan harga yang lebih tajam setelah periode 5 menit berakhir, jika diikuti dengan penjualan besar-besaran.

marsbit33m yang lalu

Melepaskan Likuiditas $100 Juta? Kebijakan Baru Pump.fun Menguji Teknik '5-Menit Pump'

marsbit33m yang lalu

Menjual Ruang Blok Sudah Mati: Blockchain Publik Harus Menemukan Cara Hidup Baru

Penulis Castle Labs, dikompilasi oleh TechFlow, membahas perlunya perubahan model bisnis blockchain publik. Dalam dua tahun terakhir, 14 perusahaan crypto menghasilkan pendapatan lebih dari $200 juta, namun hanya satu yang merupakan blockchain publik: Hyperliquid. Sebagai perbandingan, Arbitrum hanya menghasilkan $430.000 dalam 30 hari terakhir, sementara Hyperliquid menghasilkan sekitar $58 juta. Hal ini menunjukkan bahwa model bisnis tradisional menjual ruang blok tidak lagi cukup. Blockchain publik perlu beralih menjadi studio produk, distributor aplikasi, jalur pembayaran, atau tumpukan SaaS vertikal untuk menghasilkan pendapatan berkelanjutan dan menghindari risiko kehabisan dana. Artikel ini juga membahas serangan terhadap Ostium, di mana lebih dari 40% TVL hilang karena input harga palsu, menekankan pentingnya kontrol keamanan yang ketat untuk protokol yang membawa pasar off-chain ke on-chain. Selain itu, diskusi tentang opsi keuangan menyoroti bahwa untuk adopsi yang lebih luas, manfaat opsi harus disajikan dalam produk yang lebih mudah dipahami seperti vault hasil, opsi biner jangka pendek, produk terstruktur, atau pasar prediksi, bukan sebagai instrumen kompleks dengan istilah teknis. Protokol baru yang menarik perhatian termasuk Flex (pasar uang suku bunga tetap dari Yearn), Base App yang kini dikelola oleh Cobie, Plether (DEX kontrak berkelanjutan untuk indeks dolar AS), dan fokus Starknet pada peningkatan privasi dan ketahanan kuantum untuk pertumbuhan kelembagaan di on-chain.

marsbit53m yang lalu

Menjual Ruang Blok Sudah Mati: Blockchain Publik Harus Menemukan Cara Hidup Baru

marsbit53m yang lalu

Catatan Podcast | Bicara dengan Kepala Unit Manajemen Aset GSR: Benar atau Palsu Rally Kripto Ini, Cek Suku Bunga Pinjaman di Aave Saja

**Rangkuman Podcast: Apakah Rally Kripto Ini Nyata? Pantau Suku Bunga Pinjaman di Aave!** Andy Baehr, Direktur GSR Asset Management, membagikan kerangka untuk menilai kondisi pasar kripto saat ini yang berada dalam fase "ambivalen" (ragu-ragu), bukan "conviction" (keyakinan naik berkelanjutan). Rally baru-baru ini, dipicu data CPI yang lebih rendah, diibaratkan seperti roket pendorong tunggal yang habis setelah tahap pertama. Tiga sinyal kunci untuk dipantau: 1. **Suku Bunga Pinjaman DeFi (terutama di Aave):** Saat ini, suku bunga USDC di Aave sekitar 3.75%, hampir sama dengan imbal hasil Treasury AS. Tidak adanya "credit spread" yang tinggi menunjukkan sangat sedikit keinginan untuk meminjam guna membuka leverage—tanda jelas energi pasar yang rendah. Baehr berpendapat bahwa kenaikan berkelanjutan baru akan terjadi jika suku bunga DeFi ini melonjak tajam, menandakan ledakan permintaan leverage. 2. **"Puncak Kebijakan Hawkish" The Fed:** Pasar masih belum mengetahui sejauh apa Chairman Fed baru, Kevin Warsh, akan menaikkan suku bunga. Ketidakpastian mengenai puncak sikap ketat (hawkish peak) ini menghambat keyakinan jangka panjang. Pasar membutuhkan momen "klarifikasi" di mana ada konsensus bahwa kenaikan suku bunga akan segera berakhir. 3. **Nasib CLARITY Act:** Peluang disahkannya undang-undang regulasi kripto ini telah turun drastis, dari 75% (Mei) menjadi di bawah 40%. Jika secara tak terduga disetujui sebelum tenggat waktu 7 Agustus, hal itu bisa menjadi katalis positif yang kuat bagi harga karena unsur kejutan. Baehr juga mencatat bahwa dana aliran masuk ETF tidak stabil, dan perusahaan publik yang memegang aset kripto (DAT) seperti Strategy dan Metaplanet saat ini tidak aktif membeli. Energi trading juga teralihkan ke IPO besar di sektor teknologi seperti SpaceX dan AI. **Kesimpulan:** Untuk membedakan rally palsu dari yang nyata, pantau suku bunga pinjaman di Aave. Selama suku bunga itu tetap rendah mendekati suku bunga bebas risiko, pasar kekurangan energi dan leverage yang dibutuhkan untuk rally berkelanjutan. Perubahan nyata baru akan terlihat ketika ada kejelasan dari The Fed, kejutan regulasi positif, dan lonjakan tajam dalam permintaan leverage di DeFi.

marsbit1j yang lalu

Catatan Podcast | Bicara dengan Kepala Unit Manajemen Aset GSR: Benar atau Palsu Rally Kripto Ini, Cek Suku Bunga Pinjaman di Aave Saja

marsbit1j yang lalu

Trading

Spot

Artikel Populer

Cara Membeli HYPE

Selamat datang di HTX.com! Kami telah membuat pembelian Hyperliquid (HYPE) menjadi mudah dan nyaman. Ikuti panduan langkah demi langkah kami untuk memulai perjalanan kripto Anda.Langkah 1: Buat Akun HTX AndaGunakan alamat email atau nomor ponsel Anda untuk mendaftar akun gratis di HTX. Rasakan perjalanan pendaftaran yang mudah dan buka semua fitur.Dapatkan Akun SayaLangkah 2: Buka Beli Kripto, lalu Pilih Metode Pembayaran AndaKartu Kredit/Debit: Gunakan Visa atau Mastercard Anda untuk membeli Hyperliquid (HYPE) secara instan.Saldo: Gunakan dana dari saldo akun HTX Anda untuk melakukan trading dengan lancar.Pihak Ketiga: Kami telah menambahkan metode pembayaran populer seperti Google Pay dan Apple Pay untuk meningkatkan kenyamanan.P2P: Lakukan trading langsung dengan pengguna lain di HTX.Over-the-Counter (OTC): Kami menawarkan layanan yang dibuat khusus dan kurs yang kompetitif bagi para trader.Langkah 3: Simpan Hyperliquid (HYPE) AndaSetelah melakukan pembelian, simpan Hyperliquid (HYPE) di akun HTX Anda. Selain itu, Anda dapat mengirimkannya ke tempat lain melalui transfer blockchain atau menggunakannya untuk memperdagangkan mata uang kripto lainnya.Langkah 4: Lakukan trading Hyperliquid (HYPE)Lakukan trading Hyperliquid (HYPE) dengan mudah di pasar spot HTX. Cukup akses akun Anda, pilih pasangan perdagangan, jalankan trading, lalu pantau secara real-time. Kami menawarkan pengalaman yang ramah pengguna baik untuk pemula maupun trader berpengalaman.

420 Total TayanganDipublikasikan pada 2024.12.11Diperbarui pada 2026.06.02

Cara Membeli HYPE

Diskusi

Selamat datang di Komunitas HTX. Di sini, Anda bisa terus mendapatkan informasi terbaru tentang perkembangan platform terkini dan mendapatkan akses ke wawasan pasar profesional. Pendapat pengguna mengenai harga HYPE (HYPE) disajikan di bawah ini.

活动图片