SUI Action: Weekly Pattern Suggests Price Is Coiling For A Bigger Move

bitcoinistDipublikasikan tanggal 2025-06-22Terakhir diperbarui pada 2025-06-22

Abstrak

The SUI/USDT weekly chart is attracting attention as the price action tightens within a defined range. After a period of...

Trusted Editorial content, reviewed by leading industry experts and seasoned editors. Ad Disclosure

The SUI/USDT weekly chart is attracting attention as the price action tightens within a defined range. After a period of decline and consolidation, the asset is stabilizing, with key support levels holding firm. The structure suggests that the asset may be gearing up for a potential shift in trend.

Price Action Coiling Up — Will SUI Snap Upward?

SUI has formed a symmetrical triangle squeeze, a pattern known for preceding explosive moves. Its price recently dipped below the lower trendline, raising alarms for a potential breakdown. However, Atres Crypto Academy noted on X that this may have been a bull trap, a temporary shakeout before a sharp reversal.

If SUI snaps back into the triangle with strong momentum, it would signal that the breakdown was a false move, and bulls may be regaining control. In that case, the stage would be for an upside breakout, with the target set at $3.50 or more.
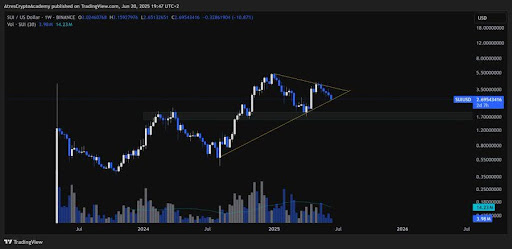
SUI
Source: Atres Crypto on X

SUI price action is forming a falling wedge pattern, a bullish reversal setup. After dropping 37% from its May highs, the altcoin is now testing a key support zone between $2.70 and $3.00, an area that has typically drawn buying interest. WEBBZ.SUI highlighted that a confirmed breakout could propel the token toward the $4.50 to $5.00 region, and if support fails to hold, the next critical level will be the $2.00 zone.

According to Gemxbt, the 1-hour chart is showing a consolidation phase around the $2.85 level, with the price stabilizing above the 5, 10, and 20-hour moving averages, signaling strength and support in this zone.

The Relative Strength Index (RSI) is also trending upward, steadily moving away from oversold territory. This suggests that bullish momentum is building. Furthermore, the Moving Average Convergence Divergence (MACD) is approaching a bullish crossover, indicating possible upward price movement if confirmed by increased volume.

Signs Of Strength Emerging 

SUI has quietly surged from under $0.60 to over $4.00 in less than a year, making an impressive nearly 7x gain despite pullbacks. The price-performance underscores the growing interest and momentum behind the token.

Emilio Crypto Bojan mentioned that the fundamentals are starting to catch up with the price action. DeFi aggregator volume has now surpassed $45 billion, with a 19% increase over the past 30 days, and bullish vibes are building ahead.

SUI is showing signs of strength after holding the critical support zone at $2.70, suggesting that a potential bounce is building. Presently, the market structure shows that conditions are favorable for a reversal, provided the bulls step in decisively. Cult Babe also revealed that the price action appears to be preparing for an upward move, with the key focus of reclaiming the $2.90 resistance level.

SUI
SUI trading at $2.7 on the 1D chart | Source: SUIUSDT on Tradingview.com
Featured image from Shutterstock, chart from Tradingview.com
Editorial Process for bitcoinist is centered on delivering thoroughly researched, accurate, and unbiased content. We uphold strict sourcing standards, and each page undergoes diligent review by our team of top technology experts and seasoned editors. This process ensures the integrity, relevance, and value of our content for our readers.

Godspower Owie is my name, and I work for the news platforms NewsBTC and Bitcoinist. I sometimes like to think of myself as an explorer since I enjoy exploring new places, learning new things, especially valuable ones, and meeting new people who have an impact on my life, no matter how small. I value my family, friends, career, and time. Really, those are most likely the most significant aspects of every person's existence. Not illusions, but dreams are what I pursue.

Kripto yang Sedang Tren

Bacaan Terkait

Kesuksesan Robinhood Chain Membuktikan Ethereum Tidak Mati

Robinhood Chain adalah contoh sempurna dari bagaimana perusahaan tradisional memilih model L1+L2 Ethereum saat beralih ke bisnis berbasis blockchain. Alih-alih membangun infrastruktur dari nol atau mengadopsi model rantai mandiri yang mahal, Robinhood menggunakan Ethereum sebagai L1 untuk penyelesaian, keamanan, dan likuiditas, sambil membangun L2 khususnya sendiri dengan teknologi Arbitrum. Ini memungkinkan kendali, kinerja tinggi, dan kepatuhan terhadap regulasi, tanpa biaya dan risiko untuk memelihara ekosistem keamanan dan token gas-nya sendiri. Perbedaan ini mencerminkan pergeseran mendasar dalam industri crypto. Era sebelumnya didorong oleh model "tokenomics" di mana proyek memilih infrastruktur untuk memaksimalkan nilai token. Namun, era baru ini didominasi oleh bisnis nyata (real-world) yang menggunakan teknologi blockchain sebagai infrastruktur untuk mengoptimalkan produk dan arus kas mereka. Targetnya bukan lagi penjualan token, tetapi melayani kebutuhan konsumen nyata. Perusahaan seperti ini memerlukan keseimbangan: L1 Ethereum menawarkan desentralisasi maksimal, netralitas, dan likuiditas global. Sementara itu, L2 (seperti Base milik Coinbase atau Robinhood Chain) menyediakan lingkungan eksekusi yang dapat dikustomisasi, biaya rendah, dan dikendalikan oleh operator. Model "barbel" Ethereum ini—pusat yang kuat (L1) dan tepi yang sangat terdiversifikasi (L2)—menjadi pilihan bisnis yang rasional bagi perusahaan yang fokus pada produk dan pelanggan. Pergeseran ini menguntungkan Ethereum dan ETH. Adopsi oleh bisnis nyata akan mengintegrasikan ETH lebih dalam ke dalam ekonomi dunia, mendistribusikannya ke lebih banyak pengguna, dan memperkuat statusnya sebagai aset likuid dan penyimpan nilai yang andal. Keputusan Robinhood bukanlah eksklusif, melainkan mercusuar untuk masa depan di mana perusahaan dunia nyata membangun di atas Ethereum melalui keputusan komersial pragmatis, bukan ideologi.

Odaily星球日报41m yang lalu

Kesuksesan Robinhood Chain Membuktikan Ethereum Tidak Mati

Odaily星球日报41m yang lalu

Trading

Spot

Artikel Populer

Cara Membeli MOVE

Selamat datang di HTX.com! Kami telah membuat pembelian Movement (MOVE) menjadi mudah dan nyaman. Ikuti panduan langkah demi langkah kami untuk memulai perjalanan kripto Anda.Langkah 1: Buat Akun HTX AndaGunakan alamat email atau nomor ponsel Anda untuk mendaftar akun gratis di HTX. Rasakan perjalanan pendaftaran yang mudah dan buka semua fitur.Dapatkan Akun SayaLangkah 2: Buka Beli Kripto, lalu Pilih Metode Pembayaran AndaKartu Kredit/Debit: Gunakan Visa atau Mastercard Anda untuk membeli Movement (MOVE) secara instan.Saldo: Gunakan dana dari saldo akun HTX Anda untuk melakukan trading dengan lancar.Pihak Ketiga: Kami telah menambahkan metode pembayaran populer seperti Google Pay dan Apple Pay untuk meningkatkan kenyamanan.P2P: Lakukan trading langsung dengan pengguna lain di HTX.Over-the-Counter (OTC): Kami menawarkan layanan yang dibuat khusus dan kurs yang kompetitif bagi para trader.Langkah 3: Simpan Movement (MOVE) AndaSetelah melakukan pembelian, simpan Movement (MOVE) di akun HTX Anda. Selain itu, Anda dapat mengirimkannya ke tempat lain melalui transfer blockchain atau menggunakannya untuk memperdagangkan mata uang kripto lainnya.Langkah 4: Lakukan trading Movement (MOVE)Lakukan trading Movement (MOVE) dengan mudah di pasar spot HTX. Cukup akses akun Anda, pilih pasangan perdagangan, jalankan trading, lalu pantau secara real-time. Kami menawarkan pengalaman yang ramah pengguna baik untuk pemula maupun trader berpengalaman.

455 Total TayanganDipublikasikan pada 2024.12.13Diperbarui pada 2026.06.02

Cara Membeli MOVE

Diskusi

Selamat datang di Komunitas HTX. Di sini, Anda bisa terus mendapatkan informasi terbaru tentang perkembangan platform terkini dan mendapatkan akses ke wawasan pasar profesional. Pendapat pengguna mengenai harga MOVE (MOVE) disajikan di bawah ini.

活动图片