Polkadot Bears Might Drag Its Price Down Despite Bullish Signals

newsbtcPublié le 2022-12-09Dernière mise à jour le 2022-12-09

Résumé

The Polkadot price has attempted to break past its immediate resistance several times during the first week of December. Despite that, the bulls could not build on their strength. This...

The Polkadot price has attempted to break past its immediate resistance several times during the first week of December. Despite that, the bulls could not build on their strength. This suggests that the coin’s buying power remained low at higher price levels for the altcoin.
The technical outlook for the coin depicted a fall in demand. Accumulation has remained quite low for Polkadot throughout the month of November and the first few weeks of December. DOT increased 2% over the last 24 hours, but that doesn’t reflect bullishness on the one-day chart.
The Polkadot price has to trade above the $5.71 mark to target $6. The $5.71 price resistance has been a strong barrier for the coin. Broader market strength and a push from buyers can only help the altcoin move north. Polkadot market capitalization also declined, indicating that bearish strength still prevailed.
Polkadot Price Analysis: One-Day Chart

Polkadot Price

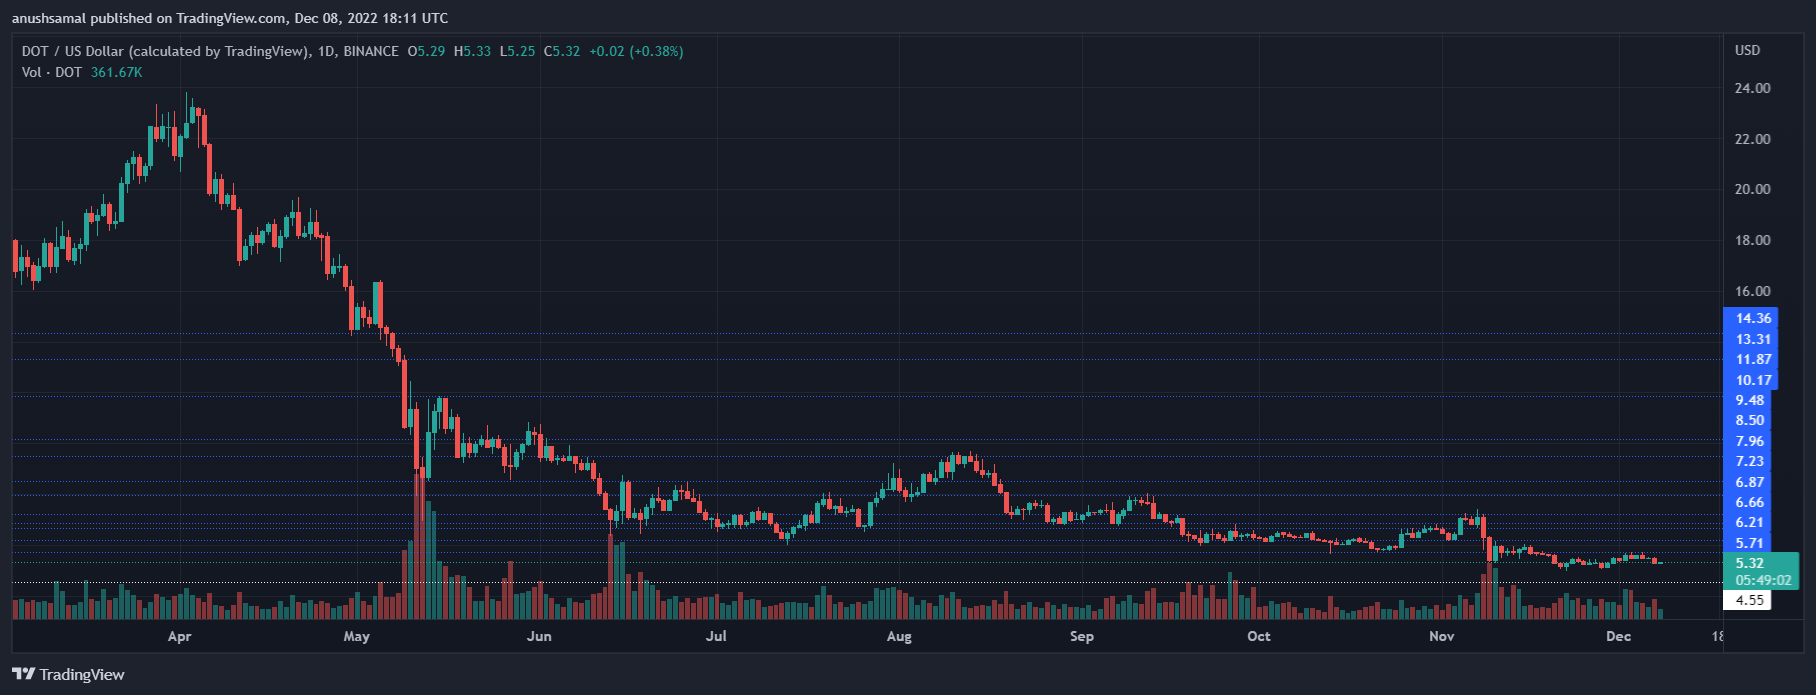
Polkadot was priced at $5.30 on the one-day chart | Source: DOTUSD on TradingView DOT was trading at $5.30 at press time. Although the coin crossed the $5 mark, the bears could drag the price to $4.30. Immediate resistance for Polkadot was at $5.71, breaching which DOT could have a shot at $6.
On the other hand, the first line of support stood at $4.50, falling through which the coin will rest at $4 if DOT does not lose momentum, which appears unlikely given the low demand for the altcoin. A bounce off the $5 mark could help Polkadot move above the $5.70 mark.
Toppling the $5.70 level will give DOT a chance to rally to $6.21. The amount of Polkadot traded in the last session remained low, which meant bearishness on the chart.
Technical Analysis

Polkadot Price

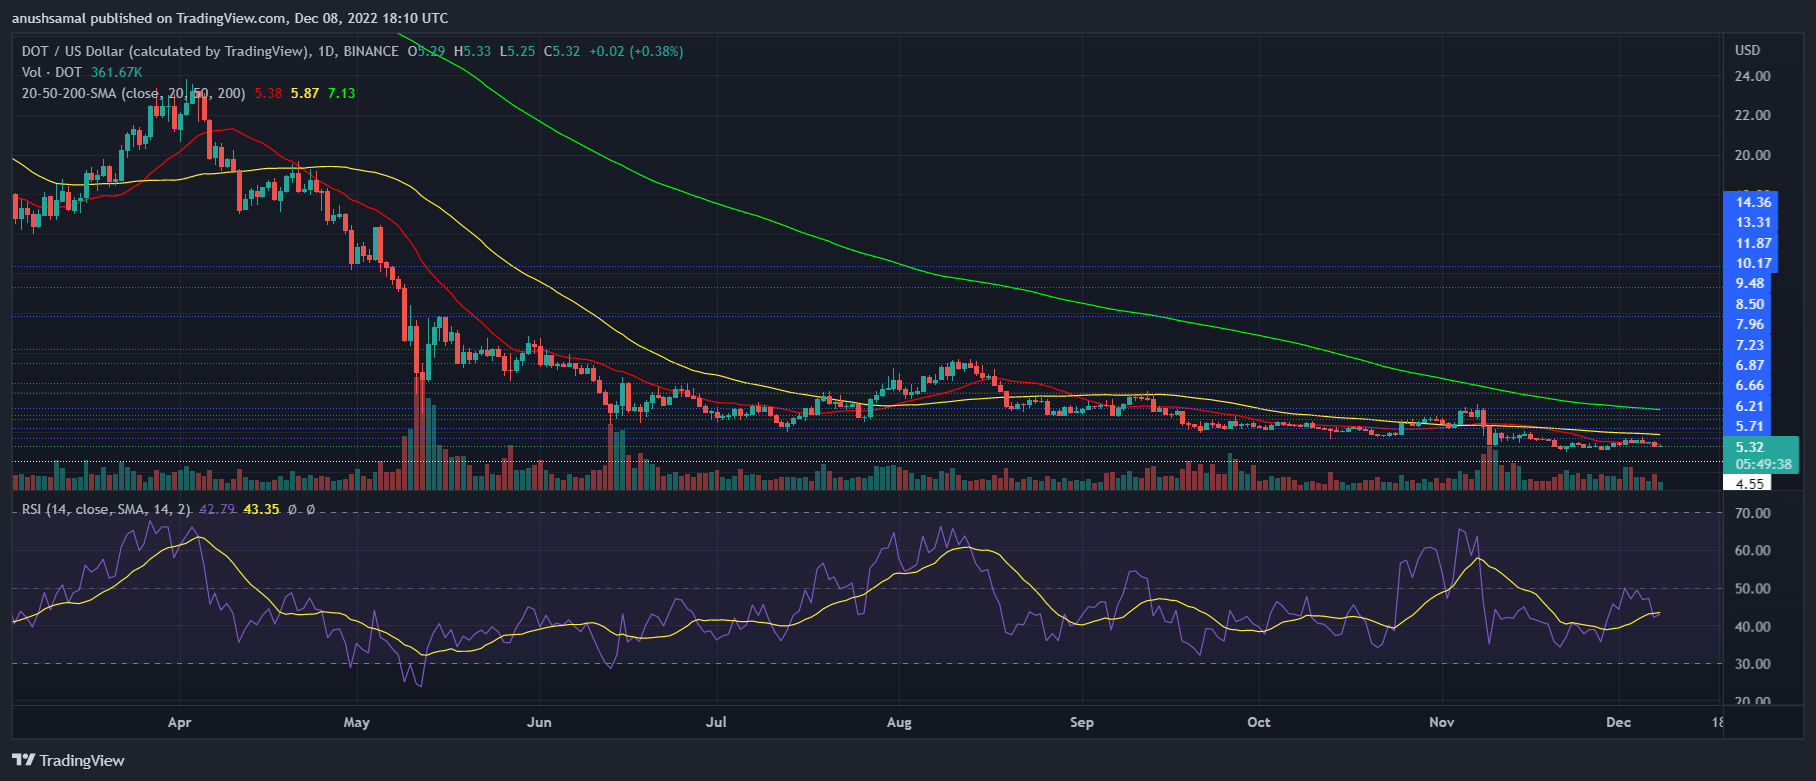
Polkadot registered a fall in buying strength on the one-day chart | Source: DOTUSD on TradingView DOT depicts that buyers have lost interest in the altcoin. The Relative Strength Index (RSI) fell closer to the 40-mark, meaning that buying strength was much lower than selling strength on the chart.
The Polkadot price had tried to move above the 20-Simple Moving Average (SMA) line several times in the past few weeks. Despite that, the bulls lost steam. At the moment, the Polkadot price was below the 20-SMA line, which indicated low demand and that sellers were driving the price momentum in the market.

Polkadot Price

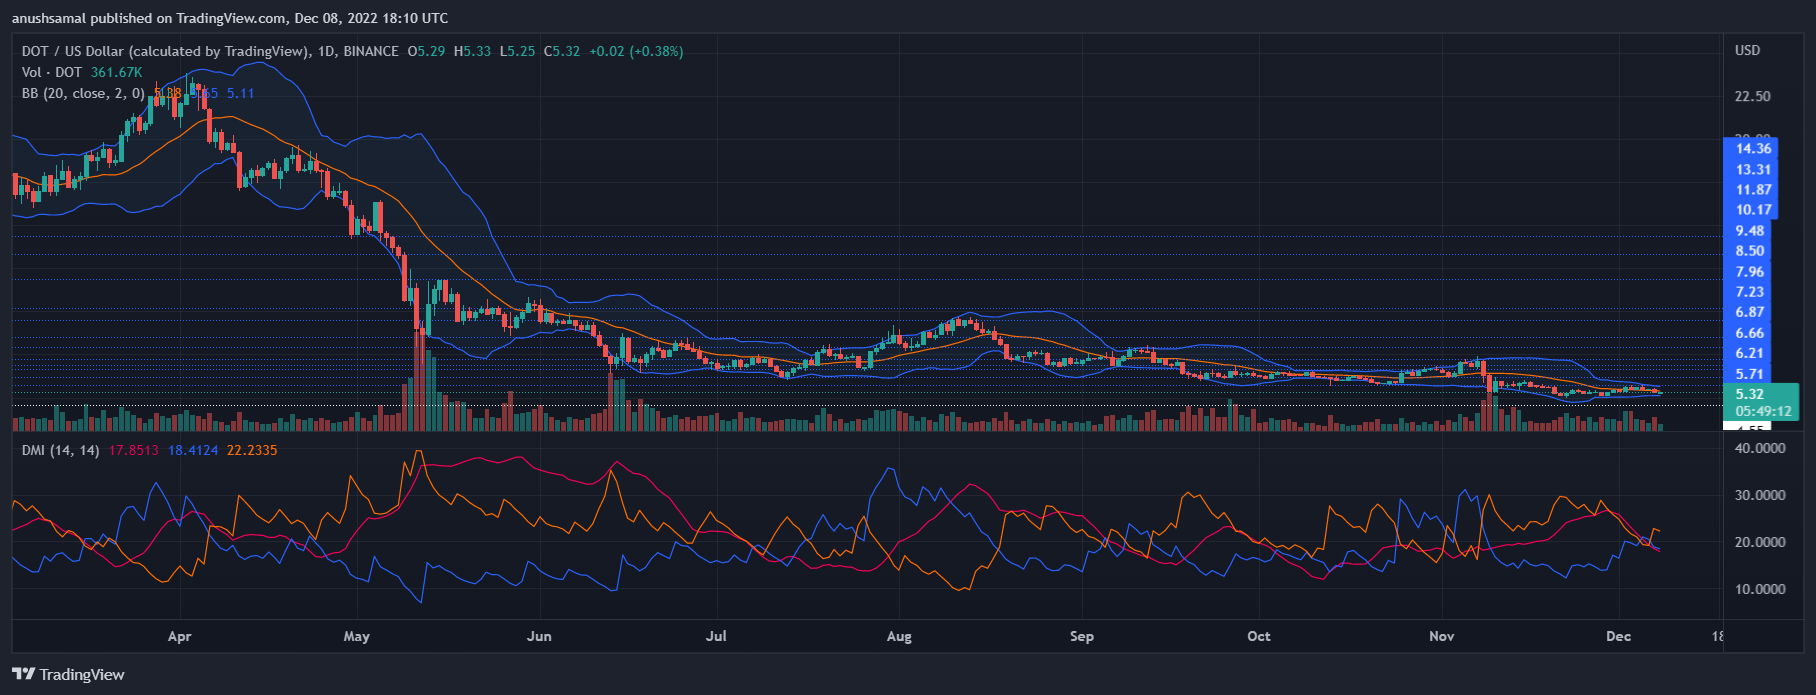
Polkadot noted low volatility on the one-day chart | Source: DOTUSD on TradingView The other technicals also pointed towards negative price action. The Directional Movement Index was negative, as the -DI (orange) line was above the +DI (blue) line. The Average Directional Index (red) indicates the strength of the price momentum; it was above the 20 mark but noted a downtick.
This downtick denoted a loss in the strength of the price momentum. Bollinger bands depict price volatility and fluctuation. The bands were constricted, indicating range-bound movement and low volatility for the altcoin.

Lectures associées

Décomposition de la Stratégie de Trading Bitcoin : Prédictions de Célébrités et Modèles Classiques Tous Défaillants, Seuls Ces Quatre Indicateurs Restent

L'auteur, non-traiteur professionnel, a analysé toutes les méthodes de prédiction du prix du Bitcoin (BTC) de 2017 à 2025 et a constaté que les prédictions de célébrités et les modèles classiques (comme Stock-to-Flow) sont devenus inefficaces. Seuls quatre indicateurs se sont révélés fiables pour décrire l'état du marché plutôt que de prédire l'avenir. Les indicateurs retenus sont : 1. **MVRV Z-Score** : Identifie les creux de cycle (zones vertes) avec une grande précision historique, bien que son utilité pour les sommets ait diminué depuis 2024. 2. **SOPR (28-day MA)** : Indique que les détenteurs vendent à perte (valeur < 1.0), un signal stable pour les creux du marché. 3. **Flux nets des ETF Bitcoin** : Un nouvel indicateur crucial depuis 2024 pour suivre le comportement des institutions. 4. **Liquidité macroéconomique** : La politique de la Fed et la croissance de M2 pour déterminer la direction générale du marché. La stratégie consiste à attendre une **résonance** d'au moins trois de ces signaux avant d'agir, évitant ainsi les faux signaux. Un système automatisé surveille ces données et envoie une alerte uniquement lorsque les conditions sont remplies. **Signal actuel (15 avril 2026)** : Une triple résonance des indicateurs on-chain (Peur extrême, MVRV en zone verte, SOPR < 1.0) signale une opportunité d'achat historique, similaire aux creux de 2018, 2020 et 2022. Seul le flux des ETF n'est pas encore favorable. L'essentiel est de se baser sur un cadre objectif plutôt que sur des prédictions. Ceci n'est pas un conseil financier.

marsbitIl y a 2 h

Décomposition de la Stratégie de Trading Bitcoin : Prédictions de Célébrités et Modèles Classiques Tous Défaillants, Seuls Ces Quatre Indicateurs Restent

marsbitIl y a 2 h

Trading

Spot
Futures

Articles tendance

Comment acheter DOT

Bienvenue sur HTX.com ! Nous vous permettons d'acheter Polkadot (DOT) de manière simple et pratique. Suivez notre guide étape par étape pour commencer votre parcours crypto.Étape 1 : Création de votre compte HTXUtilisez votre adresse e-mail ou votre numéro de téléphone pour ouvrir un compte sur HTX gratuitement. L'inscription se fait en toute simplicité et débloque toutes les fonctionnalités.Créer mon compteÉtape 2 : Choix du mode de paiement (rubrique Acheter des cryptosCarte de crédit/débit : utilisez votre carte Visa ou Mastercard pour acheter instantanément Polkadot (DOT).Solde :utilisez les fonds du solde de votre compte HTX pour trader en toute simplicité.Prestataire tiers :pour accroître la commodité d'utilisation, nous avons ajouté des modes de paiement populaires tels que Google Pay et Apple Pay.P2P :tradez directement avec d'autres utilisateurs sur HTX.OTC (de gré à gré) : nous offrons des services personnalisés et des taux de change compétitifs aux traders.Étape 3 : stockage de vos Polkadot (DOT)Après avoir acheté vos Polkadot (DOT), stockez-les sur votre compte HTX. Vous pouvez également les envoyer ailleurs via un transfert sur la blockchain ou les utiliser pour trader d'autres cryptos.Étape 4 : tradez des Polkadot (DOT)Tradez facilement Polkadot (DOT) sur le marché Spot de HTX. Il vous suffit d'accéder à votre compte, de sélectionner la paire de trading, d'exécuter vos trades et de les suivre en temps réel. Nous offrons une expérience conviviale aux débutants comme aux traders chevronnés.

361 vues totalesPublié le 2024.12.12Mis à jour le 2025.03.21

Comment acheter DOT

Discussions

Bienvenue dans la Communauté HTX. Ici, vous pouvez vous tenir informé(e) des derniers développements de la plateforme et accéder à des analyses de marché professionnelles. Les opinions des utilisateurs sur le prix de DOT (DOT) sont présentées ci-dessous.

活动图片