Bitcoin bulls attempted to break above the $31,000 resistance again last night. The upbeat sentiment could be boosted by the US inflation report , which showed signs of slowing inflation. Economists had expected the annual Consumer Price Index to rise 3.1%, but the June figure was 3%.
The 0.2% increase month-on-month was also lower than expected. This suggests that the Federal Reserve's rate hikes have had the desired effect. That could limit future Fed rate hikes.
Supported by macroeconomic conditions, institutional investors appear to be turning positive towards cryptocurrencies, especially Bitcoin (BTC). A CoinShares report published on July 10 shows an inflow of $ 136 million in digital investment products over the past week. That brings the total inflows for three straight weeks to $470 million, indicating a positive outlook.
Large investors may be actively accumulating Bitcoin as they anticipate a massive influx of traditional financial money if the U.S. Securities and Exchange Commission approves a spot Bitcoin ETF. Bloomberg ETF analyst Eric Balchunas said in a recent interview that the approval of the ETF will unlock $30 trillion worth of Capital for Bitcoin.
Can these positive factors trigger a massive bull run for Bitcoin and major altcoins? Let's study the chart of the top 10 cryptocurrencies to find out.
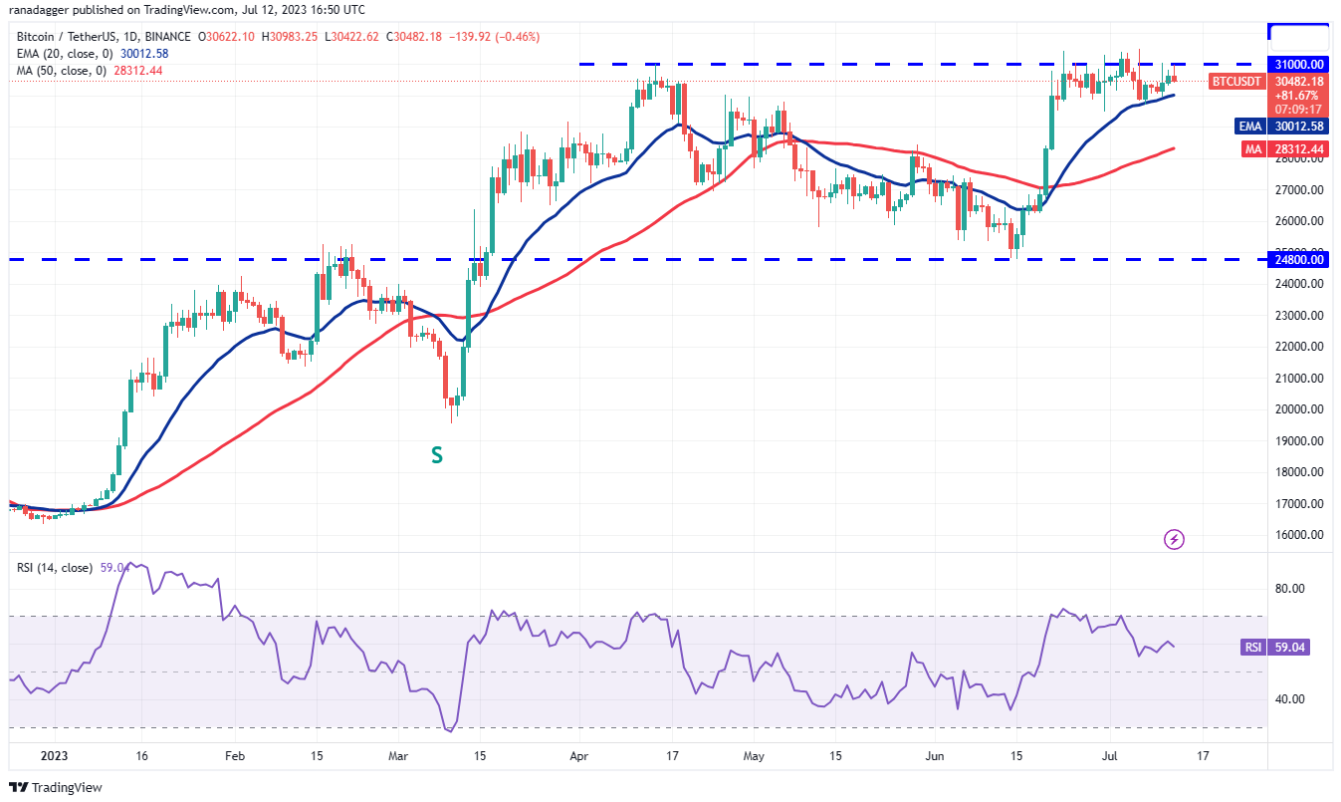
Bitcoin was rejected by the $31,000 resistance on July 10, but a positive sign is that the bulls have not allowed the price to drop below the 20-day exponential moving Medium (EMA) at $30.012.
BTC/USDT Daily Chart | Source: TradingView
The upward sloping 20-day EMA and the relative strength index (RSI) are in the positive territory suggesting the path of least resistance is to the upside. If buyers push and sustain the price above $31,000, the BTC/USDT pair could start the next leg of the uptrend.
The pair can rally to $32,400, where the bears are expected to again establish a strong defensive barrier. If the bulls fail to allow the price to drop below the 20-day EMA, the pair is likely to skyrocket to $40,000.
Time is running out for the bears. If they want to return, they will have to quickly drag the price below $29,500. That could cause the price to drop to the 50-day simple moving Medium (SMA) at $28.312.
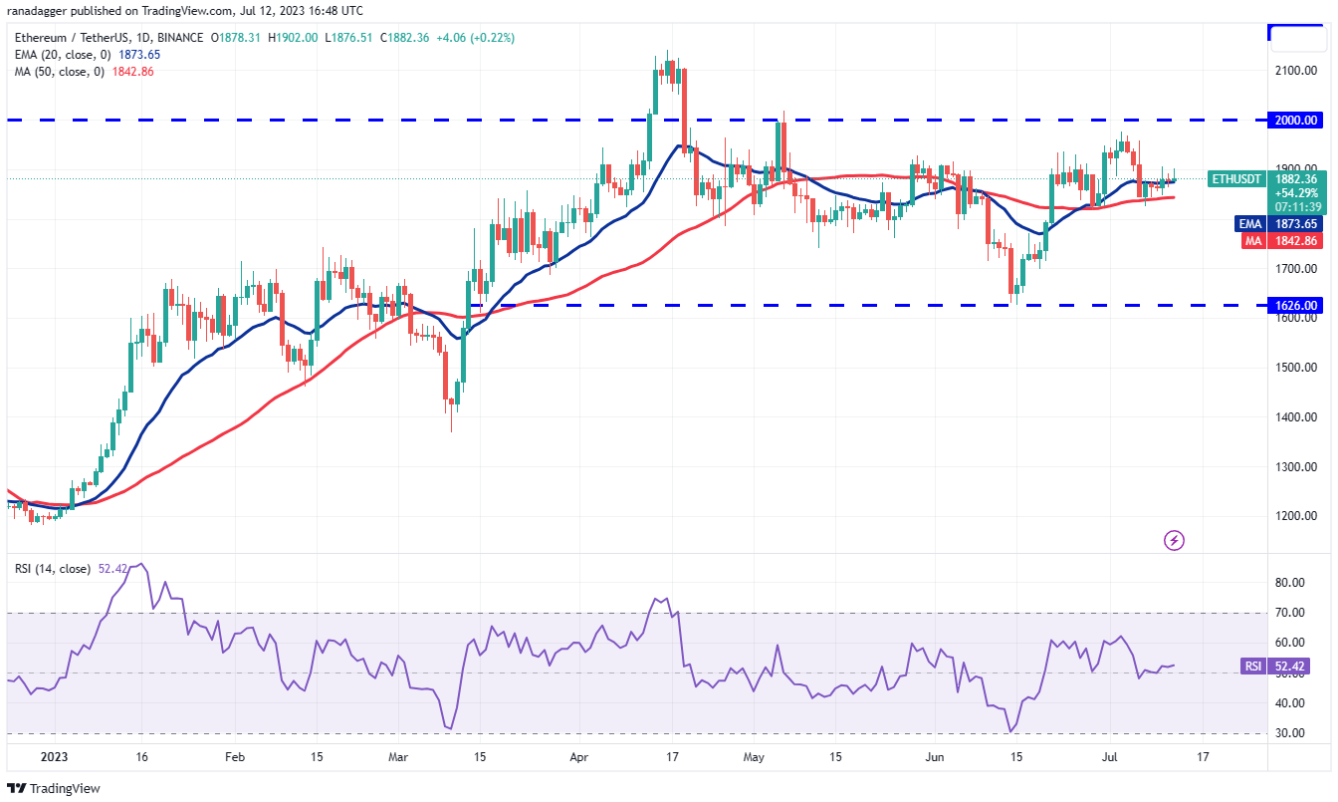
Ether (ETH) once again bounced off the 50-day SMA ($1.843) on July 10, showing that the bulls are fiercely defending this level.
ETH/USDT Daily Chart | Source: TradingView
The price turned up and closed above the 20-day EMA ($1,874), showing that the bulls are attempting a return. If buyers push the price above $1,906, the ETH/USDT pair might attempt to rally to the $2,000 resistance. This level could witness strong selling by the bears.
The key support to watch on the downside is the 50-day SMA. If this level gives way, it could pave the way for a deeper correction to $1,700.
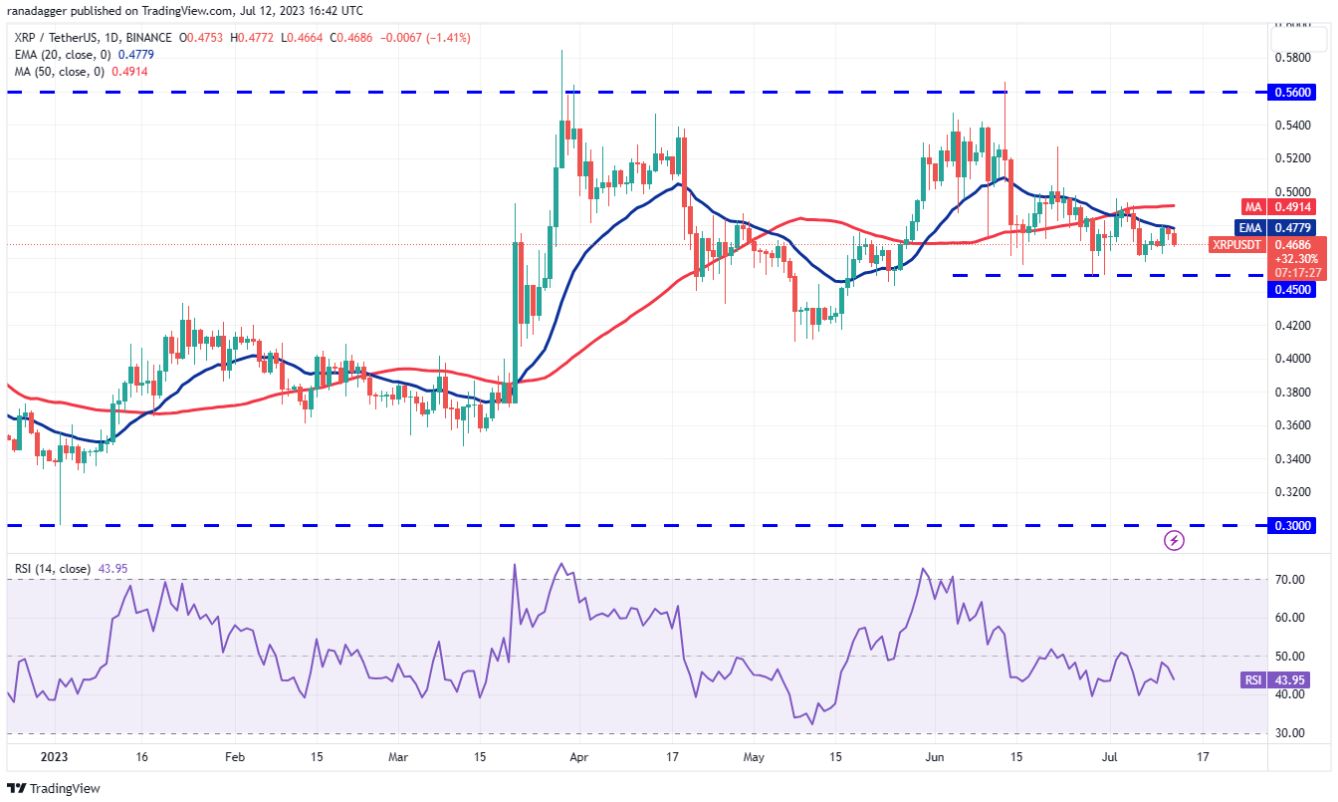
The bulls managed to push XRP (XRP) above the 20-day EMA ($0.48) on July 10, but the bears still hold their ground.
XRP/USDT Daily Chart | Source: TradingView
The bulls will have to overcome the hurdle at the 20-day EMA and then the 50-day SMA ($0.49) to gain the upper hand. If they do, the XRP/USDT pair can pick up momentum and rally to $0.53 and ultimately to $0.56.
Conversely, if the price turns down sharply from the current levels, it can retest the strong support at $0.45. This level has been protected on two previous occasions; hence, the bulls are expected to try to defend it once again. If the buyers fail in their attempt, the pair can drop to $0.41.
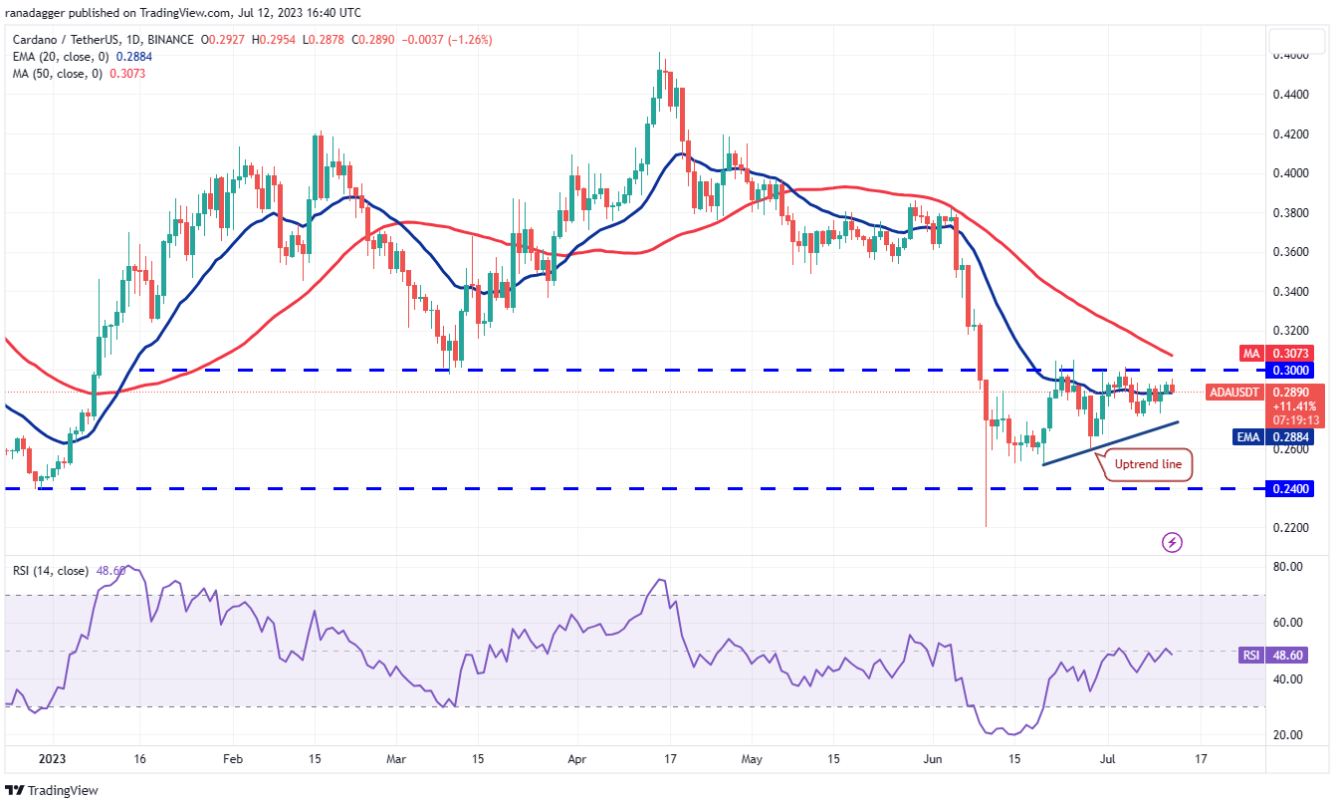
Cardano (ADA) turned up above the 20-day EMA ($0.29) on July 11, showing that the bulls are buying at lower levels.
Daily ADA/USDT Chart | Source: TradingView
The flat 20-day EMA and the RSI near the midpoint suggest a balance between supply and demand. This advantage will tilt in favor of the buyers if they push the price above the 50-day SMA ($0.31). After that, the ADA/USDT pair can start to rise to $0.38.
Also, if the price turns down from the overhead resistance, it shows that the bears have not given up yet. The pair can then fluctuate between the 50-day SMA and the uptrend line for a while. A slide below the uptrend line will favor the bears in the near term.
Gogecoin (DOGE) is struggling to break above the 20-day EMA ($0.07), but a positive sign is that the bulls have yet to give way to the bears.
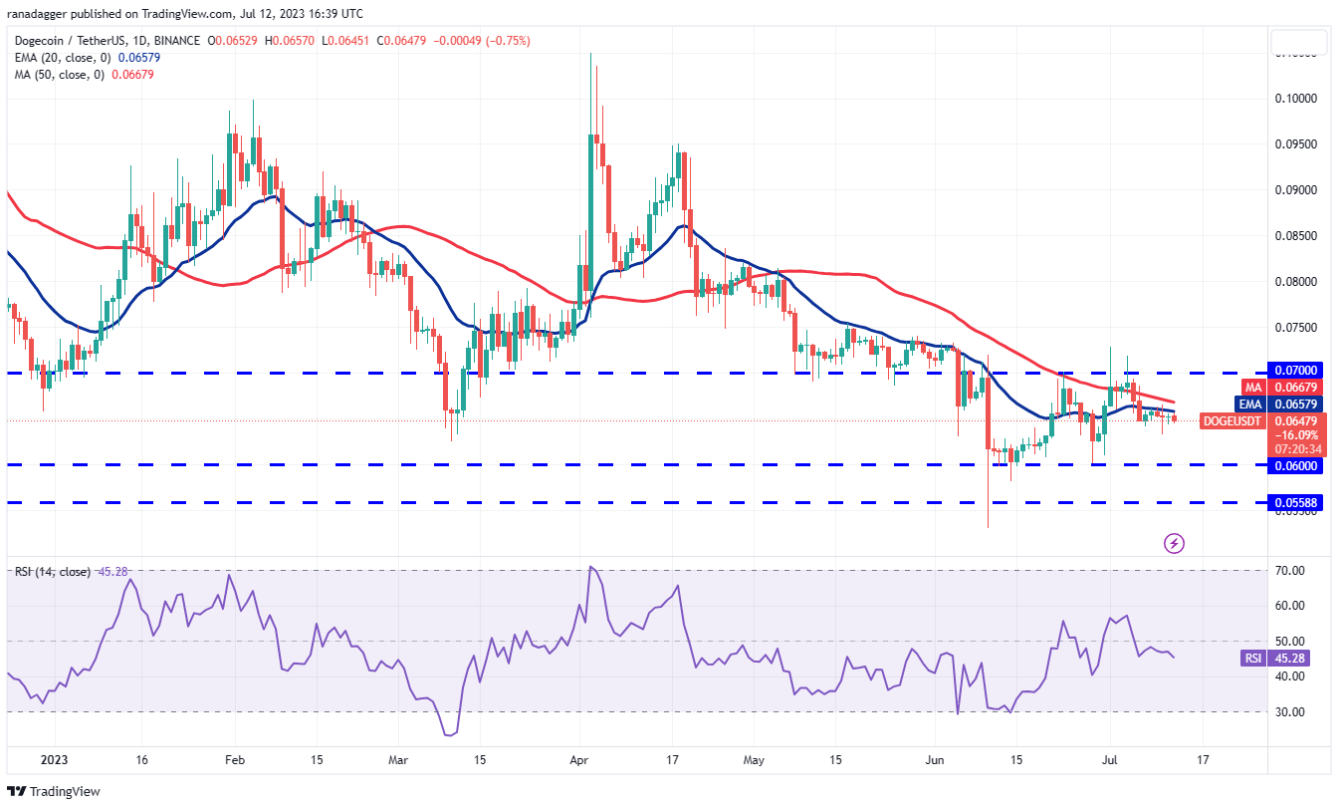
Daily DOGE/USDT Chart | Source: TradingView
The flat 20-day EMA and the RSI just below the midpoint suggest range-bound action between $0.06 and $0.07 for some more time. If the bulls push the price above the moving Medium , the bulls will attempt to overcome the obstacle at $0.07. If they can succeed, the DOGE/USDT pair can rally to $0.08.
The bears will have the upper hand if they push and sustain the price below the critical support at $0.06. After that, the pair can drop to $0.05.
Solana (SOL) is facing resistance at $22.30, but a positive sign is that the bulls have not given up much ground. This shows that buyers expect the rally to continue.
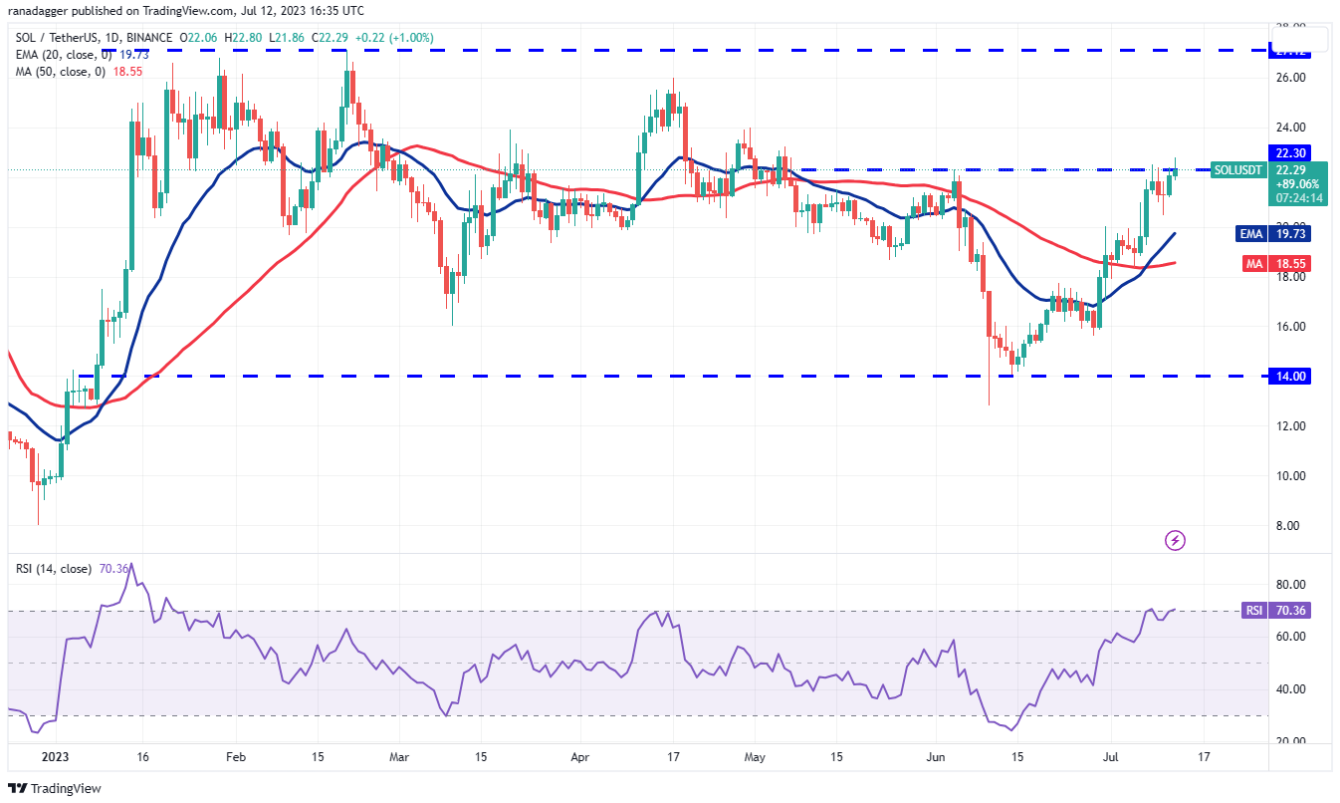
Daily SOL/USDT Chart | Source: TradingView
The 20-day EMA is sloping up ($19.73) and the RSI is in the overbought zone showing that the bulls are in command. A break and close above $22.50 could start the next leg of the uptrend. After that, the SOL/USDT pair might attempt to rally to $27.12. There is a minor resistance at $24, but it is likely to be crossed.
The first support on the downside is at the 20-day EMA and then the 50-day SMA ($18.55). Buyers are expected to defend this zone aggressively.
The long tail on the July 10 candlestick of Litecoin (LTC) shows strong buying by the bulls as the price drops below the 20-day EMA ($95).
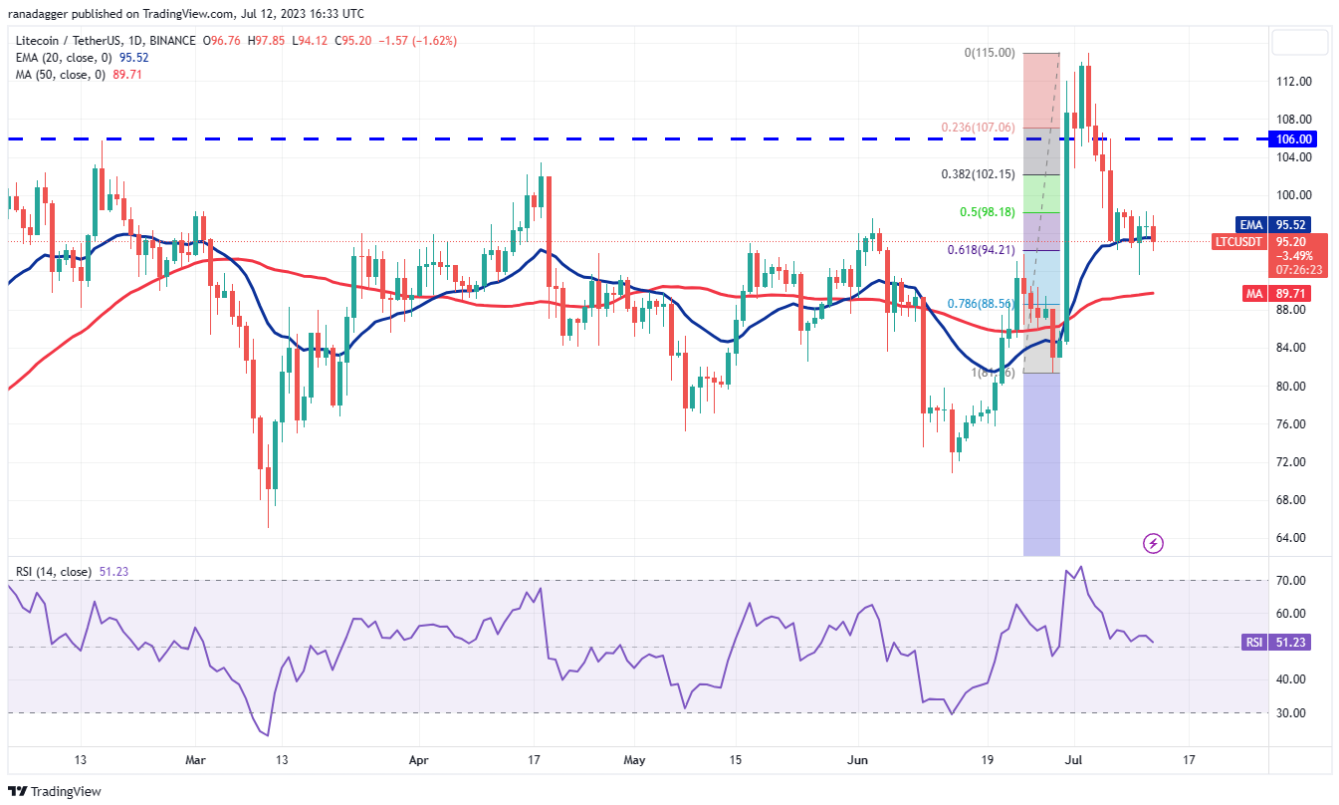
LTC/USDT Daily Chart | Source: TradingView
Buyers will have to break through the psychological barrier at $100 to signal the start of a sustained rally. Thereafter, the LTC/USDT pair can rally to $106 and above it to the overhead resistance at $115.
The key level to watch when the price drops is the 20-day EMA. If this level breaks, the pair can drop to the 50-day SMA ($89). Such a move could delay the start of the next leg of the uptrend.
Polygon (MATIC) spiked above the $0.73 resistance on July 10, completing an ascending triangle pattern.
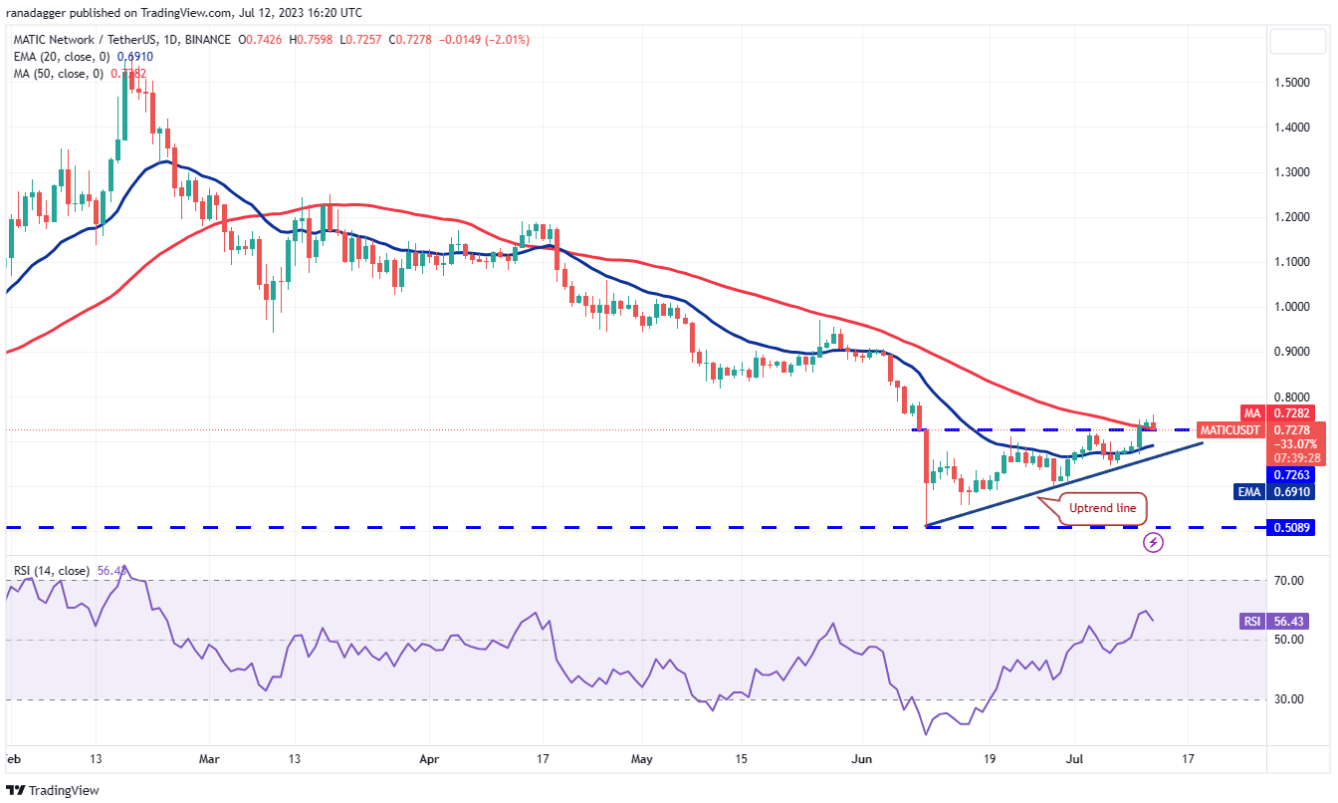
MATIC/USDT Daily Chart | Source: TradingView
The bulls have maintained the price above the breakout level, but they are facing stiff resistance from the bears at higher levels. If the bulls sustain the price above $0.72, the MATIC/USDT pair can start a new uptrend towards the pattern's target at $0.94.
Conversely, if the bears drag the price below $0.72, it can trap some aggressive bulls. The pair could then drop to the uptrend line, which is an important level to watch. If this support breaks, the pair can start a move down to $0.60.
Polkadot (DOT) bounced off the moving Medium on July 10, showing that sentiment has changed from selling when prices rise to buying when prices fall.
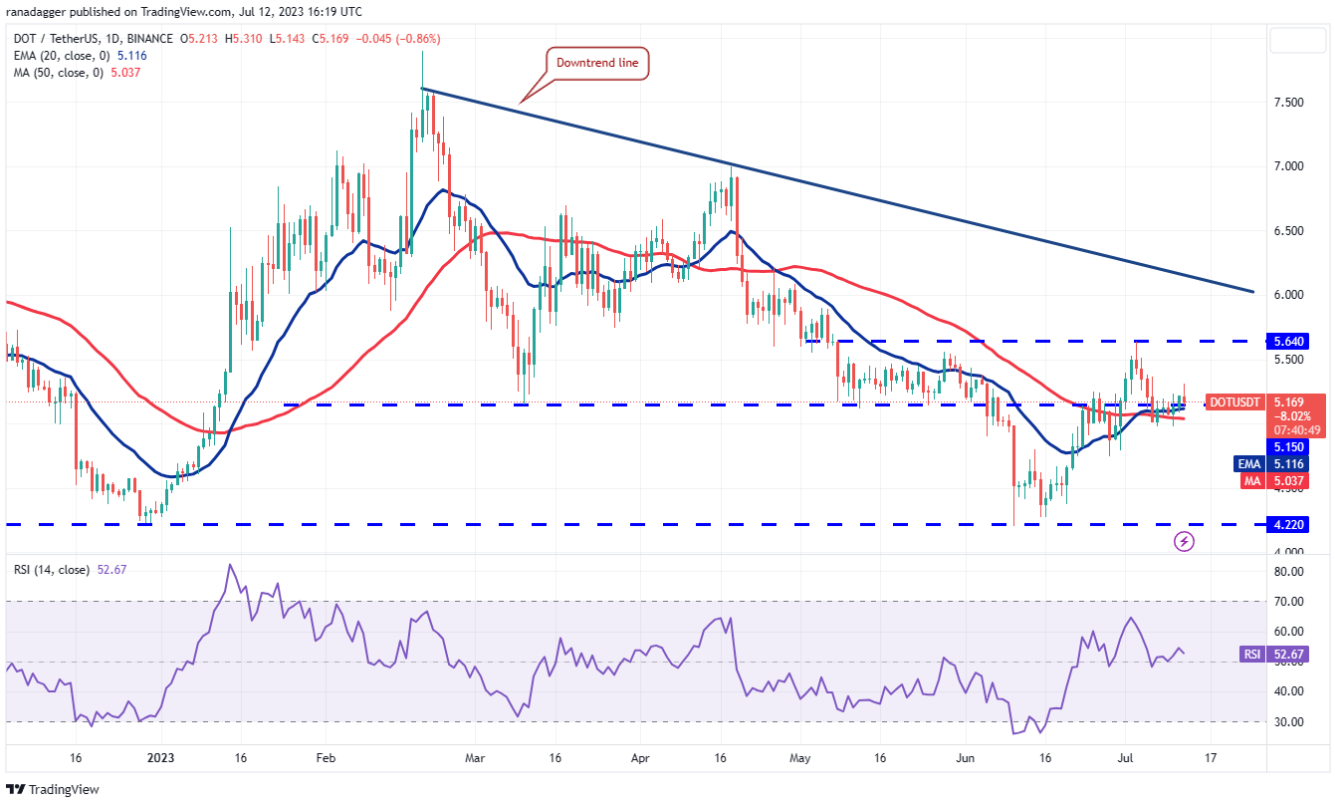
DOT/USDT Daily Chart | Source: TradingView
The bulls will attempt to push the price to the $5.64 resistance, while the bears will attempt to stave off the recovery. The 20-day EMA ($5.11) is flat, but the RSI above 52 shows that the bulls have a slight edge. A break and close above $5.64 will complete a bullish inverse head and shoulders pattern, signaling a possible trend reversal.
If the bears want to halt the rally, they will have to quickly drag the price below $4.97. After that, the DOT/USDT pair can drop to $4.74 and lower to $4.50.