Venice Token [VVV] surges 14% – Why THIS is the next KEY hurdle

ambcryptoPublicado a 2026-03-26Actualizado a 2026-03-26

Resumen

Venice Token (VVV) surged 14.37% to $6.40, supported by a 26.54% increase in trading volume, indicating strong spot market demand. The price broke out of a pennant pattern, shifting the market structure from consolidation to expansion, with immediate resistance at $6.68 and a potential target near $8.50. Key support now lies at $5.14. However, the MACD shows weakening bullish momentum with a negative histogram, suggesting a divergence between price action and underlying strength. Additionally, persistent sell pressure in Spot CVD indicates aggressive selling, though buyers appear to be absorbing it. Open Interest rose 18.74%, reflecting leveraged positioning that could fuel volatility. The rally's sustainability depends on holding above $5.14; a break below could quickly reverse gains.

Venice Token [VVV] has surged 14.37% to $6.40 as trading volume climbs 26.54% to $23.12M, signaling strong demand expansion across the spot market.

This expansion shows that price is not drifting upward but rather advancing through strong spot demand.

As participation increases, the rally reflects conviction instead of low-liquidity spikes. The VVV price increase toward $6.40 highlights alignment between demand and price action.

However, volume expansion at this stage also suggests that traders are reacting to the breakout rather than anticipating it.

As a result, this phase often defines whether continuation can hold or begin to fade under pressure.

VVV breaks free as structure shifts upward

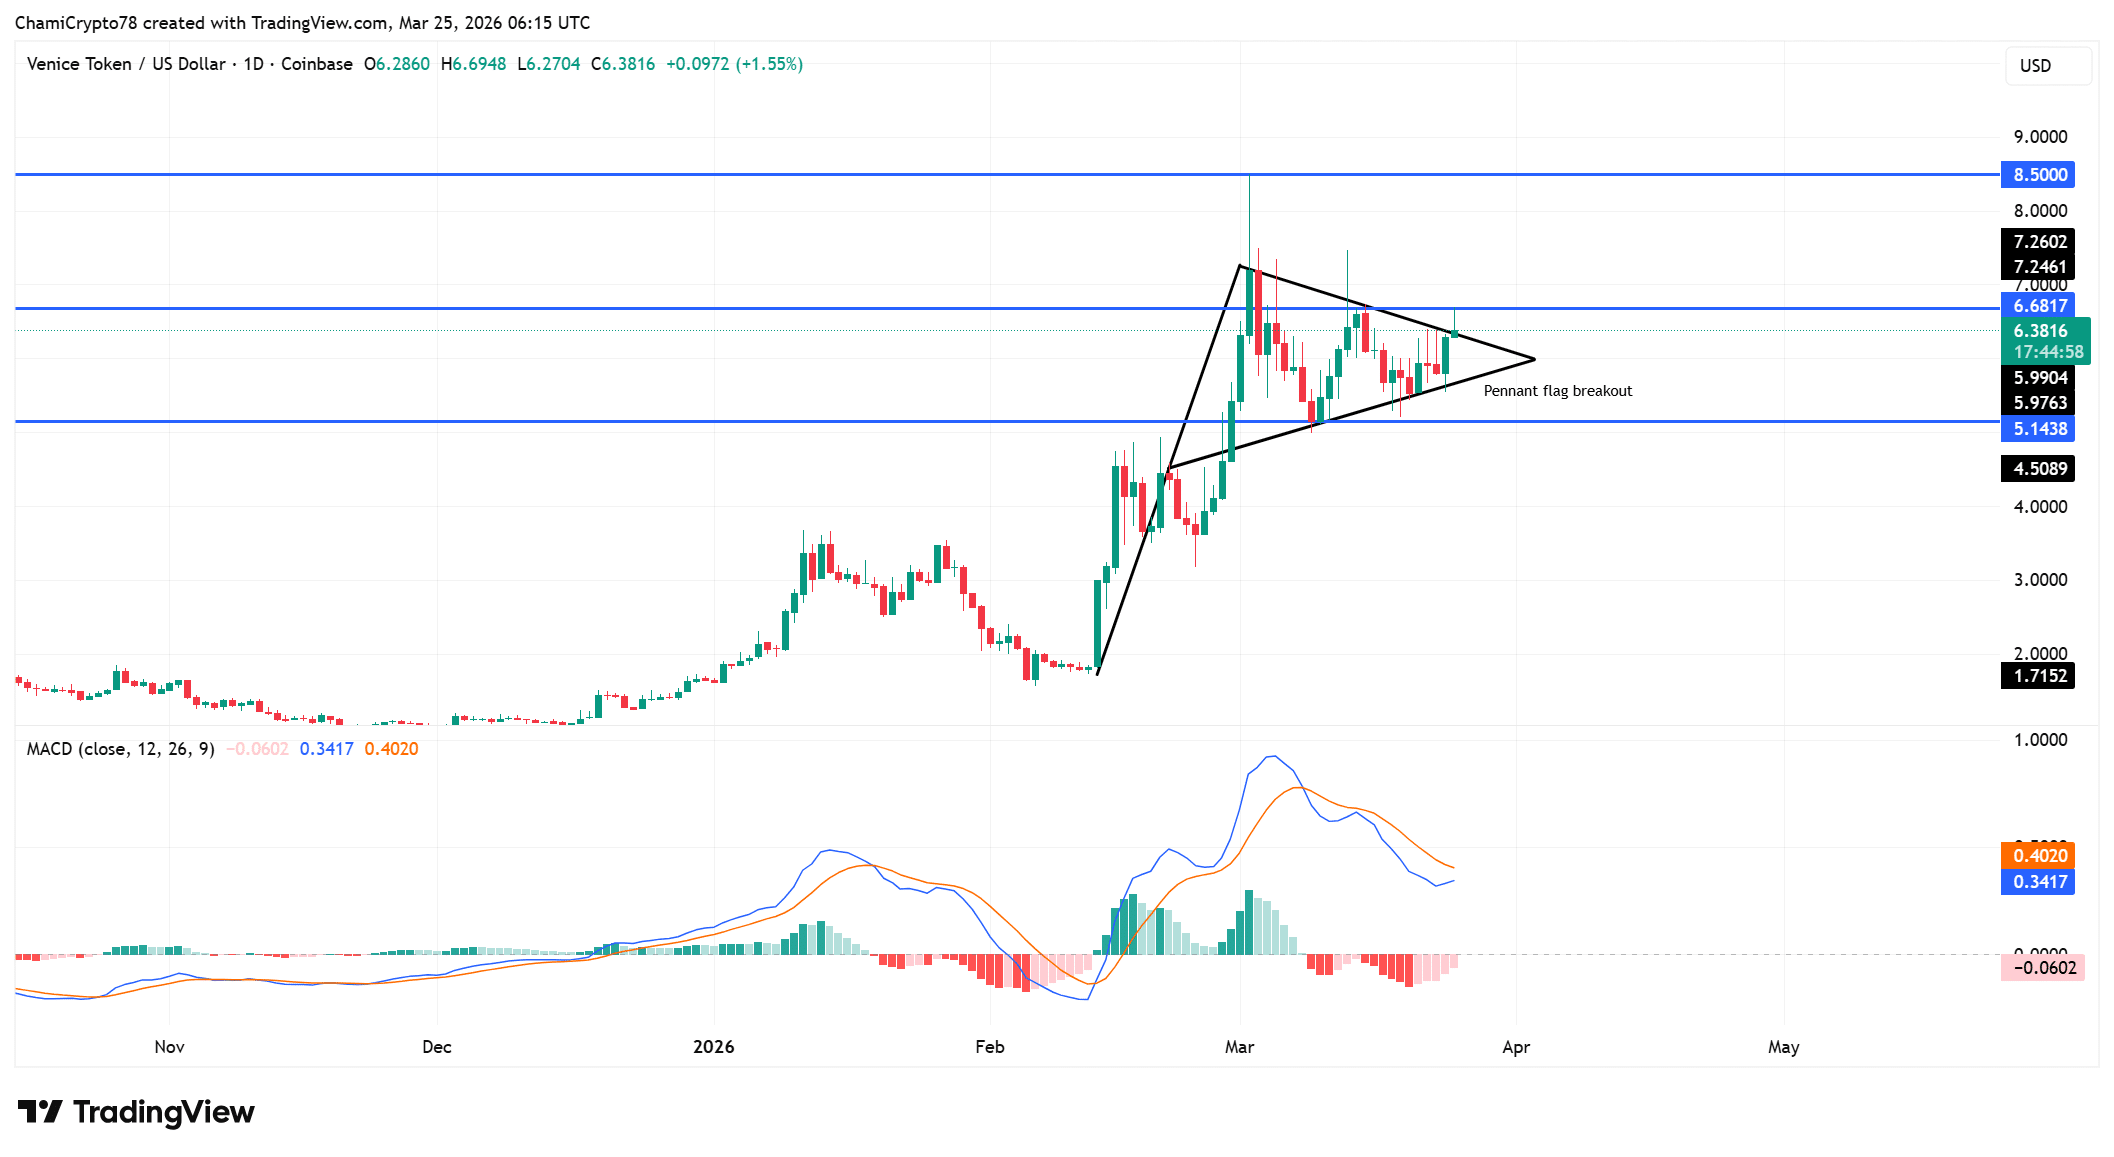
Price has broken out of the pennant flag, ending the prior compression phase and shifting structure toward expansion.

The breakout places immediate resistance at $6.68, while a broader target forms near $8.50 if continuation holds.

Besides, the former consolidation region around $5.14 now acts as a key support base. This transition reflects a shift from indecision into directional control.

However, price now approaches resistance zones where sellers may respond. As a result, holding above the breakout zone remains critical.

If price maintains this structure, the breakout could extend, but failure to hold support would quickly weaken the setup.

The MACD structure shows that bullish strength has not fully aligned with price action.

The indicator has not crossed above the signal line, which limits confirmation of sustained upside pressure.

Additionally, the histogram has turned negative, reflecting weakening strength after the breakout.

This divergence highlights a gap between structural expansion and internal strength. However, price continues holding above key levels, suggesting that buyers still defend the move.

As a result, the current setup reflects early-stage expansion rather than fully confirmed continuation.
Source: TradingView

CVD divergence exposes underlying sell pressure

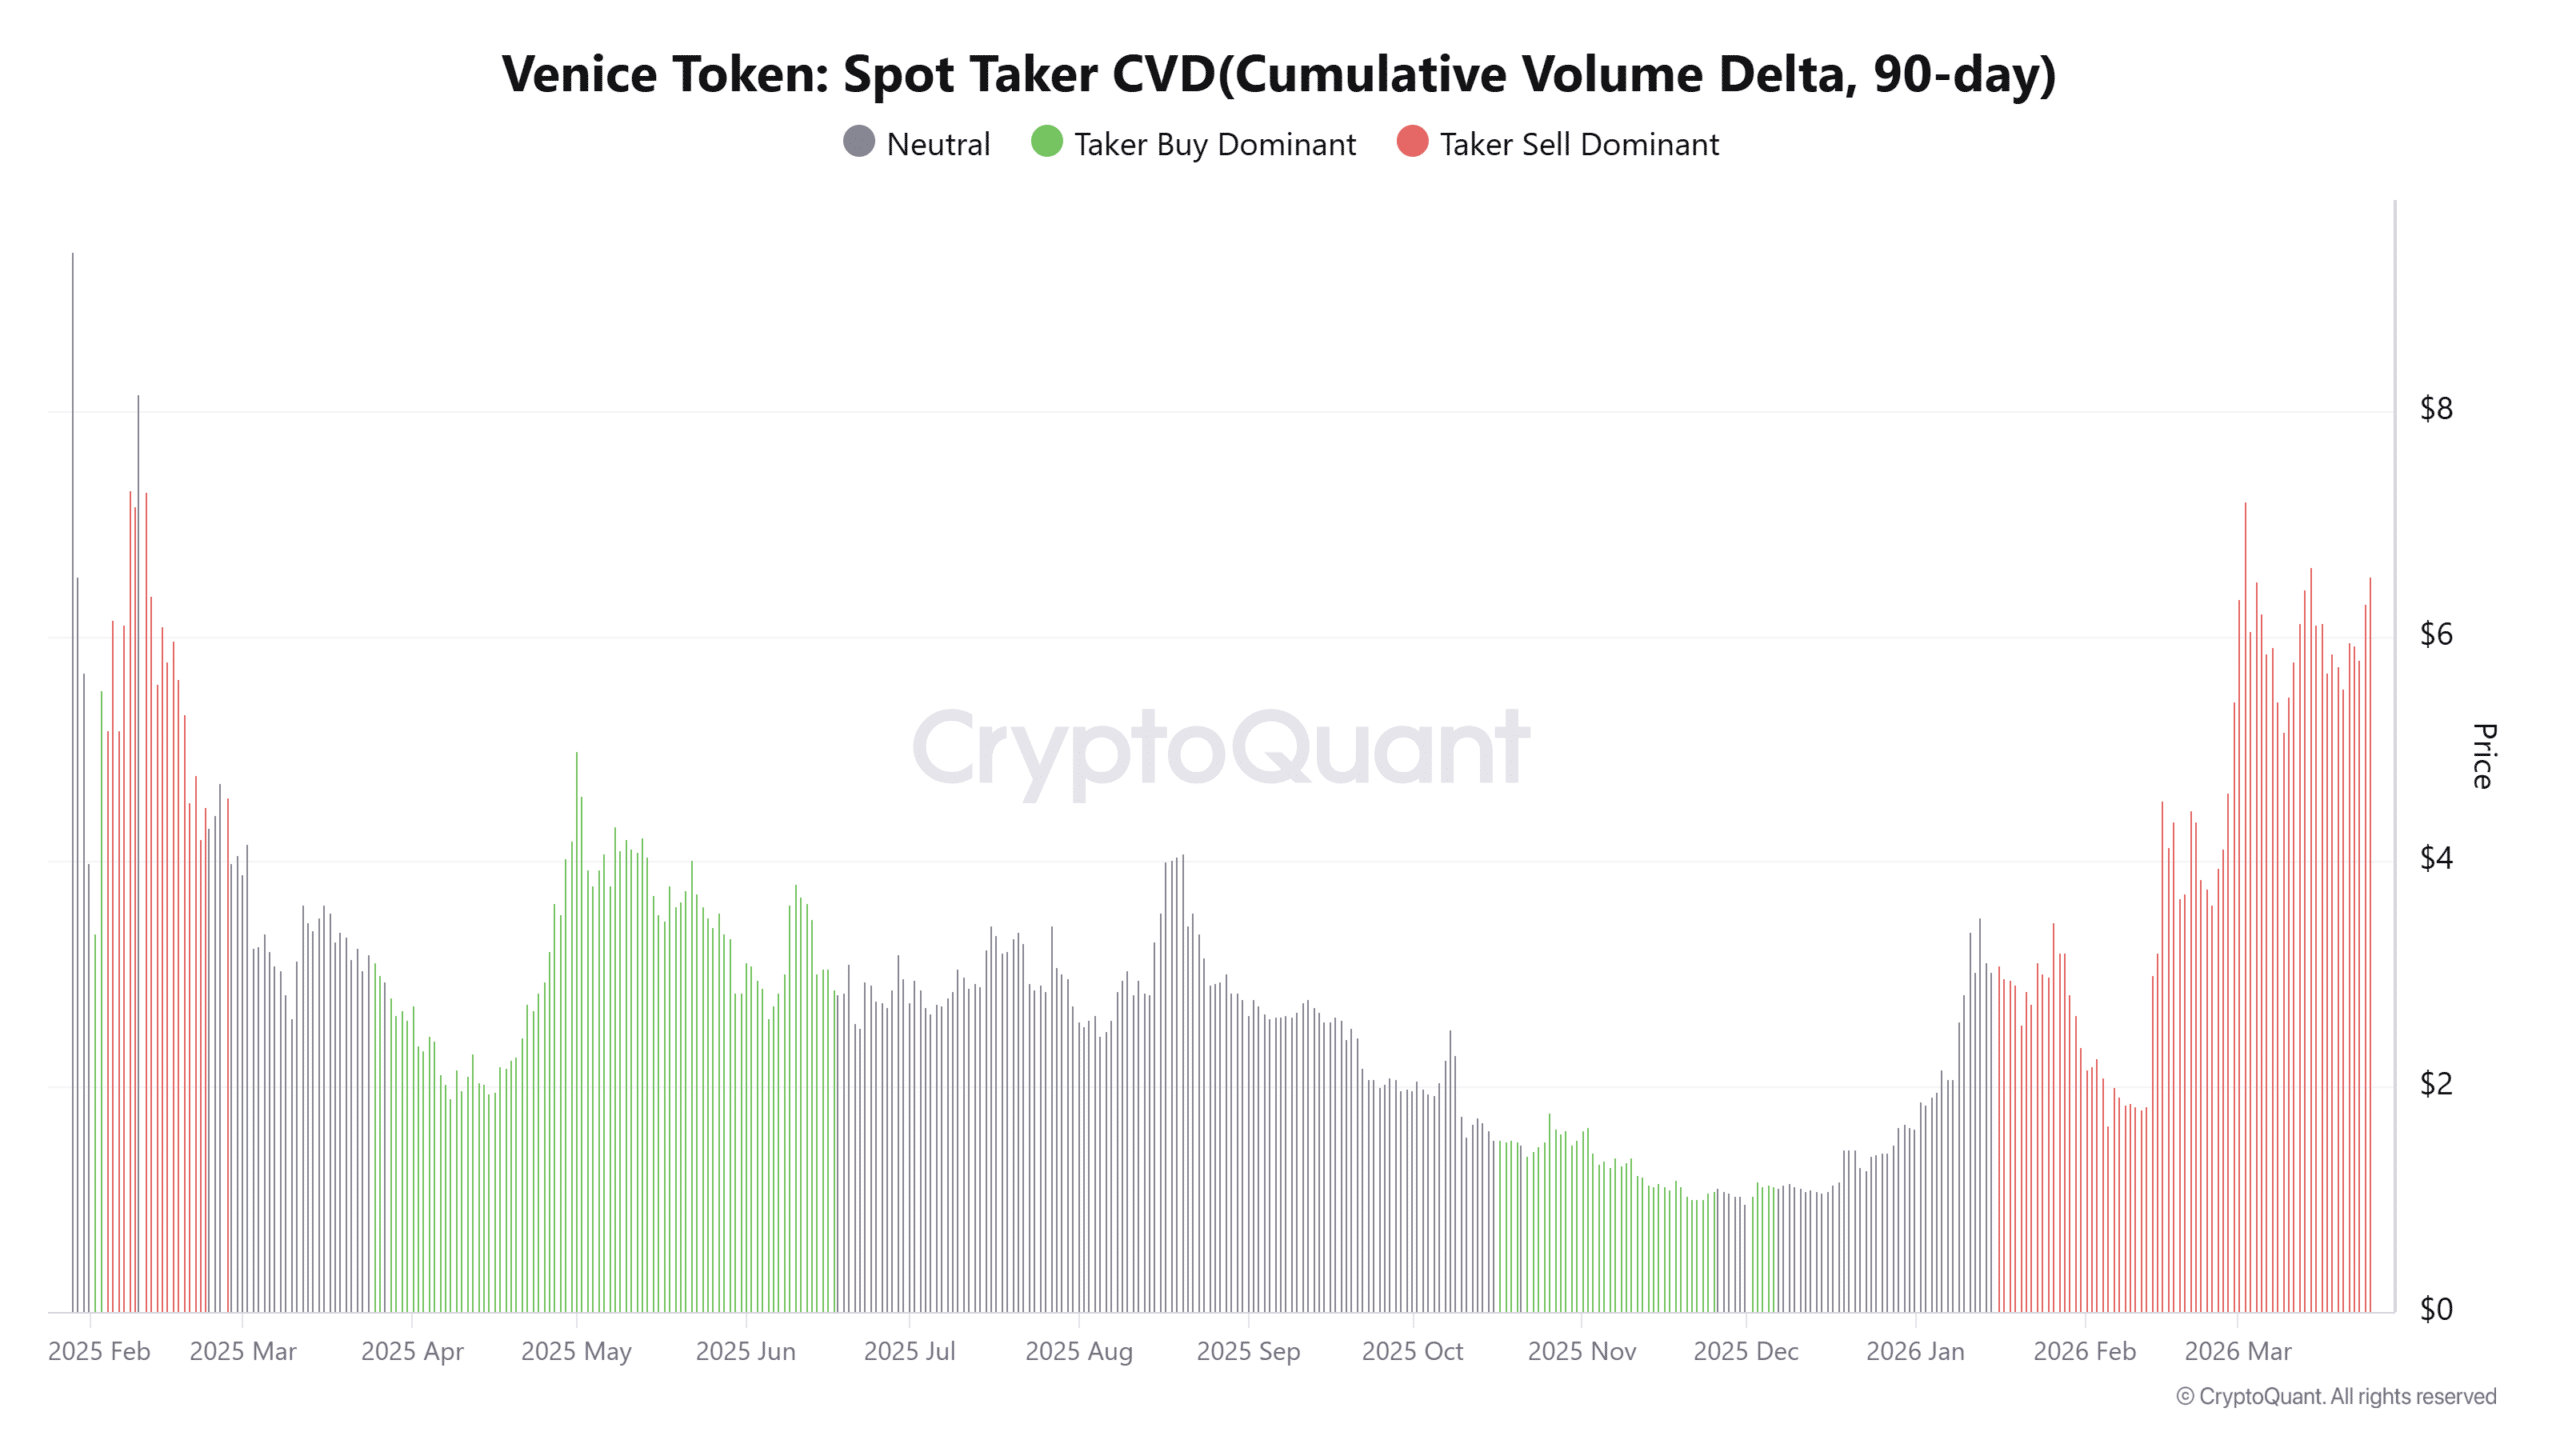
Spot Taker CVD remains sell-dominant over the past 90 days, revealing persistent aggressive selling beneath the rally.

This structure indicates that market participants continue executing sell orders even as price rises.

However, price has not declined, which suggests that larger buyers may be absorbing this supply.

This divergence highlights a key imbalance between visible selling and hidden demand. As a result, the rally depends on continued absorption to sustain upward movement.

If selling pressure intensifies without matching demand, the structure could weaken. However, as long as price holds, this absorption continues supporting the current trend.
Source: CryptoQuant

Open interest rise shows leveraged buildup into VVV breakout

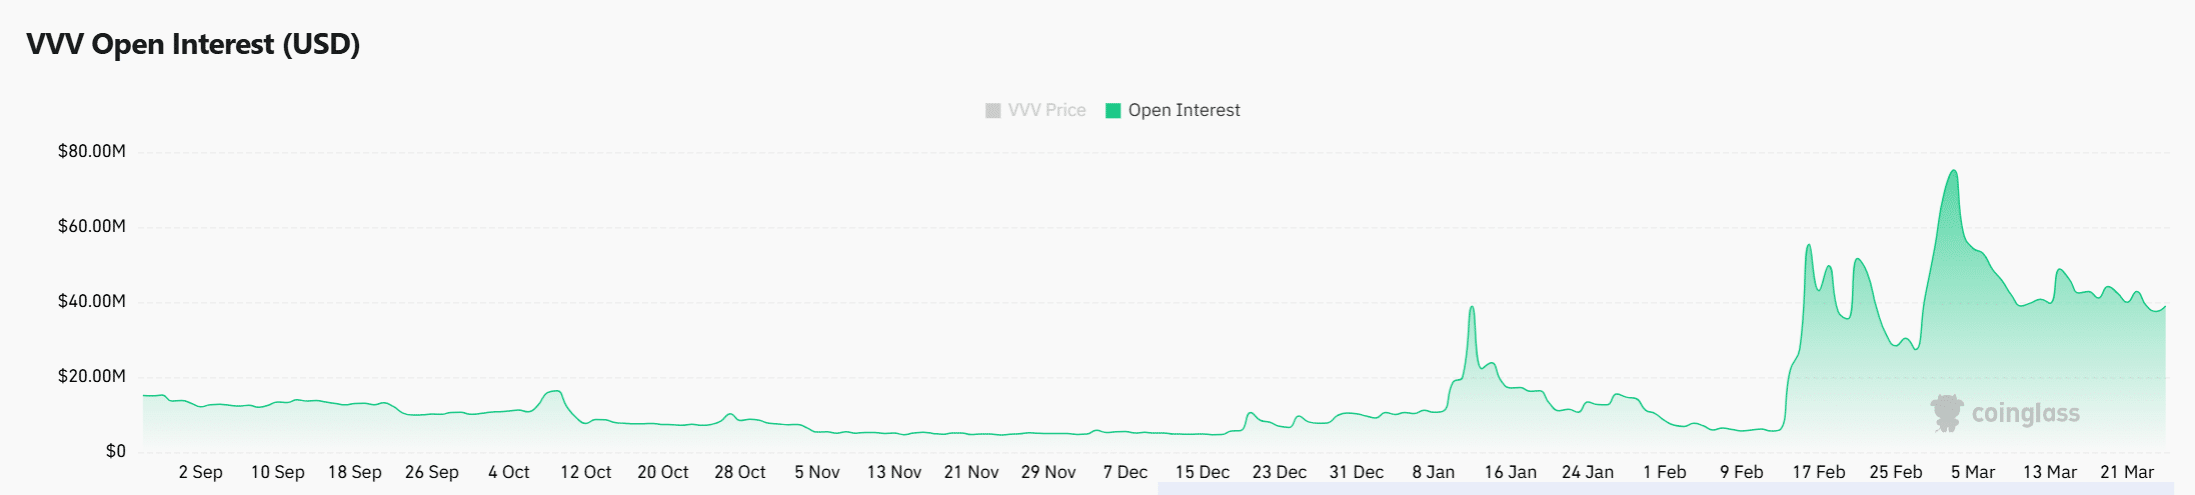
Open interest has increased by 18.74% to $43.21M, reflecting growing participation in derivatives markets.

This rise shows that traders are positioning aggressively as price breaks out of consolidation. However, leveraged positioning introduces volatility, especially near resistance zones.

As positions build, the market becomes sensitive to rapid price movements in either direction. This setup often leads to sharp expansions once liquidity gets triggered.

At the same time, rising open interest without strong confirmation from other indicators increases risk.

If price continues higher, these positions could fuel continuation, but any reversal would quickly unwind these leveraged trades.
Source: CoinGlass


VVV has broken out with strong volume support, which strengthens its bullish structure. However, weakening MACD signals and persistent sell pressure create underlying tension.

The rally can sustain if buyers continue absorbing supply and hold above $5.14. If that support fails, the breakout would likely weaken quickly under pressure.


Final Summary

  • VVV surged 14% to $6.40, backed by a 26% jump in Spot Volume. Breakout above the pennant shifted the structure from consolidation to expansion.
  • Open Interest rose 18%, signaling aggressive leveraged positioning. Rising leverage increases the risk of sharp moves, especially near resistance


Preguntas relacionadas

QWhat is the current price of Venice Token (VVV) and by what percentage has it surged?

AThe current price of Venice Token (VVV) is $6.40, and it has surged by 14.37%.

QWhat key resistance level does the article identify for VVV after its breakout?

AThe article identifies $6.68 as the immediate resistance level for VVV after its breakout.

QAccording to the MACD indicator, what divergence suggests a lack of full confirmation for the upward price movement?

AThe MACD has not crossed above the signal line, and the histogram has turned negative, indicating a divergence between the price expansion and the underlying bullish strength.

QWhat does the persistent sell-dominant Spot Taker CVD indicate about the market activity?

AThe persistent sell-dominant Spot Taker CVD indicates that there is aggressive selling pressure happening beneath the rally, which is being absorbed by larger buyers to sustain the price increase.

QWhy does the rise in Open Interest introduce increased risk for VVV price movement?

AThe 18.74% rise in Open Interest to $43.21M shows that traders are using significant leverage. This introduces volatility and the risk of sharp price movements in either direction, as these leveraged positions could quickly unwind if the price reverses.

Lecturas Relacionadas

Atención obligatoria para la próxima semana|Se espera una votación en el Senado sobre el proyecto de ley CLARITY; SpaceX y Circle publicarán resultados financieros (3-9 de agosto)

**Resumen: Próximos eventos clave en cripto y tecnología (3-9 de agosto de 2026)** La semana del 3 al 9 de agosto trae eventos importantes. En política estadounidense, el **CLARITY Act**, un proyecto de ley bipartidista que busca establecer un marco regulatorio federal para las criptomonedas, podría someterse a votación en el Senado. Los negociadores tienen hasta el **7 de agosto** para conseguir los 60 votos necesarios. En resultados corporativos, **SpaceX** publicará sus resultados del Q2 el **4 de agosto**, seguido de un importante desbloqueo del 8% de sus acciones para accionistas internos el **6 de agosto**. **Circle**, la empresa detrás de USDC, informará el **5 de agosto**. Otras empresas como la minera de Bitcoin **Hut 8** y **American Bitcoin**, vinculada a la familia Trump, también presentarán resultados. En otros anuncios, **Zapper** y **Ctrl Wallet** cerrarán sus servicios el **3 de agosto**. **LayerZero** descontinuará sus relés para la versión v1 ese mismo día. **Upbit** dejará de cotizar los tokens AQT y AERGO. Además, **Elon Musk** anunció que **Grok 4.6** se lanzará alrededor del **7 de agosto**. Finalmente, los mercados estarán atentos al **informe de nóminas no agrícolas de EE.UU. de julio**, que se publicará el **7 de agosto**, y al inicio de la señalización obligatoria para **BIP-110** en la red Bitcoin alrededor del **8 de agosto**.

marsbitHace 1 hora(s)

Atención obligatoria para la próxima semana|Se espera una votación en el Senado sobre el proyecto de ley CLARITY; SpaceX y Circle publicarán resultados financieros (3-9 de agosto)

marsbitHace 1 hora(s)

Las acciones caen más que las criptomonedas, ¿a dónde se fue el dinero?

Los días 28 y 29 de julio, el índice Kospi de Corea del Sur activó el mecanismo de suspensión de contratación ("circuit breaker") de forma consecutiva, algo sin precedentes. Acciones clave como SK Hynix cayeron bruscamente, y ETF apalancados vinculados a ellas sufrieron pérdidas devastadoras, con caídas superiores al 80% en un mes. La narrativa global de desapalancamiento forzado golpeó con mayor dureza a las operaciones más concurridas, como las acciones tecnológicas y semiconductores. Paradójicamente, Bitcoin, conocido por su alta volatilidad, mostró una relativa estabilidad durante este período, recuperándose cerca de un 15% desde mínimos de julio. El artículo argumenta que esto no se debió a una entrada de capital desde el mercado bursátil, sino a que Bitcoin ya había sufrido su propia corrección significativa entre mayo y junio, con salidas récord de los ETF estadounidenses. El dinero que salió del mercado de valores buscó principalmente refugio en efectivo, bonos del Tesoro estadounidense y, sobre todo, en oro. Los datos muestran una correlación negativa récord entre Bitcoin y el oro, desafiando la narrativa del "oro digital". En esta crisis, el oro cumplió el rol de activo refugio, mientras que Bitcoin permaneció en el extremo más riesgoso de la curva. Para que llegue una entrada de capital sostenida a Bitcoin, el artículo identifica tres condiciones clave: alivio en la presión de liquidez global, recortes de tasas por la Fed sin recesión, y la aprobación de una legislación clara (como el CLARITY Act en EE.UU.) que elimine las incertidumbres regulatorias. Aunque Bitcoin actualmente no es un refugio, su baja correlación con los mercados tradicionales lo posiciona favorablemente para cuando el capital global vuelva a buscar diversificación una vez que pase la tormenta.

marsbitHace 1 hora(s)

Las acciones caen más que las criptomonedas, ¿a dónde se fue el dinero?

marsbitHace 1 hora(s)

Diálogo con Ray Dalio: Nos encontramos en una burbuja de IA actualmente, el 1% de mi cartera de inversiones está en Bitcoin

**Fuente: The Diary Of A CEO** **Resumen: Felix, PANews** Ray Dalio, fundador de Bridgewater Associates, advierte sobre una burbuja en la inteligencia artificial actual, comparable a burbujas históricas como la de Internet en 2000. Según Dalio, los signos clásicos están presentes: precios inflados, endeudamiento basado en ganancias especulativas y una posible corrección brusca si suben las tasas de interés o cambian las condiciones económicas. Dalio explica que esta burbuja se enmarca en un "gran ciclo" más amplio —de unos 80 años— caracterizado por tres dinámicas: creciente desigualdad interna, déficits fiscales gubernamentales y cambios en el orden geopolítico mundial. Estados Unidos y otros países occidentales se encuentran en una fase de declive relativo dentro de este ciclo. Para proteger la riqueza personal, Dalio recomienda diversificar las inversiones más allá del efectivo, incluyendo activos como oro, acciones y bonos. Aunque revela que alrededor del 1% de su cartera está en Bitcoin —considerándolo un activo escaso—, prefiere el oro físico por su seguridad histórica y su rol como reserva de los bancos centrales. Sobre el impacto laboral de la IA, Dalio prevé que aumentará la desigualdad, beneficiando sobre todo a los dueños de capital. Sin embargo, destaca que las habilidades humanas —como la intuición y la emoción— seguirán siendo valiosas y complementarias a la IA. En el ámbito geopolítico, Dalio anticipa un mundo más regionalizado, con EE.UU. y China como potencias líderes en sus respectivas esferas, y advierte que conflictos como el de Irán han expuesto debilidades estratégicas de Estados Unidos, acelerando un cambio en el equilibrio global de poder.

marsbitHace 5 hora(s)

Diálogo con Ray Dalio: Nos encontramos en una burbuja de IA actualmente, el 1% de mi cartera de inversiones está en Bitcoin

marsbitHace 5 hora(s)

Trading

Spot
活动图片