Middle East Conflict Rekindles Rate Hike Expectations, Gold Suffers Worst Sell-off in 43 Years

marsbitPublicado a 2026-03-23Actualizado a 2026-03-23

Resumen

Gold suffered its worst weekly decline in 43 years, with spot prices falling for eight consecutive sessions—the longest losing streak since October 2023. Silver also plunged over 15%, while platinum and palladium followed lower. The sell-off was triggered by escalating Middle East conflicts, which drove up oil prices and reinforced expectations of Federal Reserve rate hikes rather than cuts. Market bets on a Fed hike by October rose to 50%, reducing the appeal of non-yielding gold amid higher real rate prospects. Technical indicators worsened, with RSI falling below 30, triggering stop-losses and self-reinforcing selling. Gold ETFs saw outflows for three straight weeks, losing over 60 tons. The situation echoes the 1983 crash when OPEC nations sold gold reserves to raise cash amid an oil price collapse. Despite a 4% year-to-date gain, macro conditions have deteriorated. Rising energy prices may reduce global GDP by 0.3% and lift inflation by 0.5-0.6%, increasing stagflation risks. Gold’s future trajectory hinges on real rates and geopolitical developments—further rate hike expectations could sustain pressure, while any de-escalation may revive safe-haven demand.

Gold recorded its worst weekly decline in 43 years this week, with historical echoes sending chills through the market.

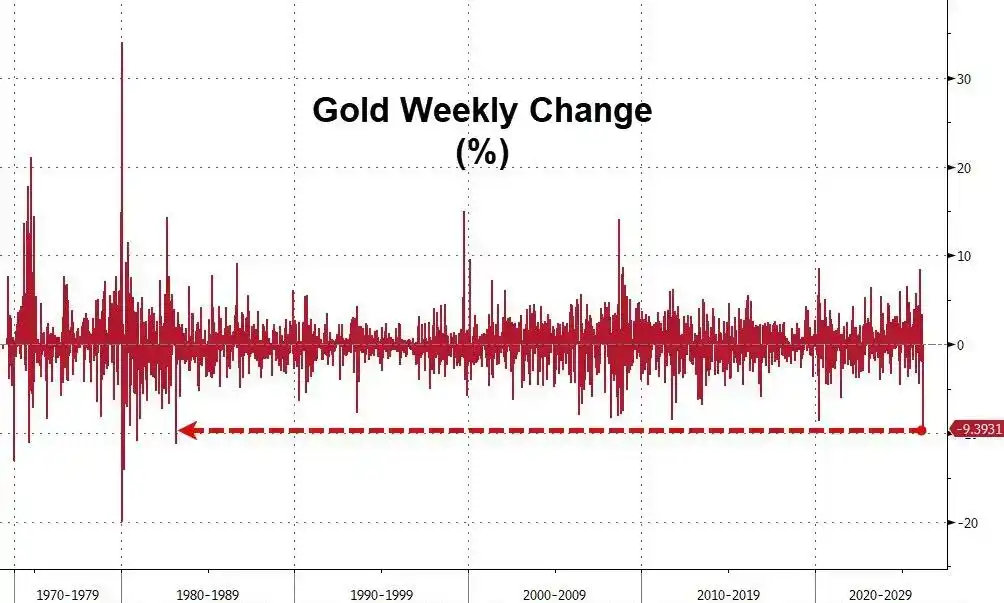
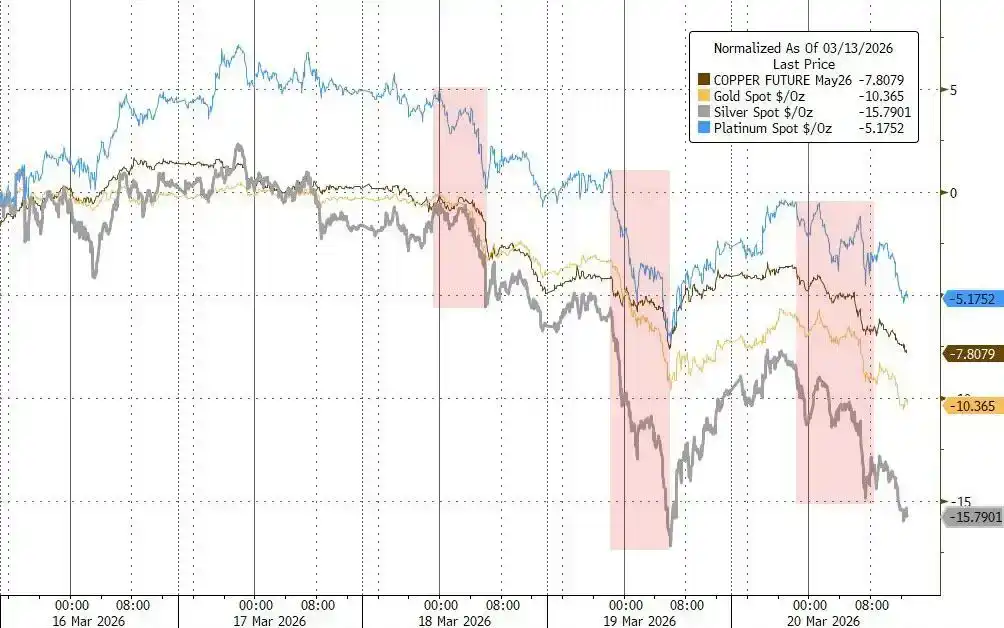
This week, gold posted its largest weekly drop since March 1983, with the spot price falling for eight consecutive days, marking the longest losing streak since October 2023. Meanwhile, silver fell more than 15% this week, with palladium and platinum also moving lower.
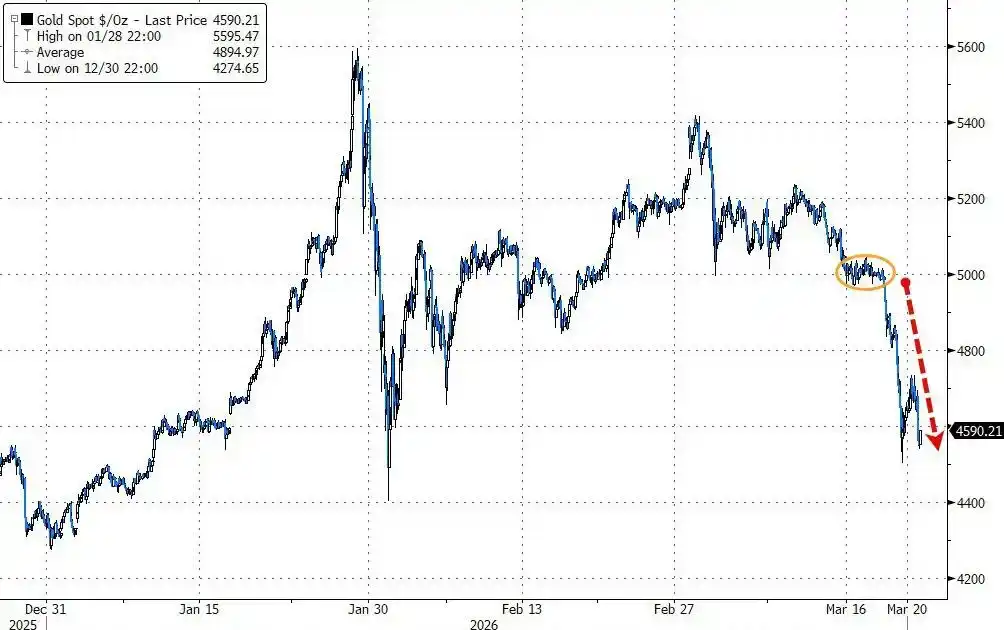
The trigger for this sharp decline was the escalating Middle East conflict, which pushed up energy prices and, in turn, suppressed expectations for interest rate cuts. Market bets on a Federal Reserve rate hike have risen to 50%, fueling this wave of selling in precious metals.

More alarmingly for the market, the current situation bears a striking resemblance to the historic crash in March 1983, which was triggered by massive gold sales by Middle Eastern oil producers—back then, OPEC members, facing plummeting oil revenues, were forced to sell their gold reserves for cash, causing the gold price to plunge over a hundred dollars in a matter of days.

It is worth noting that, according to historical data, this week's decline in gold is the most severe since that "sell-gold-for-cash" storm 43 years ago.
Rate Cut Expectations Unravel, Gold's Safe-Haven Logic Fails

Since the US and Israel launched attacks on Iran last month, gold has been declining for several weeks, a stark contrast to its traditional role as a "safe-haven asset."

The reason is that the war brings not expectations of easing but inflationary pressures. Currently, the market's prediction of the Fed's policy path has undergone a fundamental reversal.

Traders are now pricing in a 50% probability of a Fed rate hike by October. Soaring energy prices are boosting inflation expectations, and gold, as a non-yielding asset, becomes significantly less attractive in an environment of rising real interest rates.

At the same time, there are signs of tightening US dollar liquidity. Cross-currency basis swaps began to widen noticeably this week, indicating a degree of dollar funding pressure.

This phenomenon may explain the deeper logic behind the gold sell-off—when dollar liquidity tightens, gold is often one of the first assets investors liquidate.

It is noteworthy that the most severe declines in the metals market this week were concentrated during Asian and European trading hours, consistent with the pattern of dollar shortage pressures first appearing in offshore markets.
Technical Stop-Losses Triggered, Selling Becomes Self-Reinforcing

Amid the sustained decline, gold's technical indicators have deteriorated significantly, with the 14-day Relative Strength Index (RSI) falling below 30, entering a zone some traders consider oversold.

Rhona O'Connell, an analyst at StoneX Financial, pointed out that this gold correction is the result of profit-taking and liquidity liquidation. She stated that the price above $5,200 had attracted substantial buying, making the market积累相当的回调脆弱性 (accumulated considerable vulnerability to a correction).

Once prices started to fall, a large number of investors' stop-loss orders were automatically triggered, rapidly forming a self-reinforcing spiral of selling. Technical signals like moving averages further exacerbated the downward pressure.

Meanwhile, passive selling triggered by falling stock markets also spilled over into gold.

O'Connell noted that forced liquidations related to equity assets may have dragged down gold prices, while slowing central bank gold purchases and continued outflows from gold ETFs further dampened market sentiment. According to Bloomberg data, gold ETFs have seen net outflows for three consecutive weeks, with combined holdings dropping by more than 60 tonnes over those three weeks.

The Ghost of the 1983 Middle East "Sell-Gold-for-Cash"

The current situation reminds market participants of the oil crisis-induced gold crash 43 years ago.

Historical data shows that around February 21, 1983, British and Norwegian oil producers led price cuts, putting pressure on OPEC to follow suit, abruptly intensifying the global oil market's oversupply. Facing a sharp contraction in oil revenues, Middle Eastern oil producers (mainly OPEC members) were forced to sell their gold reserves on a large scale to raise cash, triggering a gold price crash.

Reporting from The New York Times at the time corroborates this. According to a March 1, 1983, New York Times report, traders explicitly stated that sales by Middle Eastern oil producers were the direct trigger for the gold price plunge and warned that if oil revenues fell further, these Arab countries might sell more gold. At that time, the gold price plunged more than $105 from its high in less than a week, with the largest single-day drop reaching $42.50, the worst in nearly three years.
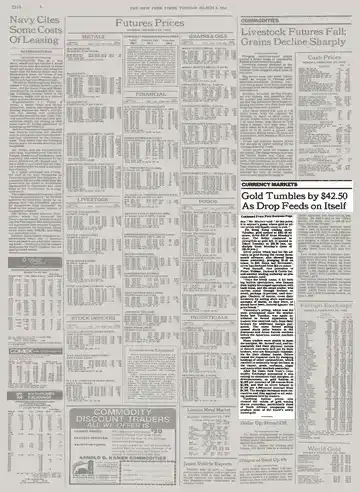
According to the New York Times report at the time, the proceeds from the Middle Eastern sales immediately flowed into Eurodollars and other short-term investment vehicles, causing short-term interest rates to soften, which in turn sent a warning signal to the global gold market. Since February 21 coincided with the US Presidents' Day holiday, with New York markets closed, the full impact wasn't felt until the following week, subsequently triggering chain-reaction forced liquidations that also affected commodity markets like copper, grains, soybeans, and sugar.

ZeroHedge pointed out that the 1983 gold crash marked the entry of the oil market into a bear market cycle that lasted for years—OPEC discipline frayed, market share was continuously lost, and oil prices remained under pressure throughout the 1980s.

Stagflation Clouds Loom, Can Gold Prices Stabilize?

Despite this week's heavy losses, gold is still up about 4% year-to-date. The price hit a record high of nearly $5,600 per ounce in late January, supported then by investor enthusiasm, central bank buying sprees, and market concerns about Trump interfering with Fed independence.

However, the current macroeconomic environment has significantly deteriorated. According to a Bloomberg report, Goldman Sachs economist Joseph Briggs expects that rising energy prices will drag global GDP down by 0.3 percentage points over the next year and push overall inflation up by 0.5 to 0.6 percentage points. Rising stagflation risks are severely compressing central banks' policy space.

Goldman Sachs analyst Chris Hussey noted that the blockade of the Strait of Hormuz has entered its fourth week, and hopes for a quick resolution of the conflict are fading. If the conflict continues, the longer oil prices remain high, the harder it becomes for the "look-through the short-term pain" narrative in stock and bond markets to hold, and the vulnerability of global assets will be further exposed.

For gold, the path of real interest rates will be a key variable. If the conflict drags on, inflation expectations continue to heat up, and the Fed's rate hike path becomes clearer, pressure on gold may persist; whereas, once signals of a easing in geopolitical tensions emerge, whether suppressed safe-haven demand can be released again remains the market's biggest悬念 (suspense).


Preguntas relacionadas

QWhat was the sharpest weekly decline in gold prices since 1983 triggered by?

AThe sharpest weekly decline in gold prices since 1983 was triggered by escalating Middle East conflicts, which raised energy prices and suppressed expectations for interest rate cuts, leading to increased bets on Federal Reserve rate hikes.

QHow does the current gold market situation parallel the historical event of 1983?

AThe current situation parallels the 1983 event where OPEC members, facing a sharp drop in oil revenue, were forced to sell off their gold reserves to raise cash, causing a historic crash in gold prices.

QWhy did the traditional 'safe-haven' logic for gold fail during the recent Middle East tensions?

AThe traditional safe-haven logic failed because the war brought inflationary pressure instead of expectations for monetary easing. Rising energy prices increased inflation expectations, making gold, a non-yielding asset, less attractive as real rates rose.

QWhat technical indicator signaled that gold had entered oversold territory during the sell-off?

AThe 14-day Relative Strength Index (RSI) fell below 30, which is a level some traders consider to indicate an oversold market.

QAccording to Goldman Sachs analysis, what is the expected economic impact of rising energy prices?

AGoldman Sachs economists estimated that rising energy prices would reduce global GDP by 0.3 percentage points over the next year and raise overall inflation by 0.5 to 0.6 percentage points, increasing stagflation risks.

Lecturas Relacionadas

"Teletubbies" robots hacen limpieza a domicilio, 200 yuanes/hora, pura inteligencia *artificial*

La compañía de robótica Tau Robotics, con sede en San Francisco, ha presentado su nuevo servicio de limpieza doméstica utilizando robots humanoides teleoperados. Bautizados cariñosamente como "Teletubbies" por su antena similar a un router Wi-Fi en la cabeza, estos robots, llamados Chelsea, Elon y Tony, realizan tareas como limpiar cocinas, baños, recoger basura y trapear pisos. La gran revelación, y decepción para algunos, es que las demostraciones mostradas son operadas por control remoto en tiempo real ("inteligencia artificial 100% humana"). La empresa defiende este enfoque como una solución práctica para cerrar la brecha tecnológica actual, permitiendo la recolección de datos del mundo real para eventualmente desarrollar autonomía completa, similar al "modo sombra" en los coches autónomos. El servicio, disponible por invitación en el área de la Bahía de San Francisco, cuesta 30 dólares (unos 200 yuanes) por hora, un precio competitivo frente a los servicios de limpieza humana en EE.UU. El artículo analiza los desafíos de introducir robots humanoides en hogares, comparando el enfoque estadounidense con el chino, que prioriza entornos industriales más controlados. Se argumenta que la forma humanoide facilita la teleoperación intuitiva y podría ofrecer un valor emocional único, aunque su necesidad funcional frente a robots con ruedas sigue siendo objeto de debate.

marsbitHace 3 min(s)

"Teletubbies" robots hacen limpieza a domicilio, 200 yuanes/hora, pura inteligencia *artificial*

marsbitHace 3 min(s)

Qualcomm: La fiebre de la IA se desvanece, ¿cuándo saldrá el mercado de teléfonos de la niebla?

El 30 de julio de 2026, Qualcomm publicó sus resultados del tercer trimestre del año fiscal 2026. Los ingresos fueron de 9,950 millones de dólares, un 4% menos que el año anterior, superando las expectativas del mercado. Sin embargo, el margen bruto cayó al 53,1%, por debajo de lo previsto, debido al aumento de costes en fabricación, ensamblaje y memoria. El negocio principal de chips para teléfonos registró una fuerte caída del 19,6%, alcanzando los 5,090 millones de dólares. Esto se debió a una disminución general del 11% en los envíos de teléfonos Android y a que los fabricantes optaron por usar plataformas anteriores para reducir costes. En contraste, el segmento automotriz creció un 61%, impulsado por los sistemas de infoentretenimiento, y el de IoT aumentó un 9%. La compañía prevé unos ingresos para el próximo trimestre entre 9,700 y 10,500 millones de dólares, pero una ganancia por acción inferior a las expectativas. El mercado de teléfonos sigue débil y los precios de la memoria presionan los costes. Ante la debilidad de su negocio central, Qualcomm busca oportunidades en IA. Su estrategia incluye IA en dispositivos (teléfonos, PC, coches) y una importante incursión en centros de datos, con aceleradores de IA, CPU comerciales, chips personalizados y productos de conectividad. Aunque esta estrategia impulsó antes su cotización, las preocupaciones sobre el gasto en IA la han hecho retroceder. La empresa tiene el objetivo de alcanzar 15,000 millones de dólares en ingresos por centros de datos para 2029, pero por ahora, este negocio se percibe con escepticismo, mientras el mercado tradicional sigue enfrentando desafíos.

marsbitHace 52 min(s)

Qualcomm: La fiebre de la IA se desvanece, ¿cuándo saldrá el mercado de teléfonos de la niebla?

marsbitHace 52 min(s)

Explotación en Coldcard desata migración de Bitcoin, consolidación 'alcista' de cripto: Resumen del Hodler, 2 de agosto

Tras el drenaje de 90 millones de dólares en Bitcoin de usuarios de la billetera Coldcard, los pequeños "hodlers" buscaron refugio en exchanges centralizados. Las transferencias de menos de 1 BTC alcanzaron su máximo diario desde 2022, con 39.600 BTC movidos. Galaxy Research informó que los ataques al monedero hardware resultaron en pérdidas estimadas de 1.367 BTC (88,6 millones de dólares). Se insta a los usuarios a mover fondos de direcciones generadas por Coldcard debido a un fallo en la generación de semillas. Mientras tanto, el reloj de la "Clarity Act" se agota en EE.UU., con desacuerdos sobre su aplicación y los beneficios en cripto de Trump. Los informes de ganancias del segundo trimestre muestran pérdidas para Coinbase y Strategy, aunque Robinhood registró récords a pesar del descenso en ingresos por cripto. Un analista de ARK Invest señala que la industria entra en su mayor fase de consolidación, con el 80% de los ingresos concentrados en pocos protocolos, lo que considera "extremadamente alcista". La Copa del Mundo 2026 generó 20.000 millones de dólares en volumen de mercados de predicción blockchain. En cuanto a precios, Bitcoin y Ether cayeron alrededor de un 3% esta semana. Grayscale sugiere que Bitcoin pudo haber tocado fondo antes de lo habitual en su ciclo. Otras noticias incluyen: Rusia y Australia persiguen al fundador de Telegram; Pump.fun despidió empleados antes de que recibieran tokens valiosos; y un exoperador de teleprompter de Trump es acusado de usar información privilegiada para apostar.

cointelegraphHace 1 hora(s)

Explotación en Coldcard desata migración de Bitcoin, consolidación 'alcista' de cripto: Resumen del Hodler, 2 de agosto

cointelegraphHace 1 hora(s)

Trading

Spot
活动图片