Anchored, But Under Strain

insights.glassnodePublicado a 2025-12-10Actualizado a 2025-12-10

Resumen

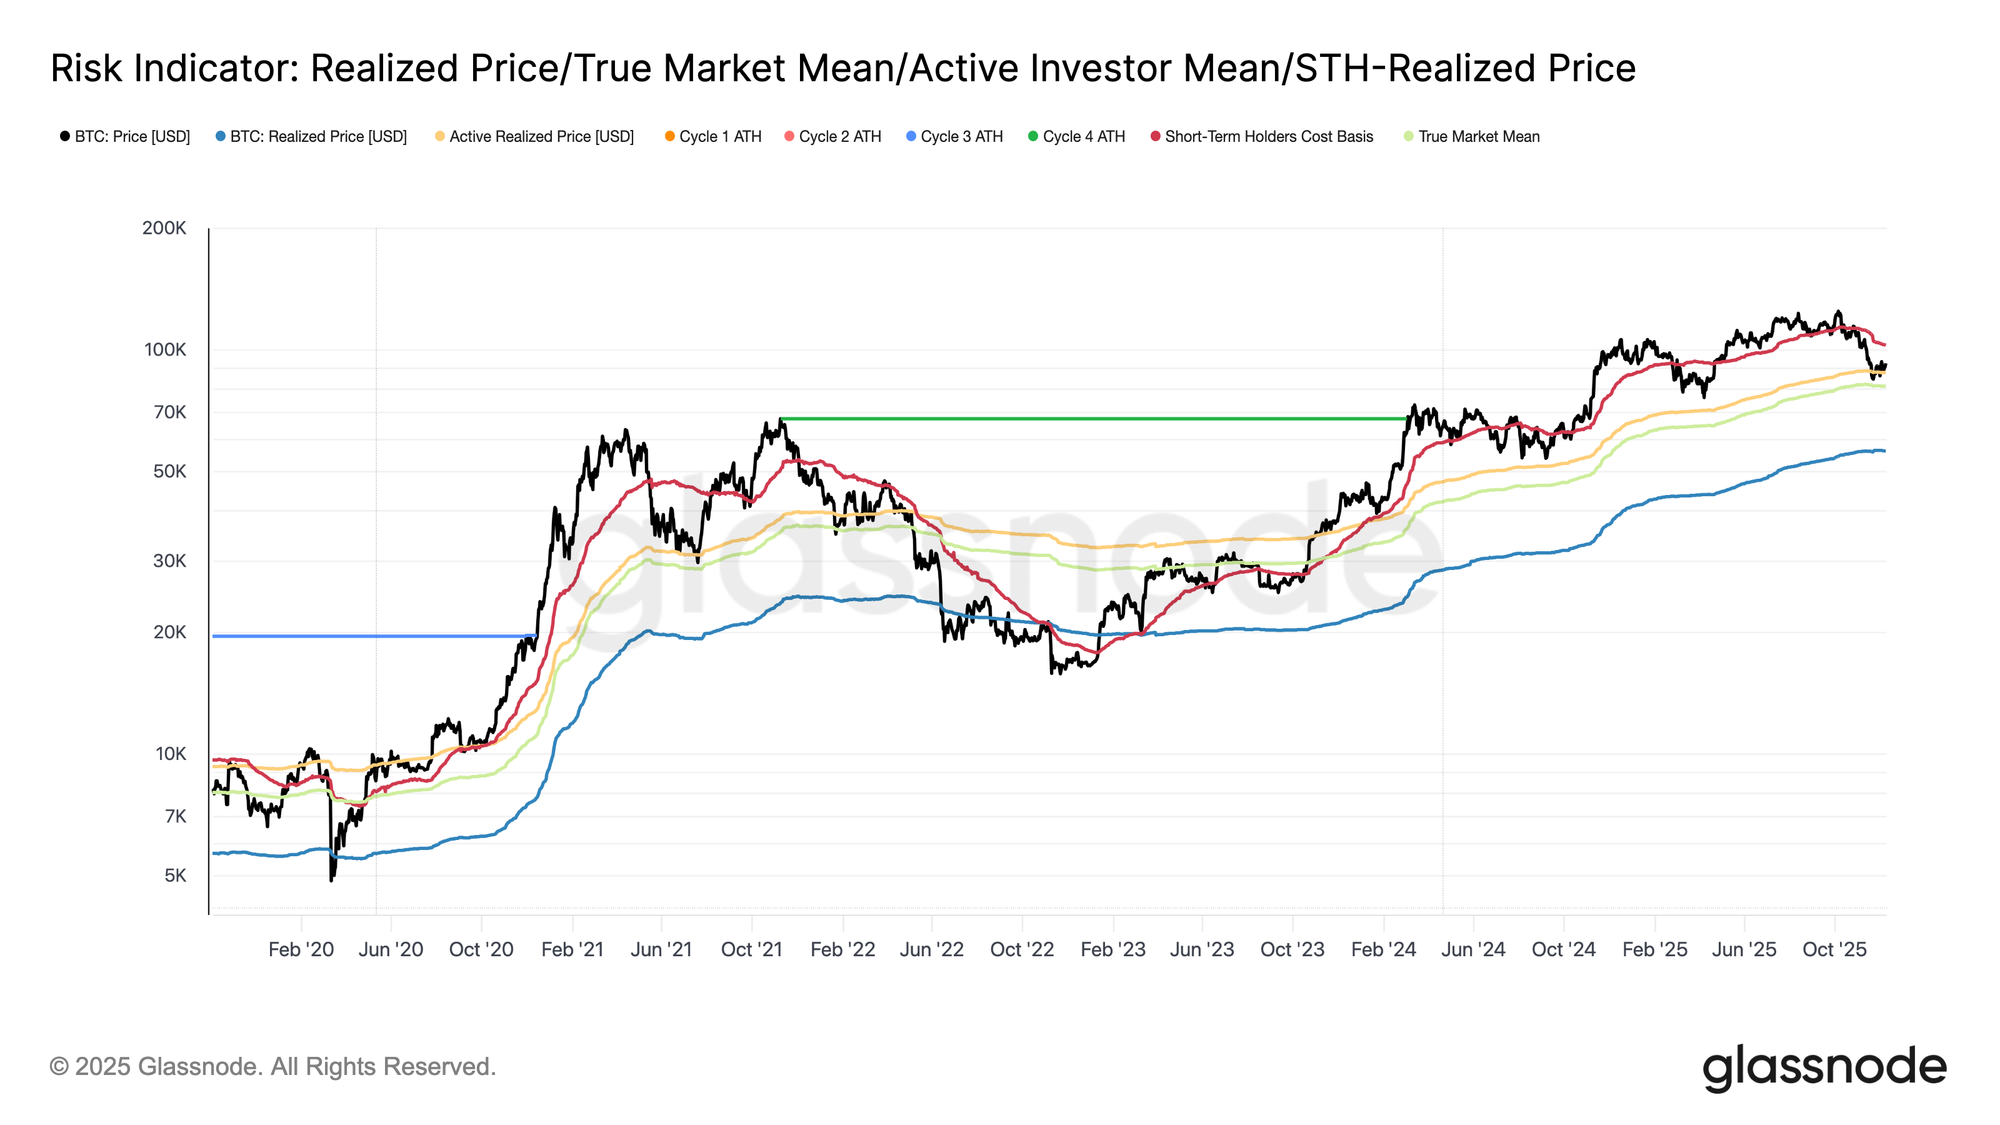
Bitcoin remains structurally fragile, trading between the STH-Cost Basis at $102.7k and the True Market Mean at $81.3k. On-chain conditions are weakening, with rising unrealized and realized losses, alongside elevated selling from long-term holders. Despite some demand absorbing this pressure, reclaiming key levels like the 0.75 cost-basis quantile ($95k) is crucial for a bullish reversal. Off-chain activity reflects caution: ETF flows are negative, spot and futures liquidity are subdued, and options markets show heightened demand for short-term downside protection ahead of the FOMC meeting. Traders are accumulating volatility, anticipating a near-term move. Post-FOMC, volatility may compress, but the market remains range-bound, balancing persistent sell pressure against patient demand.

Bitcoin enters the week still confined within a structurally fragile range, bounded by the STH-Cost Basis at $102.7k and the True Market Mean at $81.3k. Last week, we underscored weakening on-chain conditions, thinning demand, and a cautious derivatives landscape that collectively echo the early-2022 setup.

Although price has held marginally above the True Market Mean, unrealized losses continue to expand, realized losses are rising, and spending by long-term investors remains elevated. The key upper thresholds to reclaim are the 0.75 cost-basis quantile at $95k, followed by the STH-Cost Basis. Until then, the True Market Mean remains the most probable bottom-formation zone, barring a new macro shock.
Live Chart

Time Works Against the Bulls

Remaining in a mild bearish phase reflects the tension between modest capital inflows and persistent sell pressure from top buyers. As the market holds within a weak but bounded range, time becomes a negative force, making unrealized losses harder for investors to endure and increasing the likelihood of loss realization.

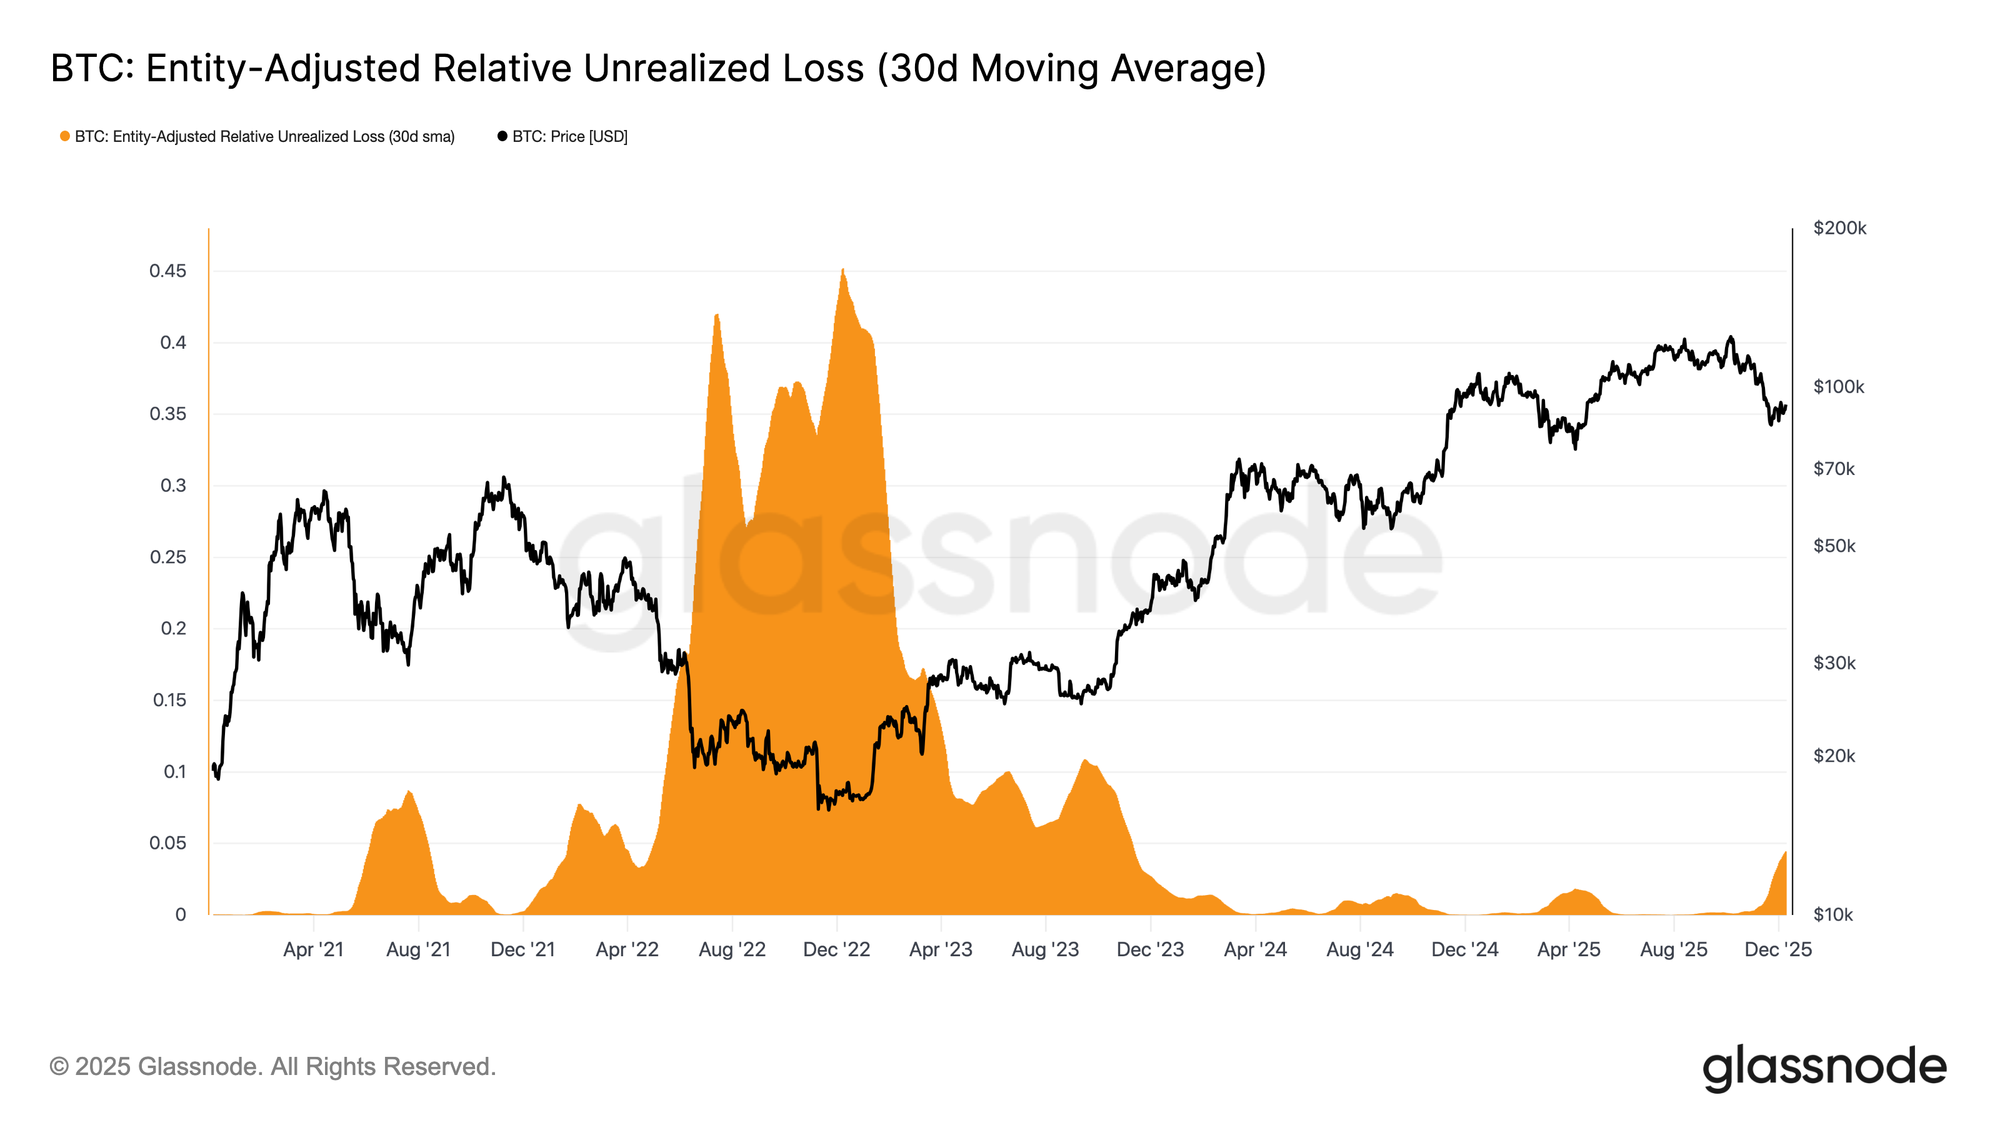
The Relative Unrealized Loss (30D-SMA) has climbed to 4.4% after nearly two years below 2%, marking a shift from a euphoric phase to one of elevated stress and uncertainty. This hesitation now defines the range, and resolving it will require a renewed wave of liquidity and demand to rebuild confidence.
Live Chart

Losses Rising

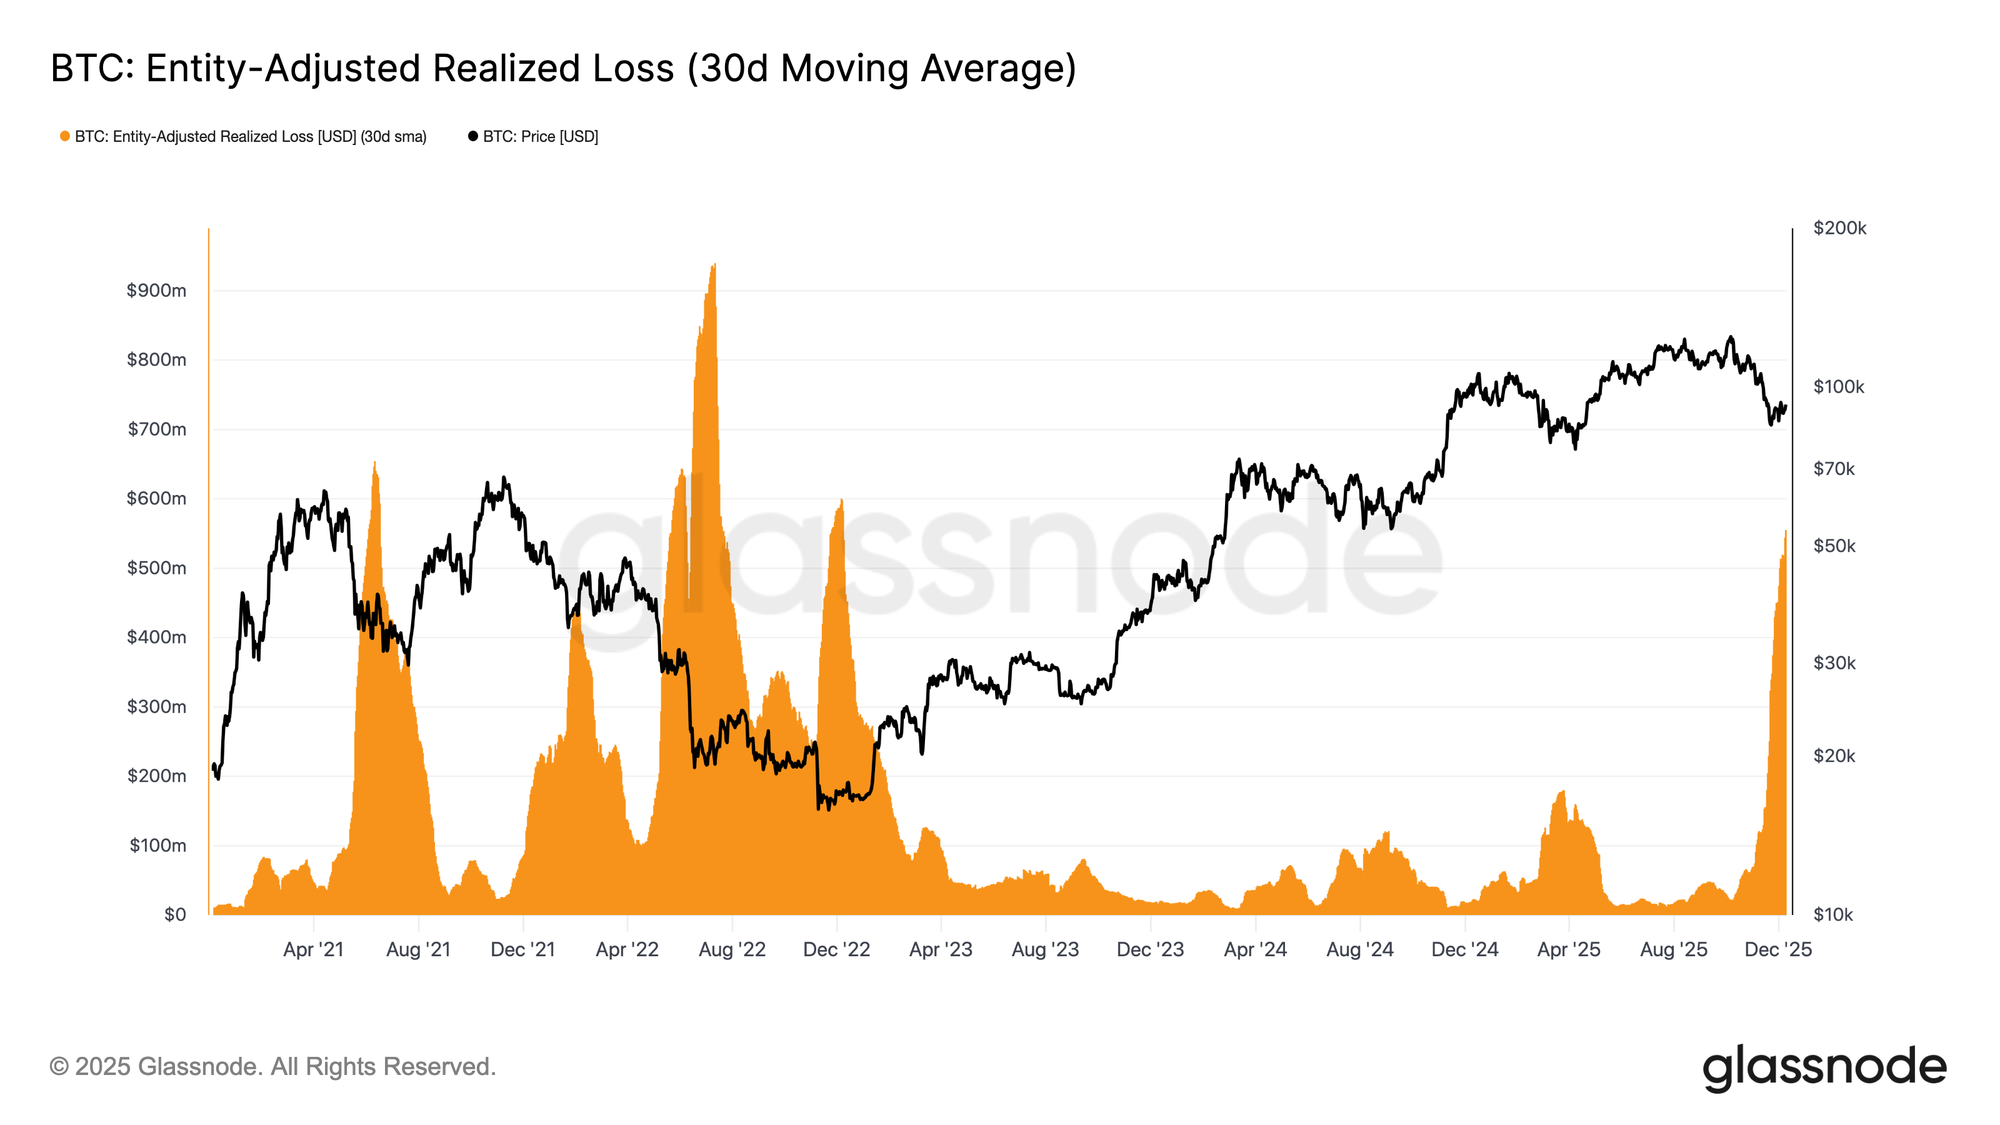
This time-driven pressure is further evident in spending behavior. Even as Bitcoin has rebounded from the November 22 low to roughly $92.7k, the 30D-SMA Entity-Adjusted Realized Loss has continued climbing, reaching $555 million per day, the highest level since the FTX collapse.

Such elevated loss realization during a moderate price recovery reflects mounting frustration among top buyers who are capitulating into strength rather than holding through the rebound.
Live Chart

Holding Back the Reversal

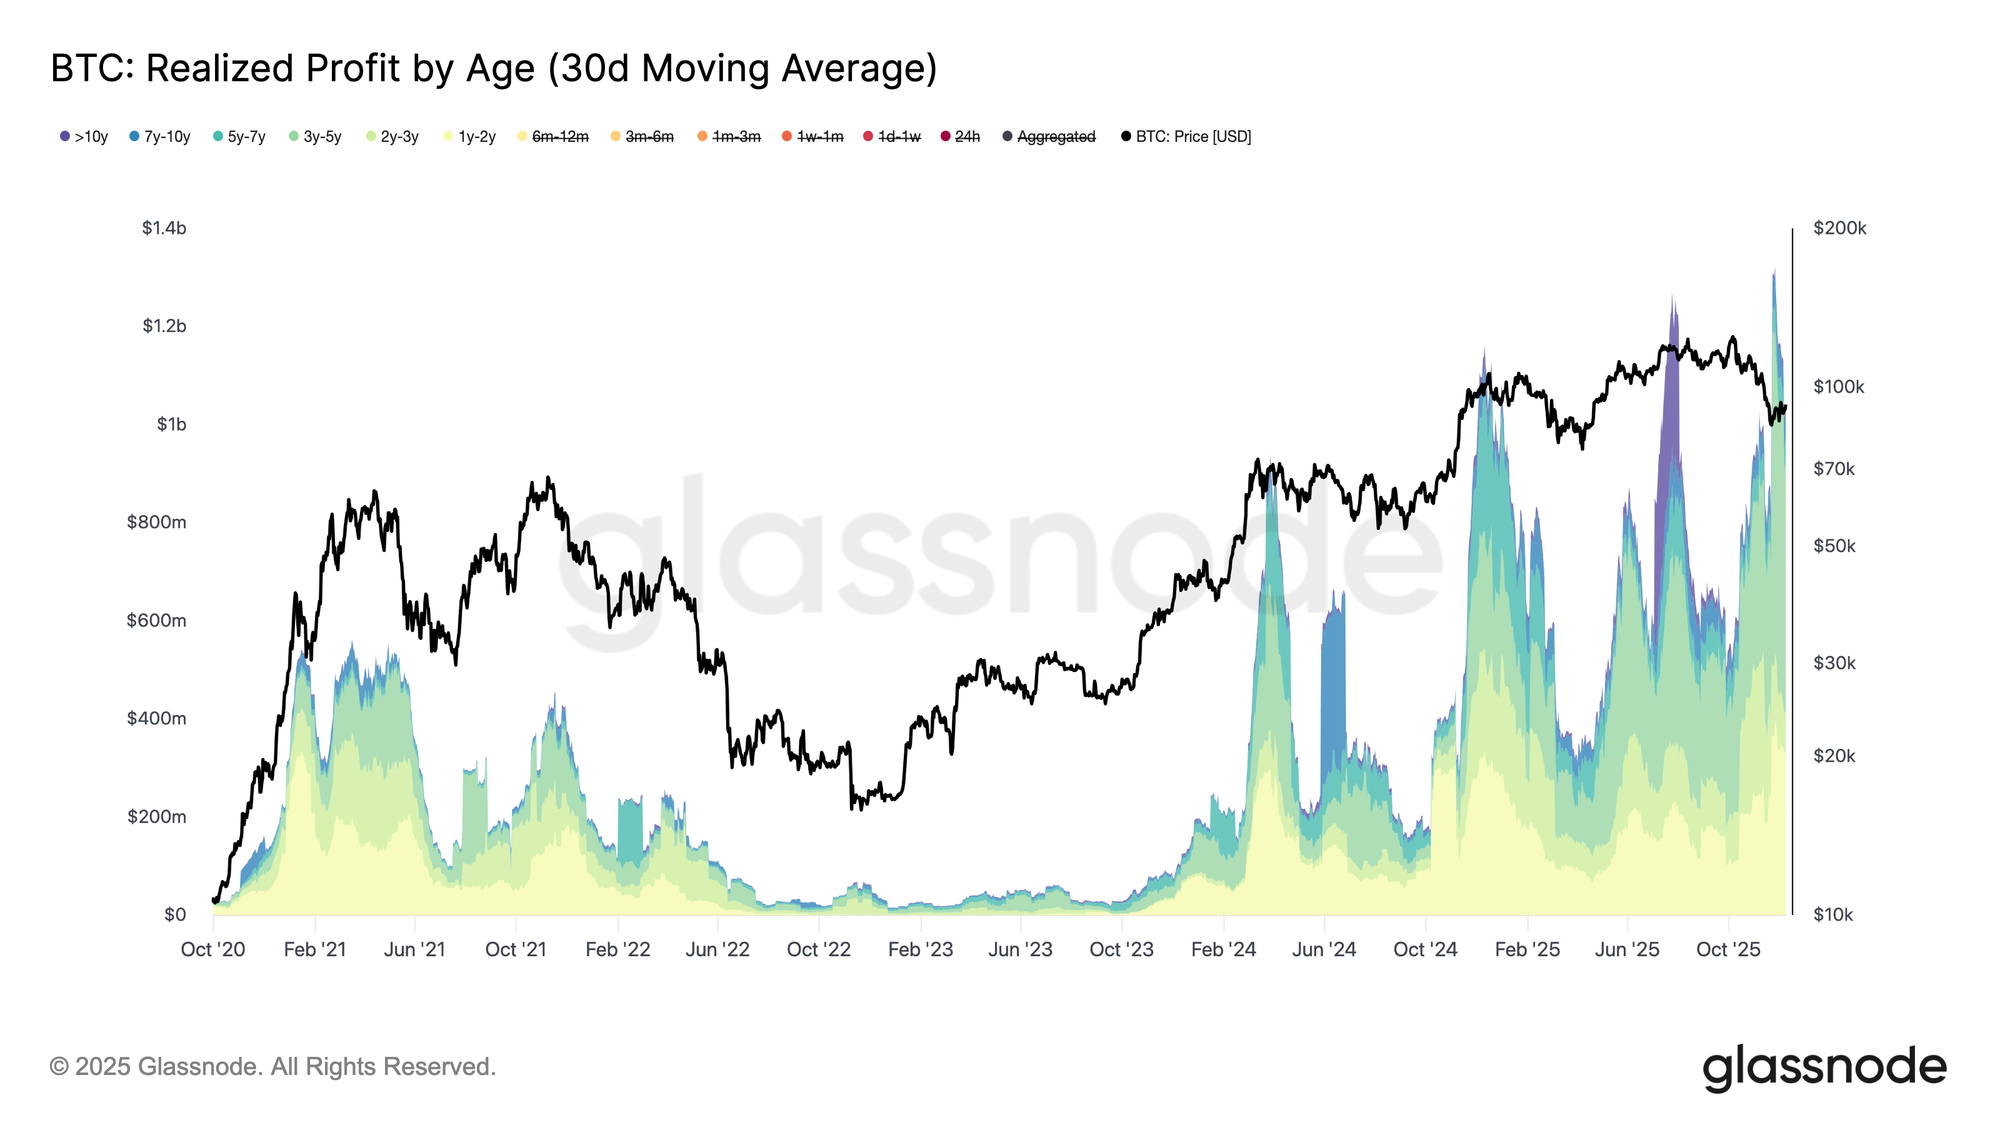
Rising realized losses are further anchoring the recovery, especially as they coincide with a surge in realized profit from seasoned investors. During the recent bounce, >1-year holders increased their realized profit (30D-SMA) above $1B per day, peaking at a new ATH of over $1.3B. Together, these two forces—time-driven capitulation by top buyers and heavy profit-taking by long-term holders ,explain why the market continues to struggle reclaiming the STH-Cost Basis.

Yet, despite this significant sell pressure, price has stabilized and even slightly recovered above the True Market Mean, signalling persistent and patient demand absorbing distribution. In the short term, if seller exhaustion begins to emerge, this underlying buy pressure could drive a retest of the 0.75 quantile (~$95k) and potentially the STH-Cost Basis.
Live Chart

Off-Chain Insights

ETF Woes

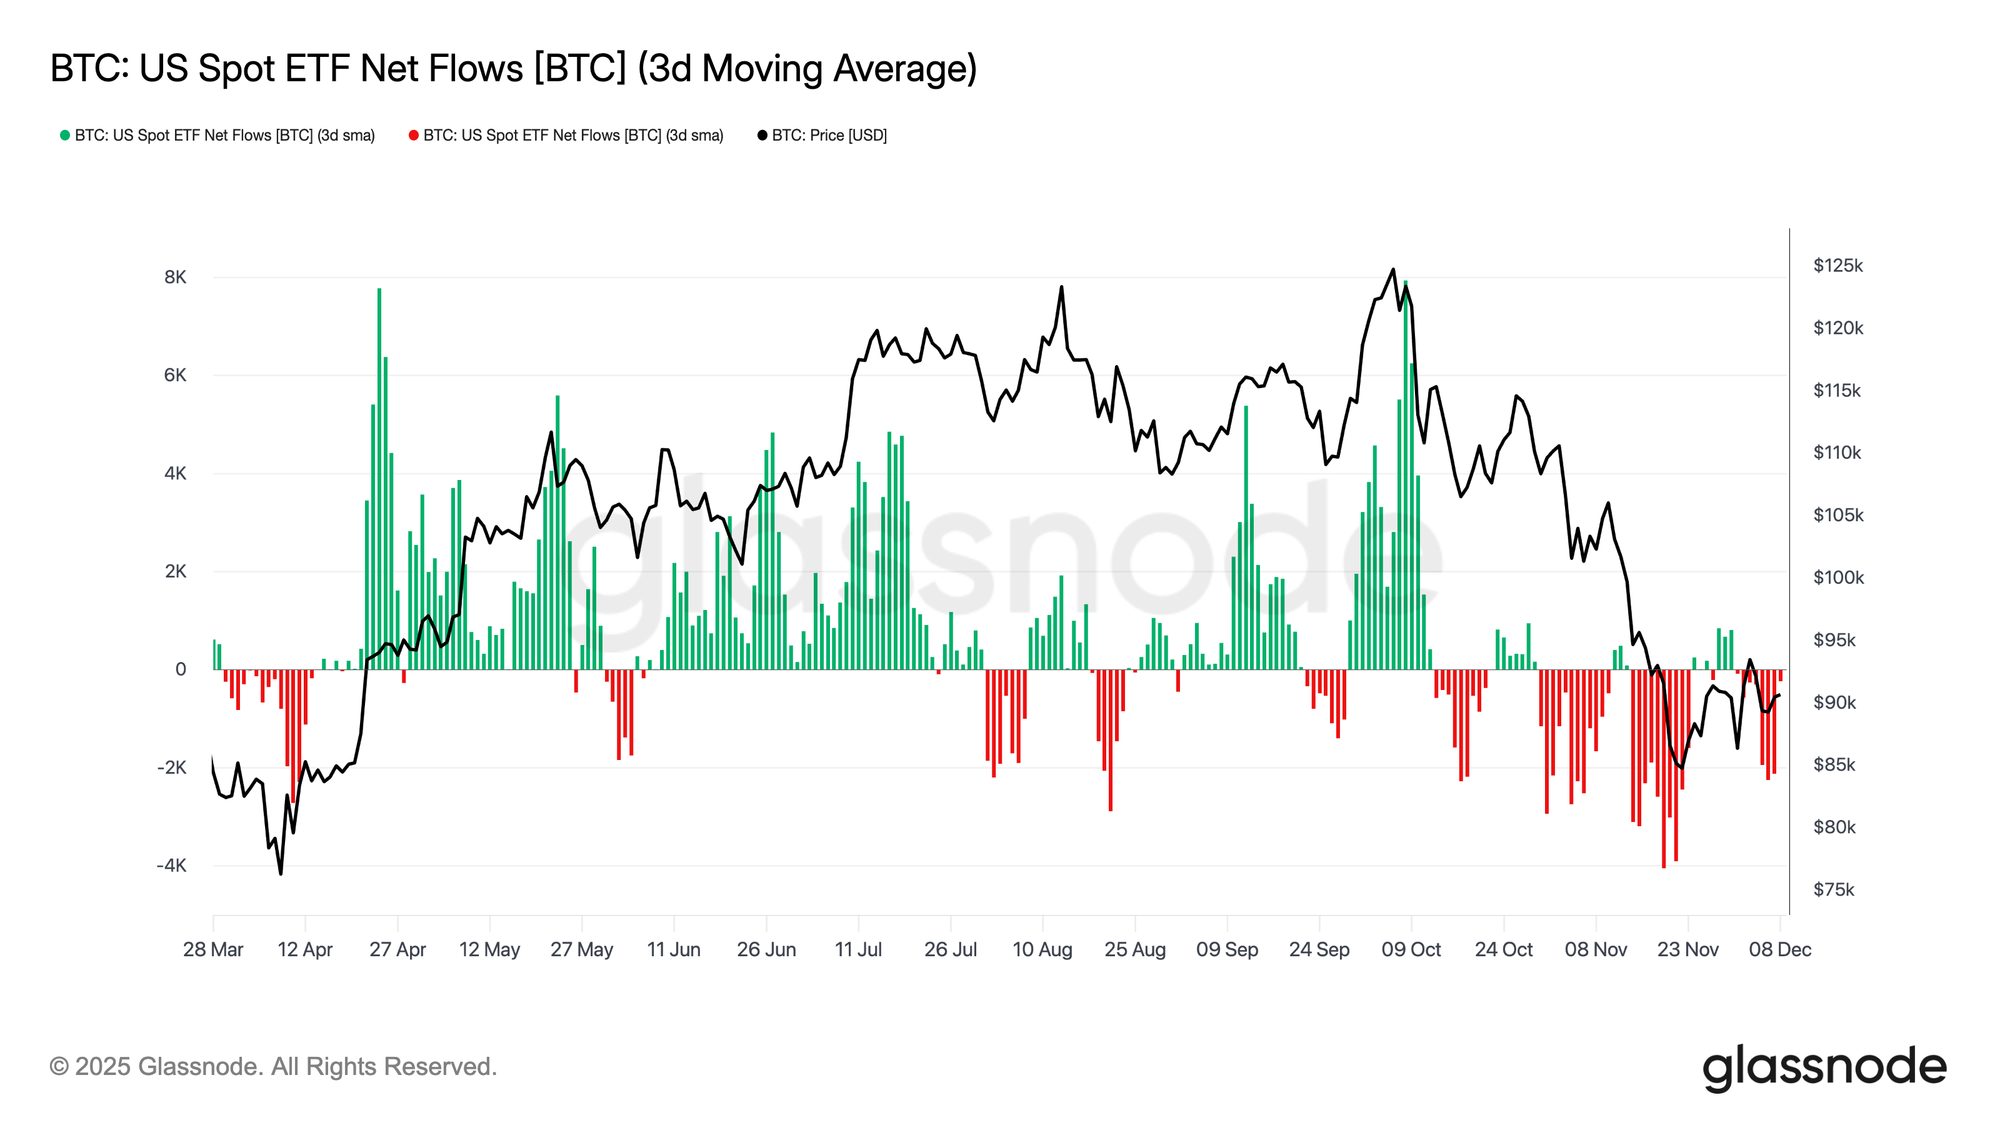
Turning to spot markets, US Bitcoin ETFs logged another quiet week, with the 3-day average of net flows remaining consistently below zero. This extends the cooling trend that began in late November and marks a clear departure from the robust inflow regime that supported price appreciation earlier in the year. Redemptions have been steady across several major issuers, underscoring a more risk-averse stance among institutional allocators as broader market conditions remain unsettled.

As a result, the spot market is operating with a thinner demand buffer, reducing immediate buy-side support and leaving price more vulnerable to macro catalysts and volatility shocks.
Live Chart

Liquidity Remains Subdued

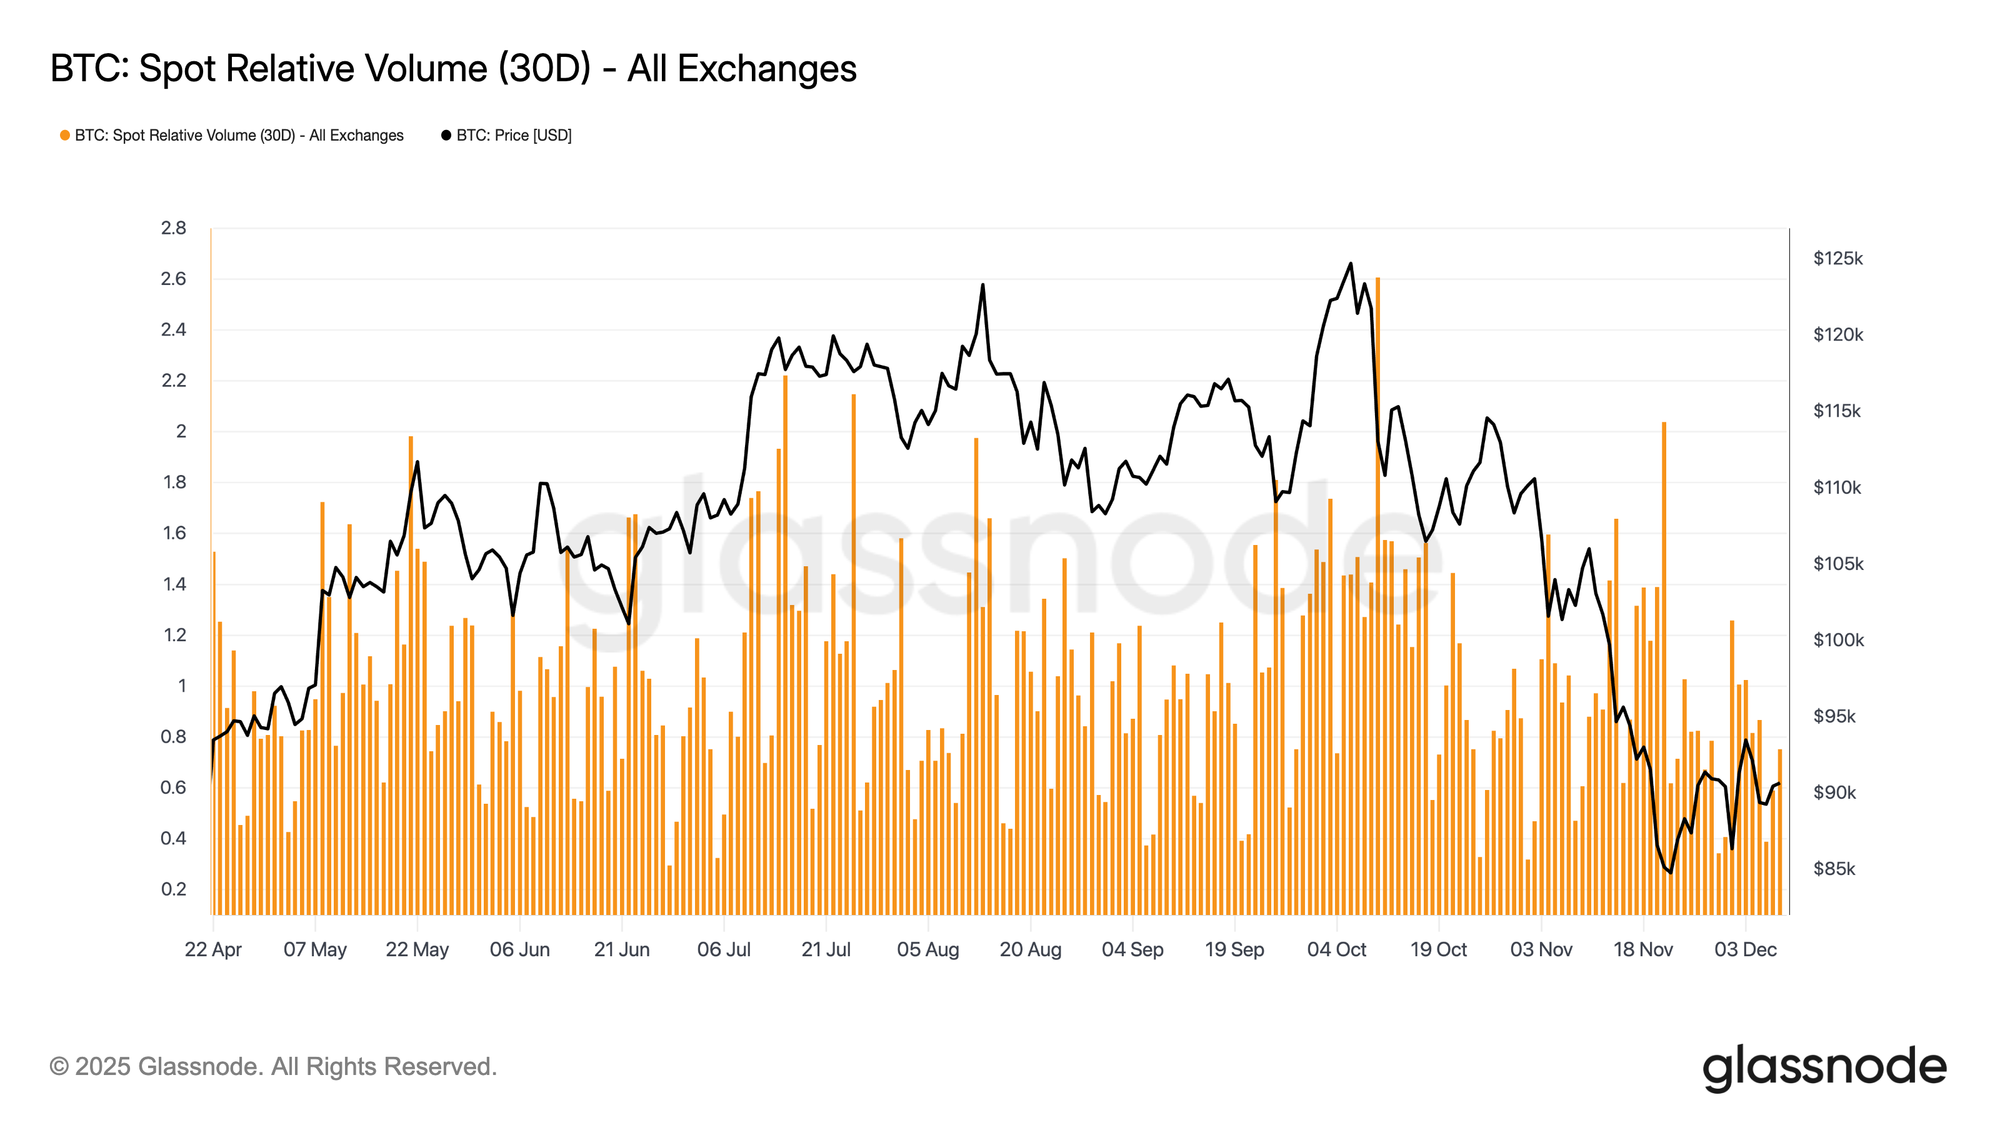
In parallel with softer ETF flows, Bitcoin’s spot relative volume continues to sit near the lower bound of its 30-day range. Trading activity has weakened through November and into December, mirroring the price decline and signalling a retreat in market participation. The contraction in volume reflects a more defensive positioning across the board, with fewer liquidity-driven flows available to absorb volatility or sustain directional moves.

With spot markets running quieter, attention now turns to the upcoming FOMC meeting, which could act as a catalyst for renewed participation depending on the policy tone.
Live Chart

Futures Ghost Town

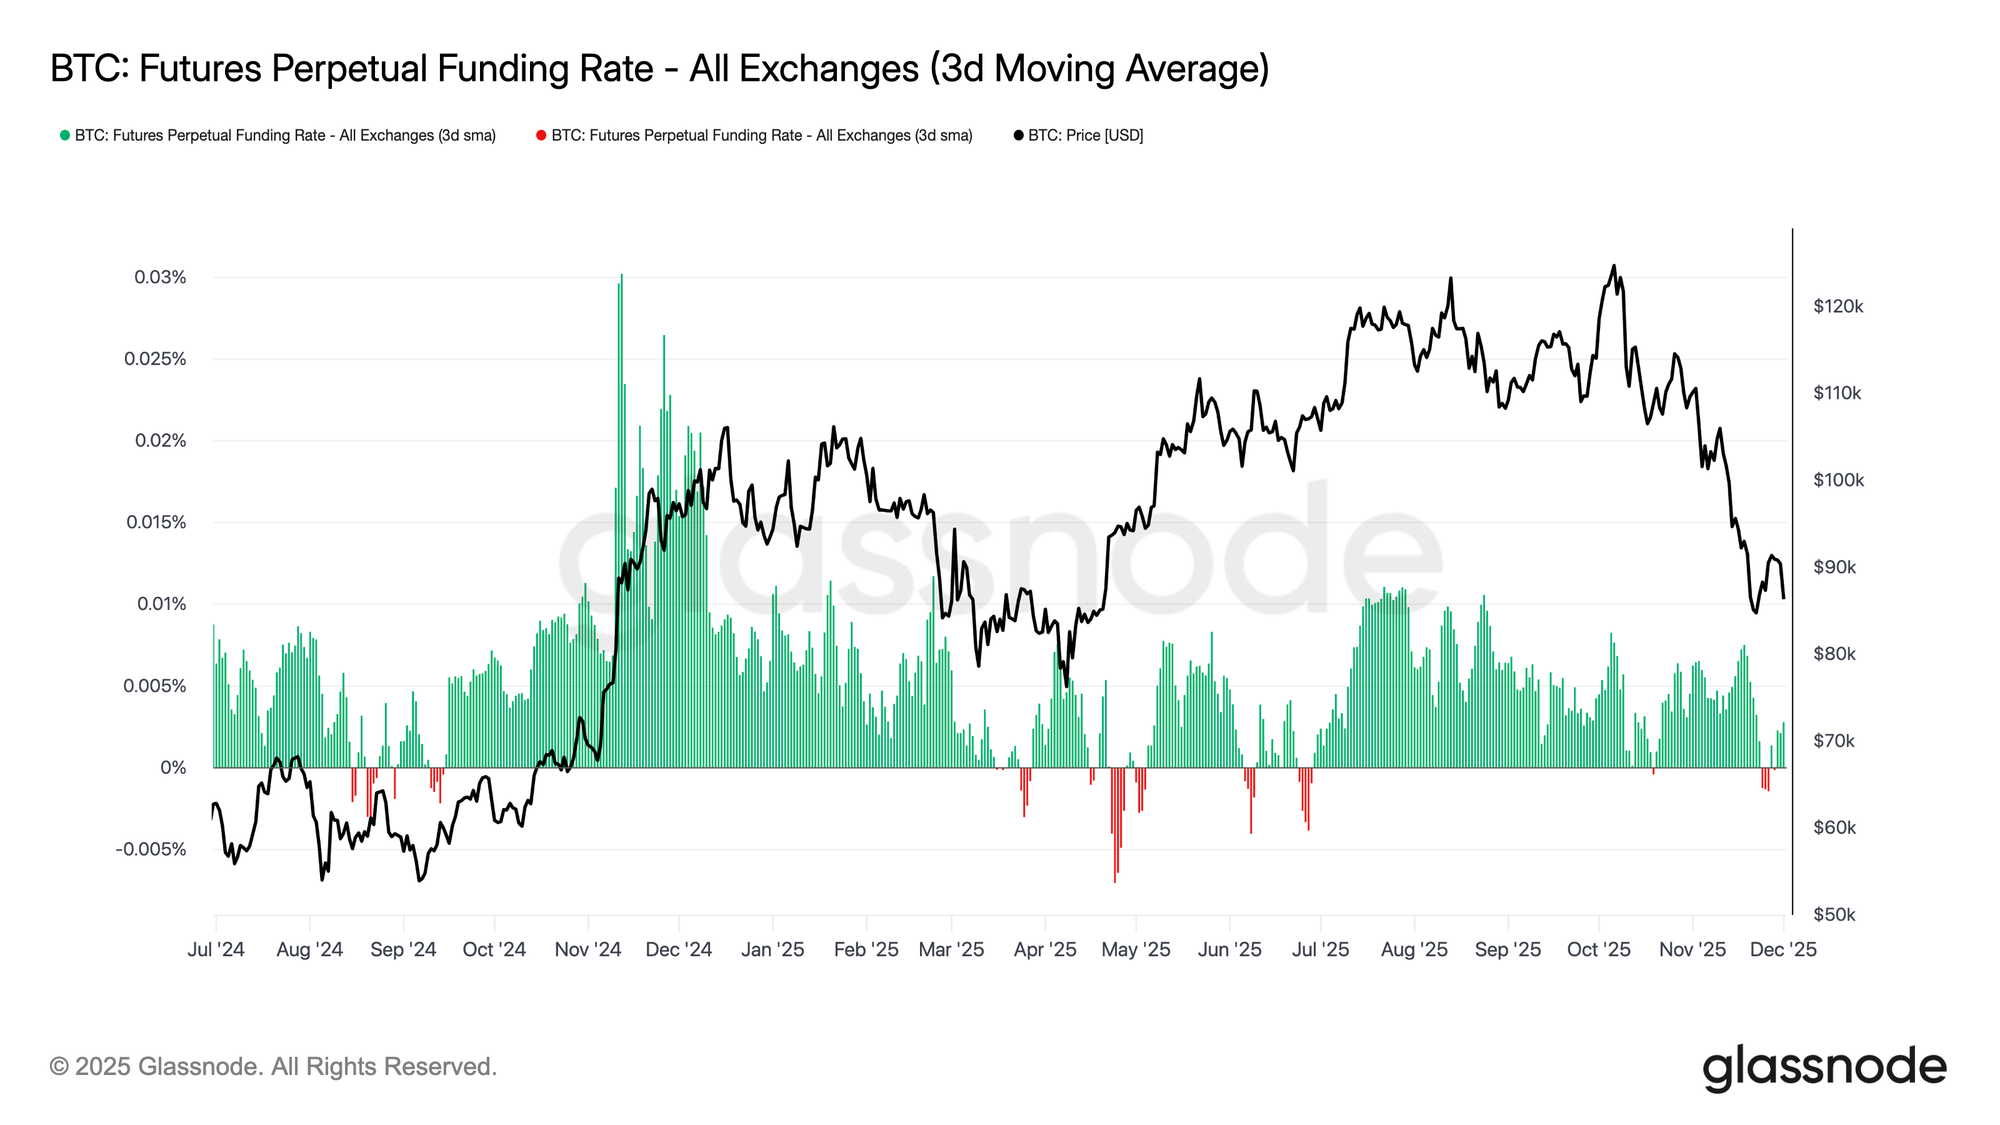
Extending this theme of muted participation, futures markets also show limited appetite for leverage, with Open Interest failing to meaningfully rebuild and funding rates pinned near neutral. These dynamics highlight a derivatives environment defined more by caution than conviction.

Across perpetual markets, funding hovered around zero to slightly negative during the week, underscoring the continued retreat in speculative long positioning. Traders remain balanced or defensive, contributing little directional pressure via leverage.

With derivatives activity subdued, price discovery tilts more heavily toward spot flows and macro catalysts rather than speculative expansion.
Live Chart

IV Pops at the Front End

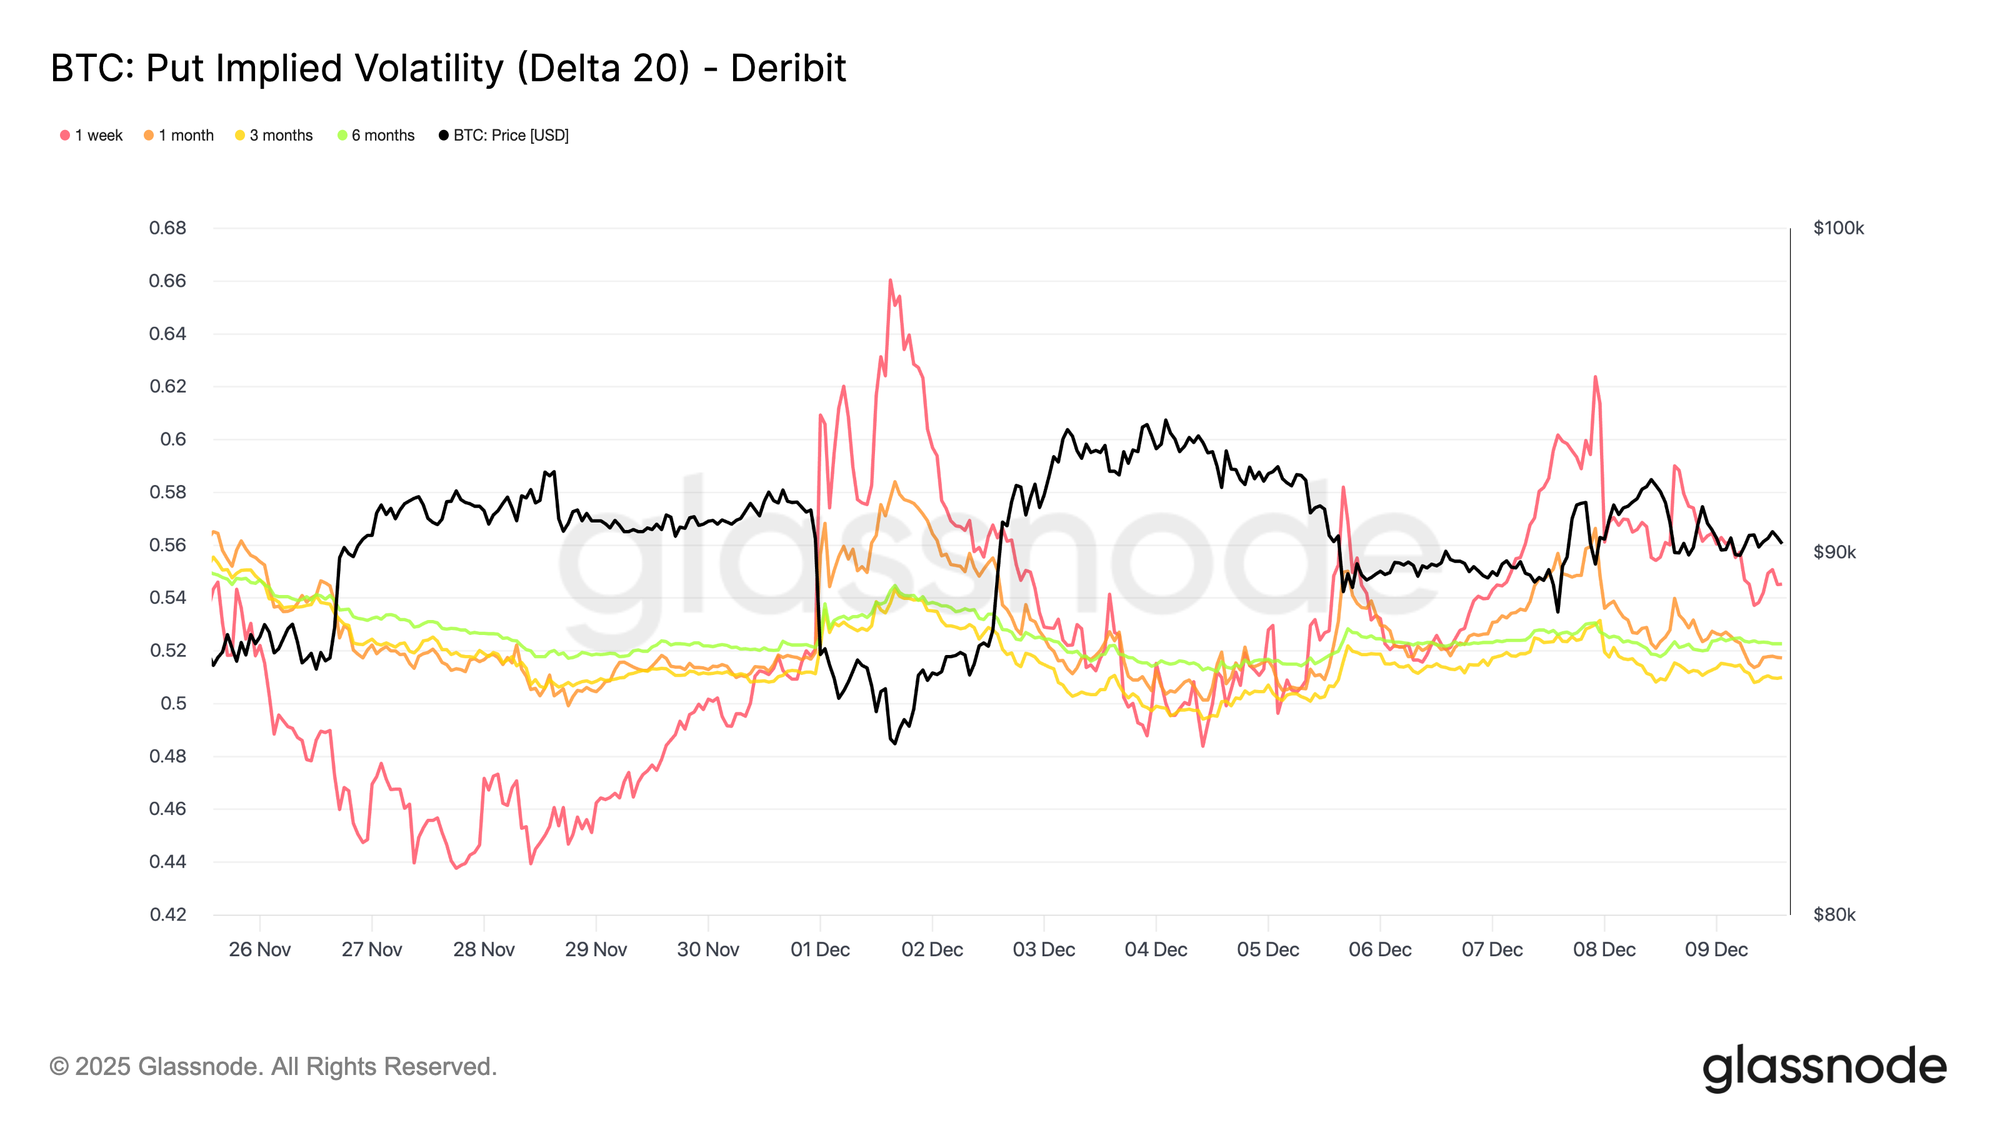
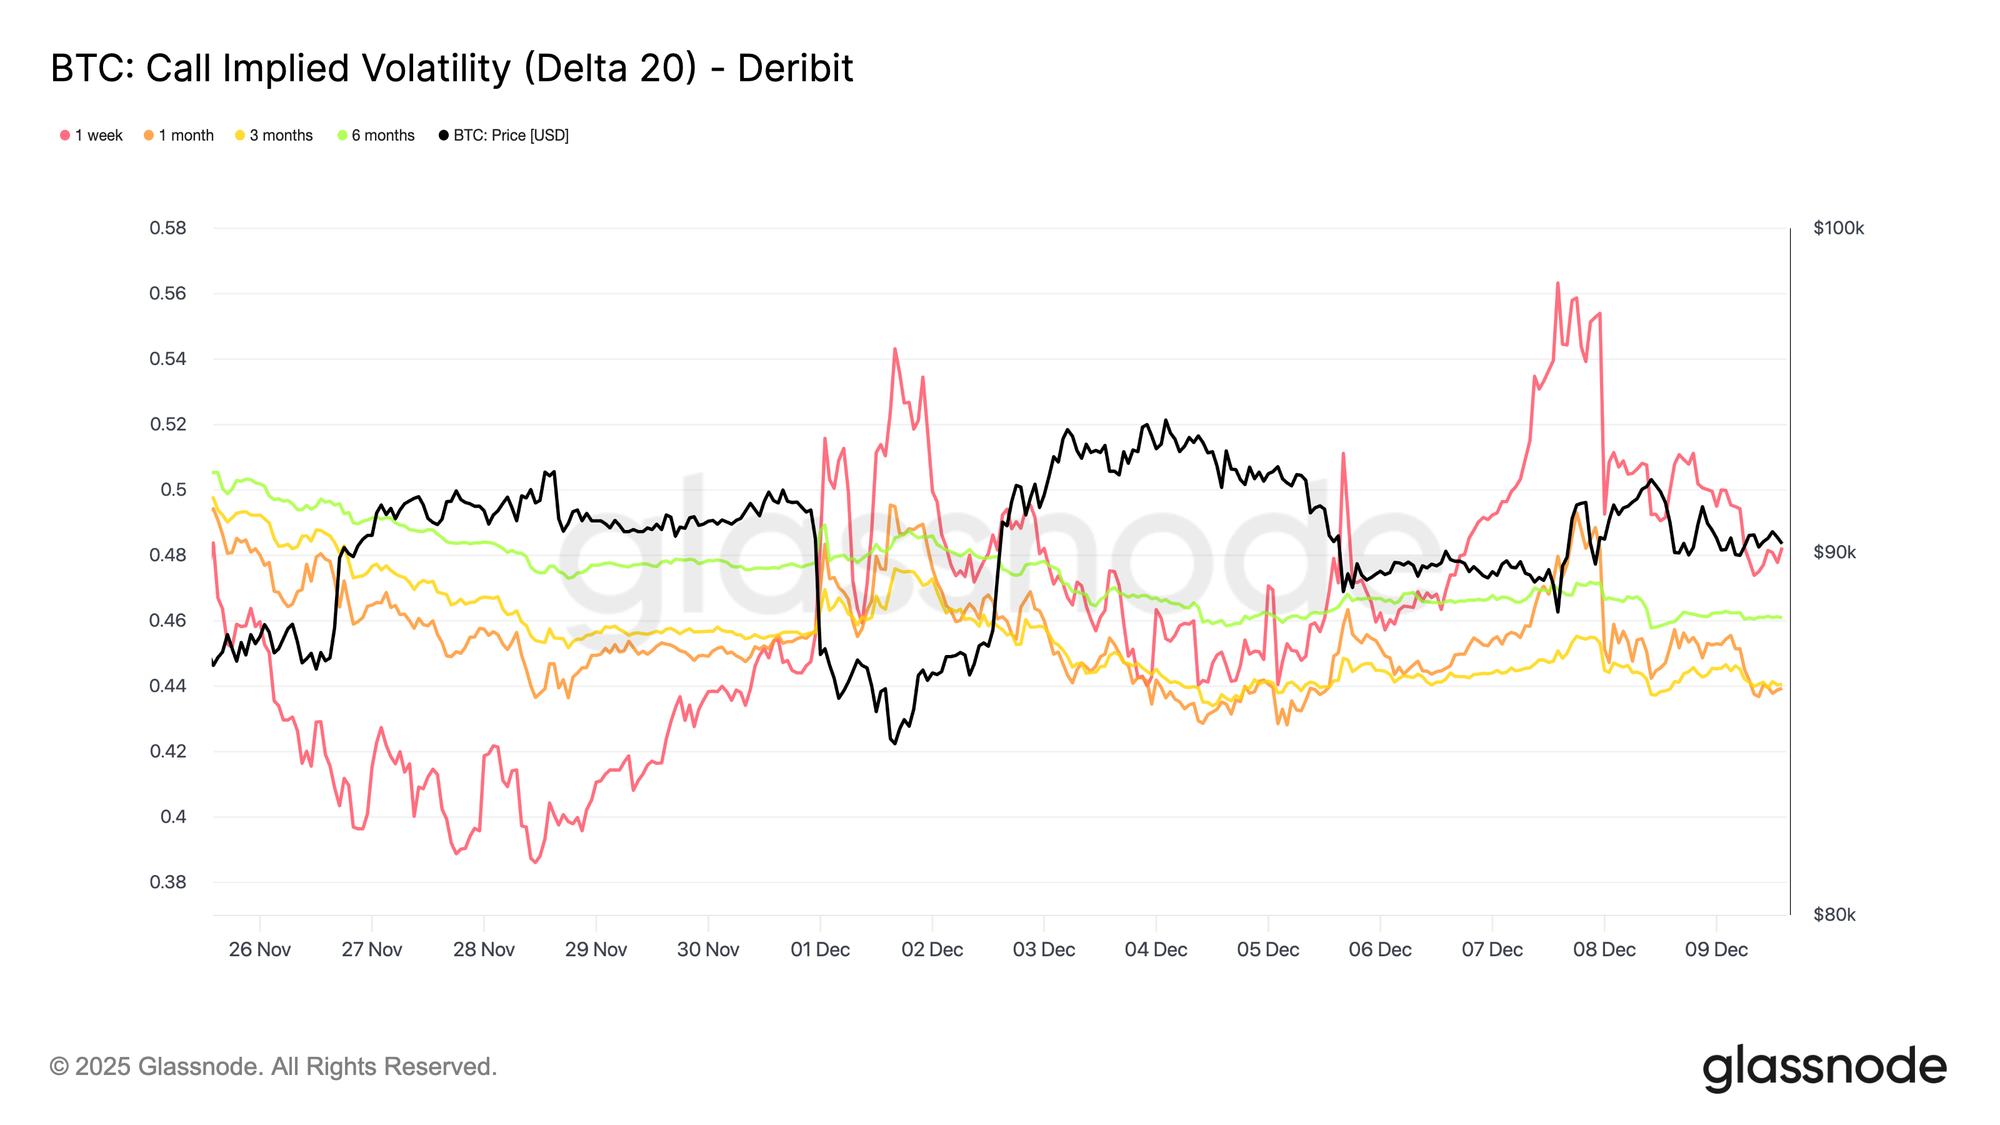
Turning to the options market, Bitcoin’s muted spot action contrasts sharply with a sudden rise in short-dated implied volatility, as traders position for a larger move. Interpolated Implied Volatility, which estimates IV at fixed deltas rather than relying on listed strikes, reveals a clearer structure of how risk is being priced across maturities.

On the 20-Delta CALL, the one-week tenor jumped by roughly ten vol points from last week, while longer maturities stayed relatively flat. The same pattern appears on the 20-Delta PUT, with short-dated downside IV lifting as longer expiries remain quiet.

Overall, traders are accumulating volatility precisely where they expect stress, preferring to own convexity rather than fade it ahead of the December 10 FOMC meeting.
Live Chart
Live Chart

Downside Demand Returns

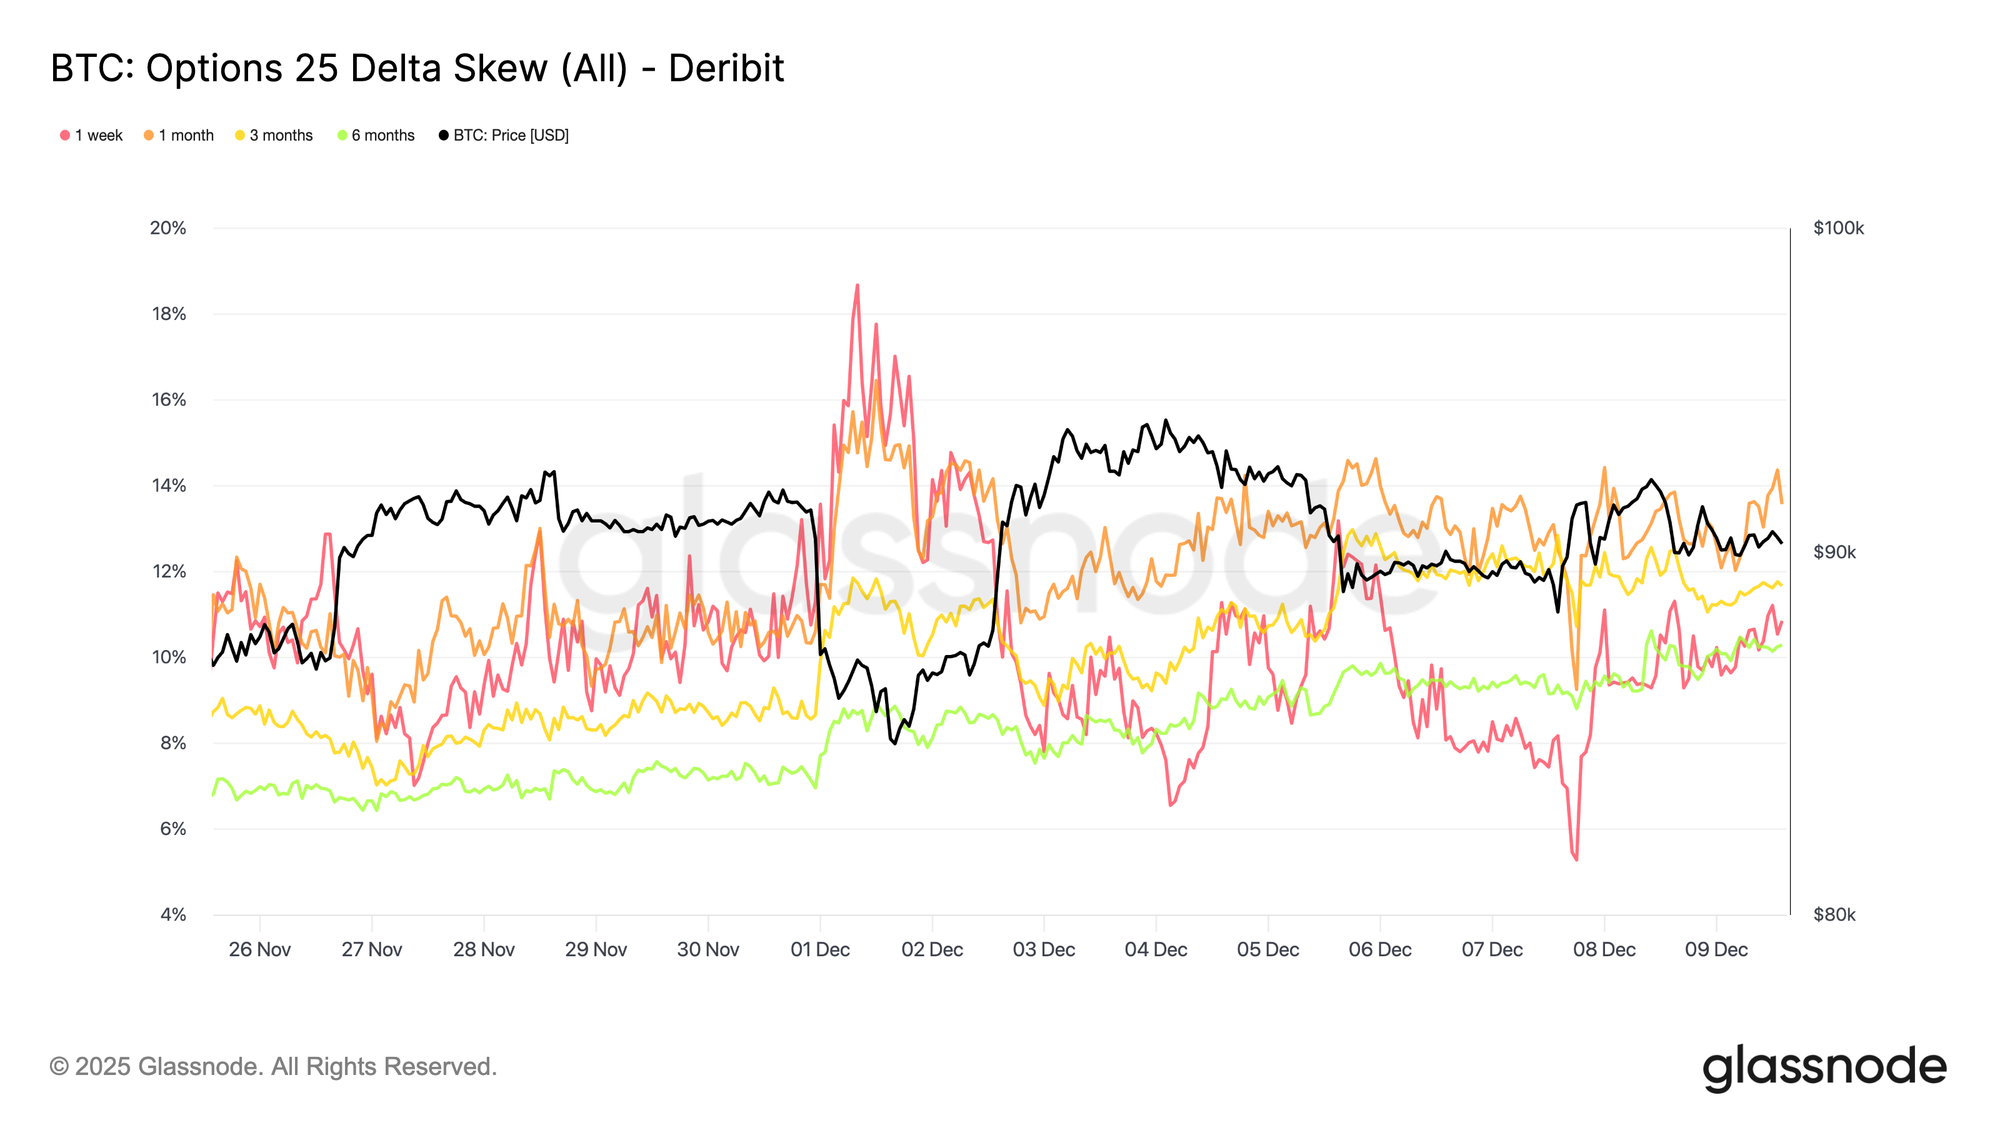
Complementing the rise in front-end volatility, downside protection is once again commanding a premium. The 25-delta skew, which measures the relative cost of puts versus calls at the same delta, has climbed to roughly 11 percent in the one-week tenor, indicating a clear pickup in demand for short-dated downside insurance ahead of the FOMC meeting.

Skew remains tightly clustered across maturities, ranging from 10.3 percent to 13.6 percent. This compression suggests that the preference for put protection is broad-based across the curve, reflecting a consistent hedging bias rather than isolated stress confined to the front end.
Live Chart

Skew Index Shows a Different Tone

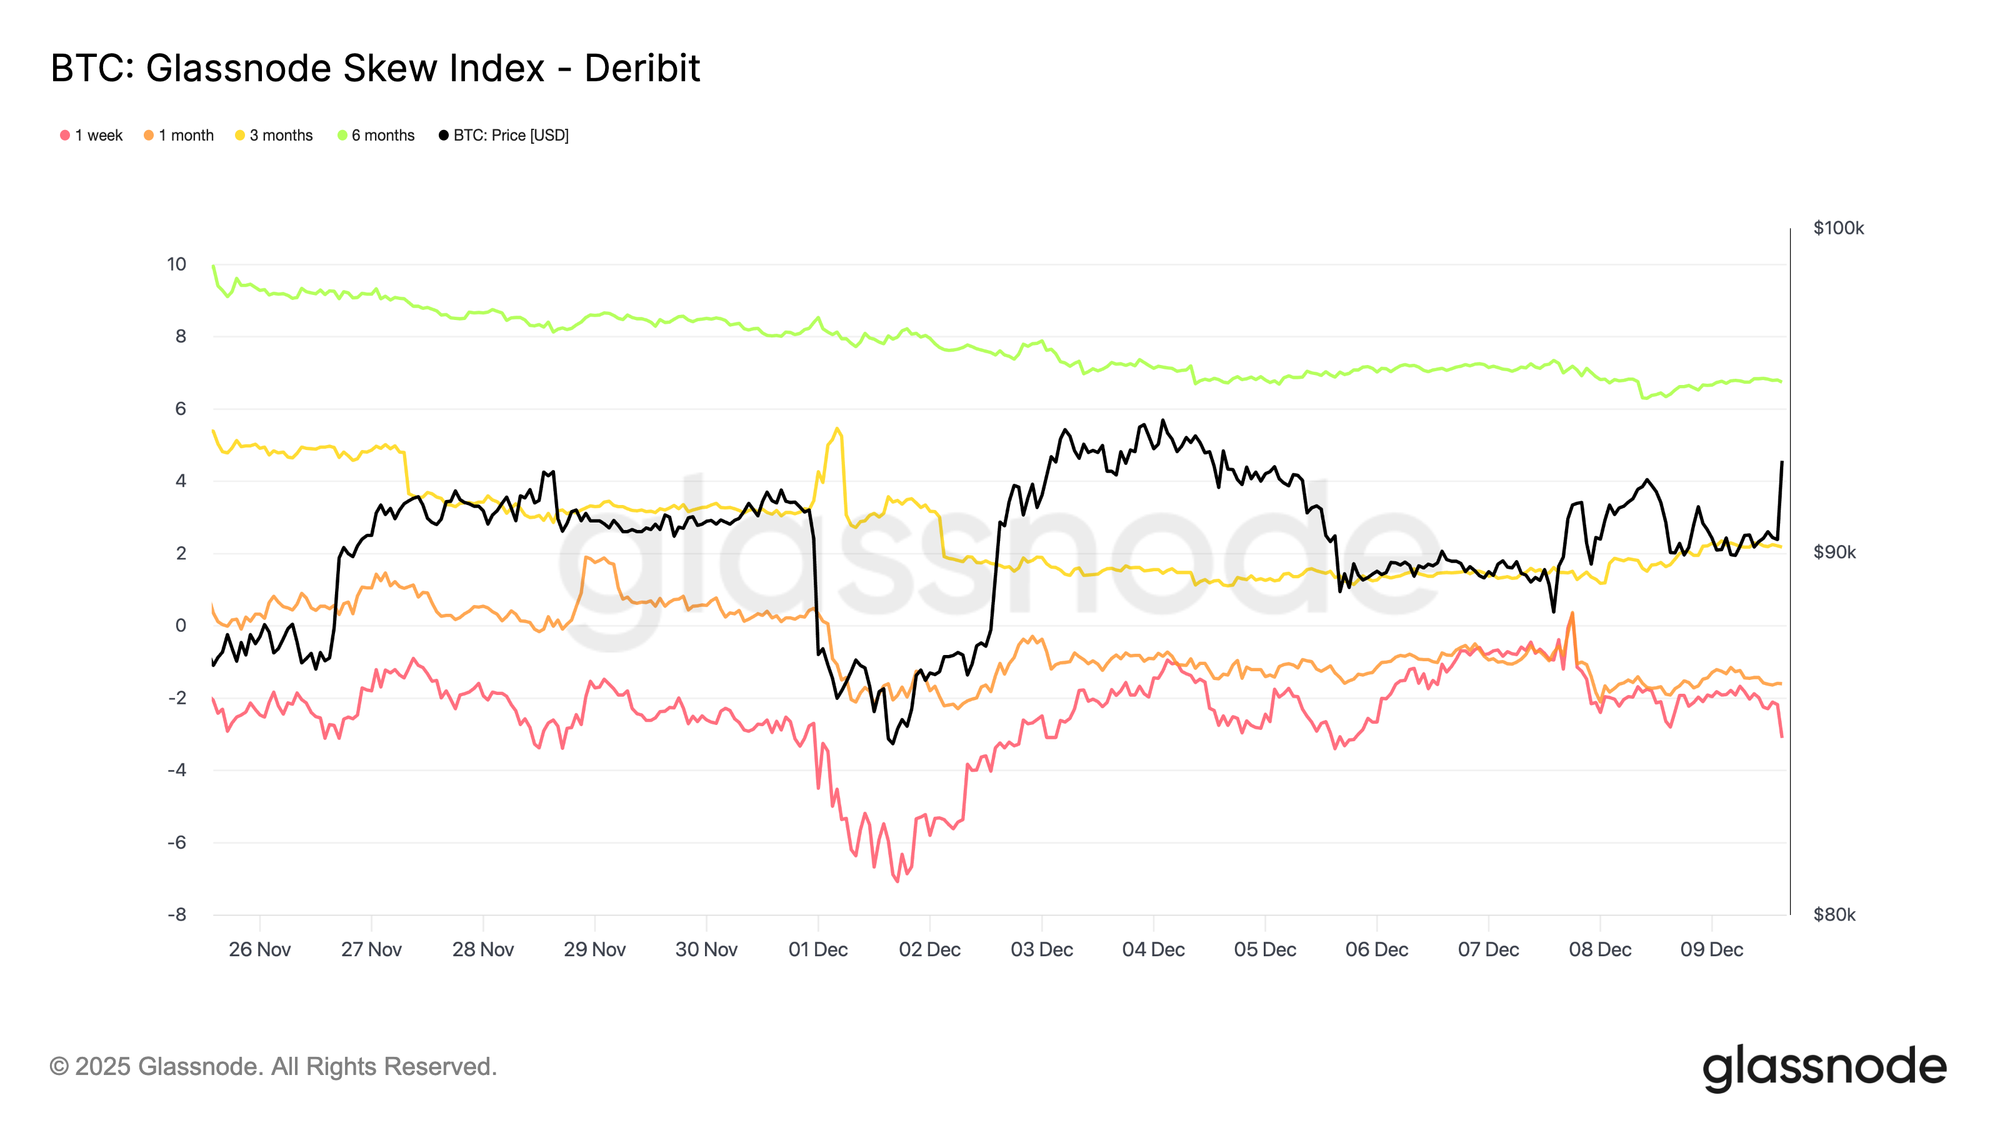
Adding another layer to the options picture, the skew index presents a more nuanced signal compared with the 25-delta skew. Because it is weighted toward low-delta options, it captures pricing across the full downside wing. The one-week and one-month readings sit in put territory, yet the three-month and six-month values, around 2.2 percent and 6.7 percent, fall into call territory, since the index is calculated as calls minus puts.

This creates a notable divergence: the 25-delta skew leans bearish across maturities, while the longer-dated skew index shows upside variance being priced more richly than downside. In essence, traders are not bidding deep OTM downside protection in the longer tenors, even though mid-delta puts remain supported. The surface therefore signals short-term caution, but a more balanced to mildly bullish tone further out the curve, a pattern typical in crypto where participants often hold far-OTM calls for asymmetric upside.
Live Chart

Volatility Accumulation

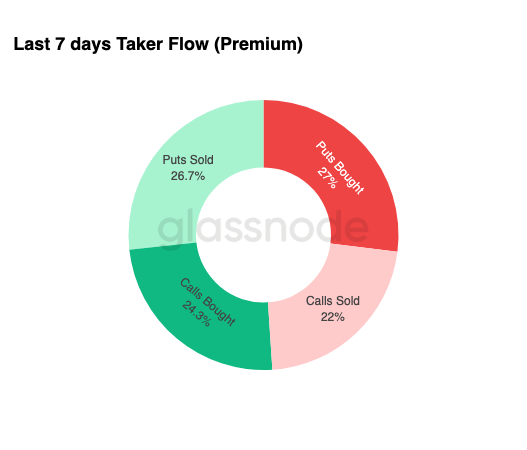
Rounding out the options landscape, weekly flow data reinforces a clear pattern: traders are buying volatility, not selling it. Premiums bought dominate total notional flow, with a slight lead from puts. This does not reflect a directional bias, but rather a regime of volatility accumulation. When traders purchase both wings, it signals hedging and convexity-seeking behaviour rather than sentiment-driven speculation.

Combined with rising implied volatility and a downside-leaning skew, the flow profile suggests that market participants are preparing for a volatility event with a bias toward the downside.
Live Chart

After FOMC

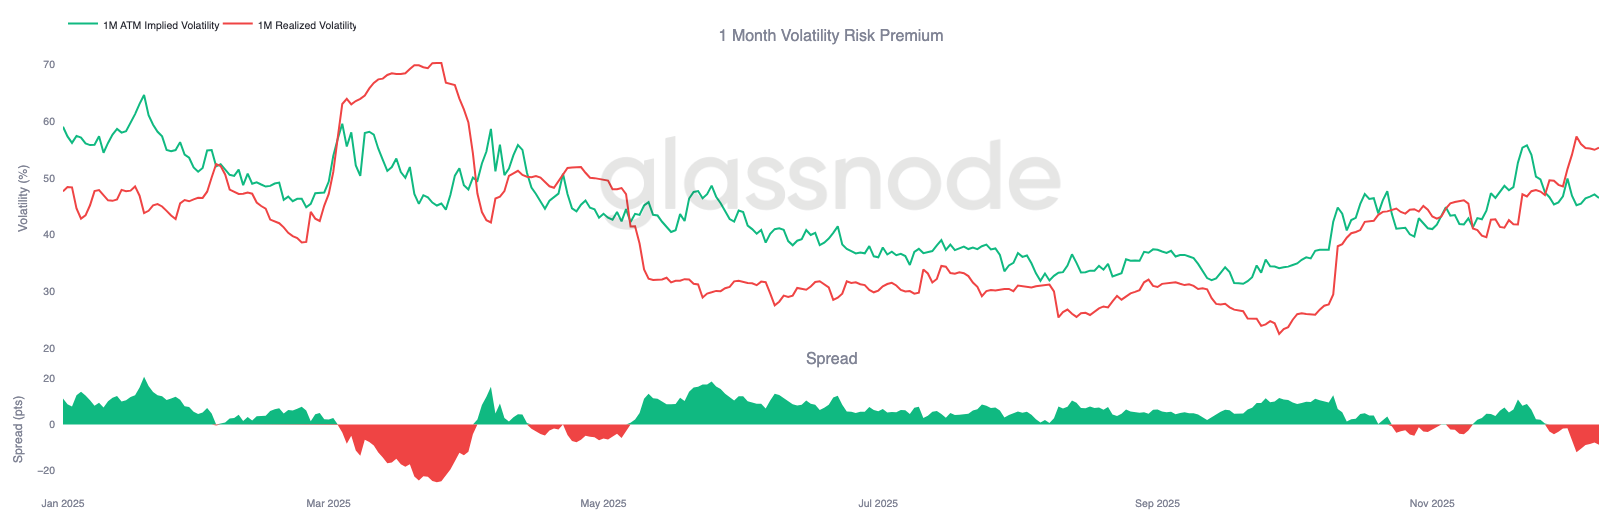
Looking ahead, implied volatility has already begun to ease, and historically, IV tends to compress further once the final major macro event of the year passes. With the December 10 FOMC meeting serving as the last meaningful catalyst, the market is preparing for a transition into a low-liquidity, mean-reverting environment.

After the announcement, gamma sellers typically re-enter, accelerating IV decay into year-end. Absent a hawkish surprise or a notable shift in guidance, the path of least resistance points toward lower implied volatility and a flatter surface through late December.
Live Chart

Conclusion

Bitcoin continues to trade within a structurally fragile environment where rising unrealized losses, elevated realized loss realization, and heavy profit-taking from long-term holders collectively anchor price action. Despite this persistent sell pressure, demand remains sufficiently resilient to keep price above the True Market Mean, suggesting patient buyers are still absorbing distribution. A short-term push toward the 0.75 quantile or even the STH Cost Basis remains possible if seller exhaustion begins to surface.

Off-chain conditions echo this cautious tone. ETF flows remain negative, spot liquidity is subdued, and futures markets lack speculative engagement. Options markets reinforce a defensive posture, with traders accumulating volatility, bidding short-dated downside protection, and positioning for a near-term volatility event ahead of the FOMC meeting.

Taken together, market structure suggests a weak but stable range, held up by patient demand yet constrained by persistent sell pressure. The short-term path hinges on whether liquidity improves and sellers relent, while the longer-term outlook depends on the market’s ability to reclaim key cost-basis thresholds and shift out of this time-driven, psychologically taxing phase.


Criptos en tendencia

Lecturas Relacionadas

Por qué 2026 podría redefinir a Ethereum, Solana, Base y Avalanche

A medida que avanza 2026, las principales cadenas de bloques como Ethereum, Solana, Base y Avalanche se encuentran en una transformación coordinada para satisfacer la creciente demanda institucional, en lugar de competir por la adopción minorista. Con más de 30.000 millones de dólares en activos del mundo real (RWA) en blockchains públicas, la prioridad se centra en el rendimiento, la velocidad de liquidación, el cumplimiento normativo y la fiabilidad. Ethereum lidera esta transición con su actualización Glamsterdam (prevista para el primer semestre de 2026), que aumentará los límites de gas e introducirá mejoras para ejecuciones paralelas. Solana, por su parte, rediseña su mecanismo de consenso con Alpenglow (lanzamiento previsto en el segundo semestre de 2026) para reducir el tiempo de finalización de 12,8 segundos a unos 100-150 ms y mejorar la fiabilidad. Base desarrolla Beryl (despliegue en Q3 2026), centrándose en la normativa y presentando un estándar de token B20 para activos regulados. Avalanche, tras su mejora Etna, despliega Octane (a lo largo de 2026) para aumentar la velocidad de las transacciones y reducir costes para aplicaciones empresariales. Estas mejoras sincronizadas señalan que la ventaja competitiva clave ya no es solo la velocidad, sino la infraestructura preparada para la actividad financiera institucional a largo plazo. A medida que se implementen en 2026 y 2027, el capital, los desarrolladores y la liquidez favorecerán a las redes que demuestren una ejecución fiable, compatibilidad regulatoria y resistencia operativa.

ambcryptoHace 19 min(s)

Por qué 2026 podría redefinir a Ethereum, Solana, Base y Avalanche

ambcryptoHace 19 min(s)

Tiger Research: Primero, lleve la tokenización de RWA al extranjero

**Tiger Research: Lleva la tokenización de RWA al extranjero primero** El mercado de activos del mundo real tokenizados (RWA) está creciendo rápidamente, pero muchas jurisdicciones carecen de un marco regulatorio adecuado. Las instituciones financieras de estas regiones tienen tres opciones estratégicas: esperar legislación local, usar "sandboxes" regulatorios o ingresar directamente a mercados extranjeros ya regulados. La actividad RWA transfronteriza requiere una preparación meticulosa en seis áreas clave: elección de jurisdicción, licencias, definición del activo, perfil de inversor, y diseño de arreglos de liquidación y operación. El objetivo principal es acumular experiencia operativa real. Existen dos rutas principales: ingresar a jurisdicciones con marcos regulatorios maduros (como Hong Kong, Singapur o EE.UU.) o adoptar la ruta nativa "on-chain", utilizando plataformas con capacidades de cumplimiento integradas (ej. Ondo Global, Plume Nest) para una entrada más rápida y un mayor alcance, aunque con estructuras potencialmente más complejas. El proceso implica evaluar entidades locales existentes, seleccionar una plataforma o socio, diseñar la estructura del producto cumpliendo exenciones como la Regulation S, establecer acuerdos de custodia y operaciones "on-chain", y finalmente ejecutar y verificar la venta. La esencia del negocio no está en la tecnología, sino en completar con éxito todo el proceso de venta. No es necesario esperar a un marco regulatorio completo; la capacidad de trazar un camino viable rápidamente y acumular experiencia es crucial, ya que el mercado no esperará. El momento de actuar es ahora.

marsbitHace 29 min(s)

Tiger Research: Primero, lleve la tokenización de RWA al extranjero

marsbitHace 29 min(s)

5 años, 15,000 millones de dólares perdidos: el gigante de los juegos blockchain YGG se rinde

El 6 de julio, Yield Guild Games (YGG) anunció el cierre de su división de publicación de juegos, YGG Play, dando por terminada una apuesta lanzada en 2025. La plataforma, enfocada en juegos casuales web3, será desmantelada progresivamente antes del 31 de julio. A pesar de generar más de 9 millones de dólares en ingresos, con un pico en el primer trimestre de 2026 (876.000 dólares), sus fundadores alegaron que el deterioro del entorno macroeconómico, la falta de liquidez y la caída de confianza del usuario hicieron insostenible el negocio. Esta decisión marca un punto de inflexión para YGG, otrora gigante del modelo "play-to-earn" (P2E). Fundada en 2020, YGG alcanzó su cénit en 2021 como el gremio más grande de Axie Infinity, impulsada por la narrativa P2E y el mercado alcista. Sin embargo, el colapso del modelo económico de Axie en 2022, basado en un ciclo financiero especulativo que requería constante entrada de nuevos jugadores, sumió a la industria en una crisis profunda. El cierre de YGG Play refleja el declive estructural del sector de los juegos blockchain. Un informe de abril de 2026 señala que el 93% de unos 3.200 proyectos analizados están "muertos" o inactivos, con tokens del sector depreciados en un 95% desde máximos de 2022. La narrativa P2E, que sustentó la explosión inicial, demostró ser insostenible, llevando a una destrucción de capital estimada en 150.000 millones de dólares en cinco años. Ante esto, YGG anunció un cambio estratégico radical hacia la economía de datos para IA, abandonando efectivamente su núcleo histórico en el gaming.

Foresight NewsHace 48 min(s)

5 años, 15,000 millones de dólares perdidos: el gigante de los juegos blockchain YGG se rinde

Foresight NewsHace 48 min(s)

Trading

Spot

Artículos destacados

Cómo comprar O

¡Bienvenido a HTX.com! Hemos hecho que comprar O1 exchange (O) sea simple y conveniente. Sigue nuestra guía paso a paso para iniciar tu viaje de criptos.Paso 1: crea tu cuenta HTXUtiliza tu correo electrónico o número de teléfono para registrarte y obtener una cuenta gratuita en HTX. Experimenta un proceso de registro sin complicaciones y desbloquea todas las funciones.Obtener mi cuentaPaso 2: ve a Comprar cripto y elige tu método de pagoTarjeta de crédito/débito: usa tu Visa o Mastercard para comprar O1 exchange (O) al instante.Saldo: utiliza fondos del saldo de tu cuenta HTX para tradear sin problemas.Terceros: hemos agregado métodos de pago populares como Google Pay y Apple Pay para mejorar la comodidad.P2P: tradear directamente con otros usuarios en HTX.Over-the-Counter (OTC): ofrecemos servicios personalizados y tipos de cambio competitivos para los traders.Paso 3: guarda tu O1 exchange (O)Después de comprar tu O1 exchange (O), guárdalo en tu cuenta HTX. Alternativamente, puedes enviarlo a otro lugar mediante transferencia blockchain o utilizarlo para tradear otras criptomonedas.Paso 4: tradear O1 exchange (O)Tradear fácilmente con O1 exchange (O) en HTX's mercado spot. Simplemente accede a tu cuenta, selecciona tu par de trading, ejecuta tus trades y monitorea en tiempo real. Ofrecemos una experiencia fácil de usar tanto para principiantes como para traders experimentados.

100 Vistas totalesPublicado en 2026.06.19Actualizado en 2026.06.29

Cómo comprar O

Cómo comprar PROS

¡Bienvenido a HTX.com! Hemos hecho que comprar Pharos (PROS) sea simple y conveniente. Sigue nuestra guía paso a paso para iniciar tu viaje de criptos.Paso 1: crea tu cuenta HTXUtiliza tu correo electrónico o número de teléfono para registrarte y obtener una cuenta gratuita en HTX. Experimenta un proceso de registro sin complicaciones y desbloquea todas las funciones.Obtener mi cuentaPaso 2: ve a Comprar cripto y elige tu método de pagoTarjeta de crédito/débito: usa tu Visa o Mastercard para comprar Pharos (PROS) al instante.Saldo: utiliza fondos del saldo de tu cuenta HTX para tradear sin problemas.Terceros: hemos agregado métodos de pago populares como Google Pay y Apple Pay para mejorar la comodidad.P2P: tradear directamente con otros usuarios en HTX.Over-the-Counter (OTC): ofrecemos servicios personalizados y tipos de cambio competitivos para los traders.Paso 3: guarda tu Pharos (PROS)Después de comprar tu Pharos (PROS), guárdalo en tu cuenta HTX. Alternativamente, puedes enviarlo a otro lugar mediante transferencia blockchain o utilizarlo para tradear otras criptomonedas.Paso 4: tradear Pharos (PROS)Tradear fácilmente con Pharos (PROS) en HTX's mercado spot. Simplemente accede a tu cuenta, selecciona tu par de trading, ejecuta tus trades y monitorea en tiempo real. Ofrecemos una experiencia fácil de usar tanto para principiantes como para traders experimentados.

96 Vistas totalesPublicado en 2026.06.22Actualizado en 2026.06.29

Cómo comprar PROS

Qué es VERONA

I. Introducción al Proyecto VERONA es una blockchain construida para todos, en cualquier lugar, a través de la abstracción de la cadena. Utilizando su capa de Abstracción Generalizada, VERONA se distingue por integrar funcionalidades complejas de blockchain, como cuentas, firmas e interoperabilidad, directamente a nivel de protocolo. Este enfoque permite interactuar con aplicaciones de blockchain sin necesidad de entender las tecnologías subyacentes.1) Información Básica Nombre: VERONA (VERONA)III. Enlaces Relacionados Enlace al sitio web oficial: https://xion.burnt.com/ Libro Blanco: https://xion.burnt.com/whitepaper.pdf Exploradores: https://explorer.burnt.com/ Redes Sociales: https://x.com/burnt_xion Nota: La introducción del proyecto proviene de los materiales publicados o proporcionados por el equipo oficial del proyecto, que es solo para referencia y no constituye asesoramiento de inversión. HTX no se hace responsable de ninguna pérdida directa o indirecta resultante.

93 Vistas totalesPublicado en 2026.06.22Actualizado en 2026.06.22

Qué es VERONA

Discusiones

Bienvenido a la comunidad de HTX. Aquí puedes mantenerte informado sobre los últimos desarrollos de la plataforma y acceder a análisis profesionales del mercado. A continuación se presentan las opiniones de los usuarios sobre el precio de A (A).

活动图片