Abstract: The encryption market in 2022 has faced a crushing. Judging from the historical bull-bear cycle and market indices, some modern images have begun.
Let’s take a look at the historical trend of Bitcoin below. From being worthless to completing the first pizza transaction on May 22, 2010, Bitcoin began to have a price connected to the physical world.
But until 2012, that is, within three years of the birth of Bitcoin, BTC transactions still mainly occurred among geeks. It was not until 2013 that the BTC bull market attracted the attention of geeks.
1. The first round of cycle - BTC began to walk out of the geek circle
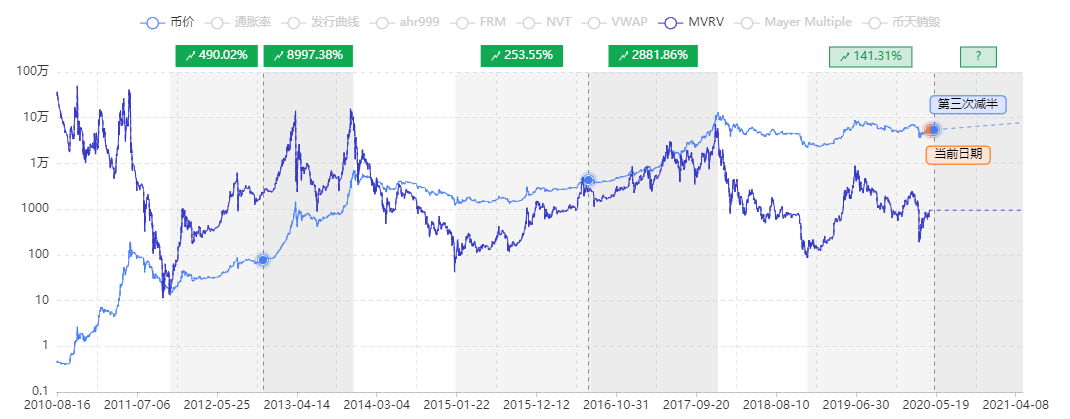
On November 28, 2012, Bitcoin experienced its first halving for the first time, its limited issuance dwarfed the US dollar, and Bitcoin ushered in the first round of a bull market. On April 10, 2013, the price of BTC hit $290, and the market value of BTC reached $3 billion.
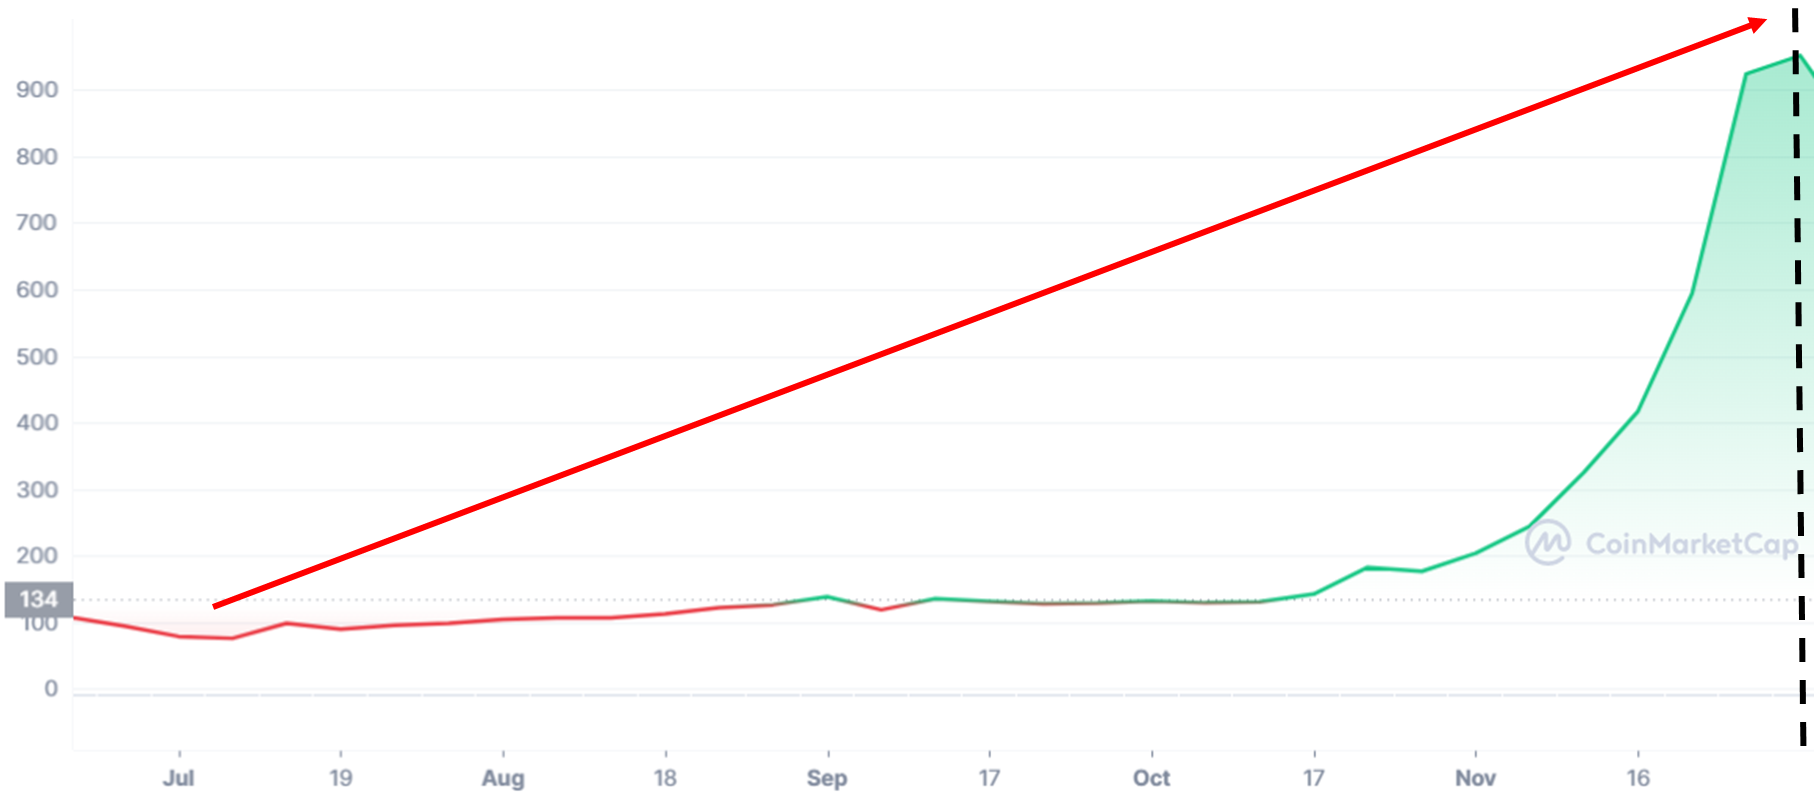
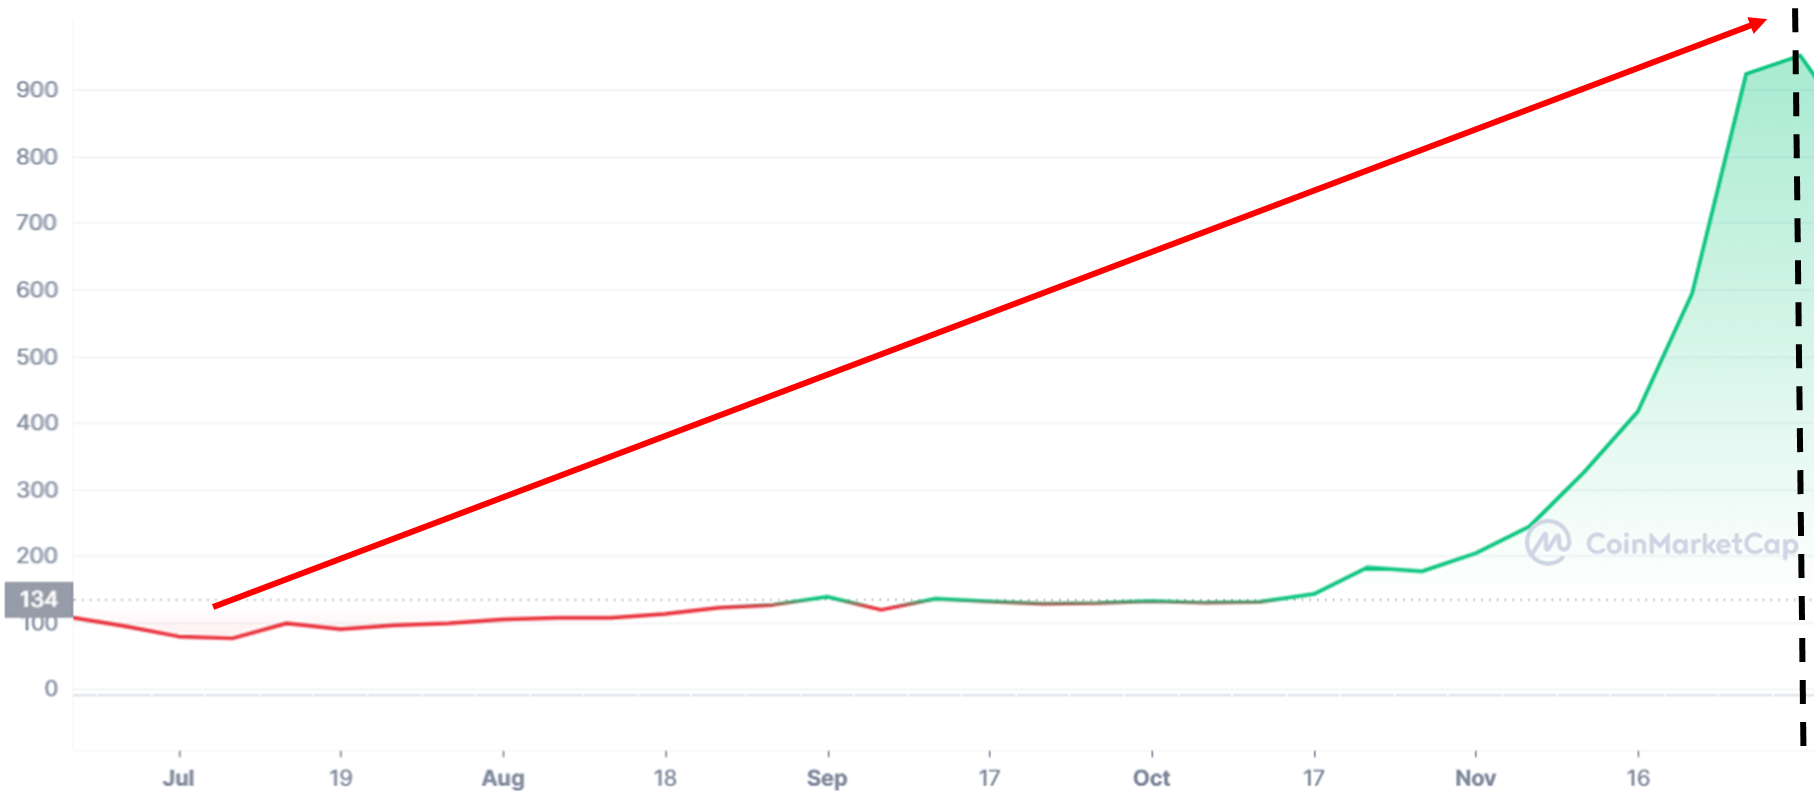
In May 2012, the Butterfly mining machine started crowdfunding, and the importance of miners has begun to be seen.
In July 2013, the price of BTC fell to the bottom, with a drop of 71.6%, which lasted for 87 days.
In October 2013, the FBI shut down the hacker Silk Road. However, BTC has not changed the uptrend.
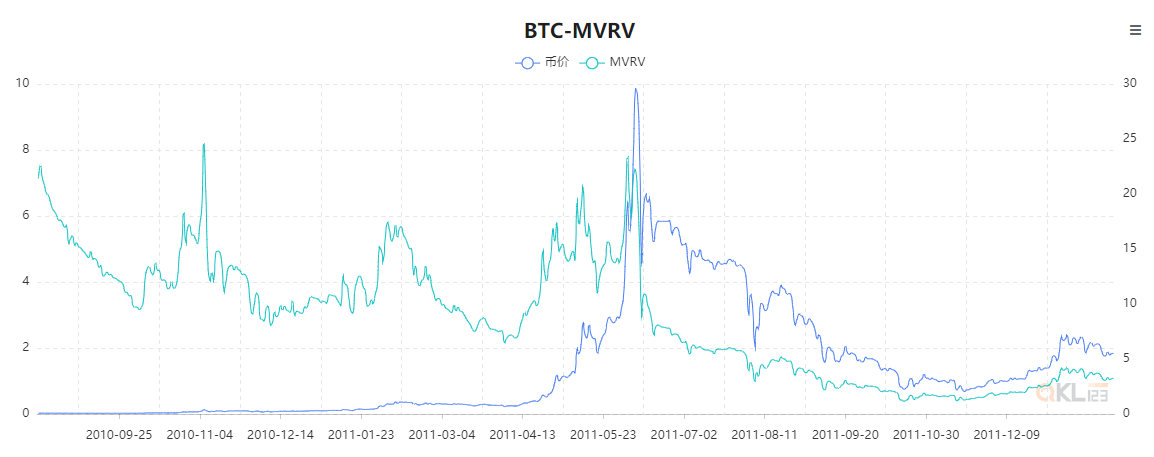
In the early days, due to a large number of additional BTC issuances and inactive market transactions, the MVRV value of BTC fluctuated greatly, and its fluctuations roughly converged with the currency price.
2. The second cycle - the traditional world begins to pay attention to encrypted assets
On December 4, 2013, the bull market reached its peak, with an increase of 1708%, which lasted for 151 days, and the market value of BTC reached 13.93 billion US dollars.
In December 2013, Bitmain's Antminer S1 mining machine generation began to ship, and the computing power of Bitcoin began to soar.
On December 5, 2013, the People's Bank of China issued the "Notice on Preventing Bitcoin Risks Issued by Five Ministries and Commissions including the People's Bank of China", announcing the end of the current round of the bull market.
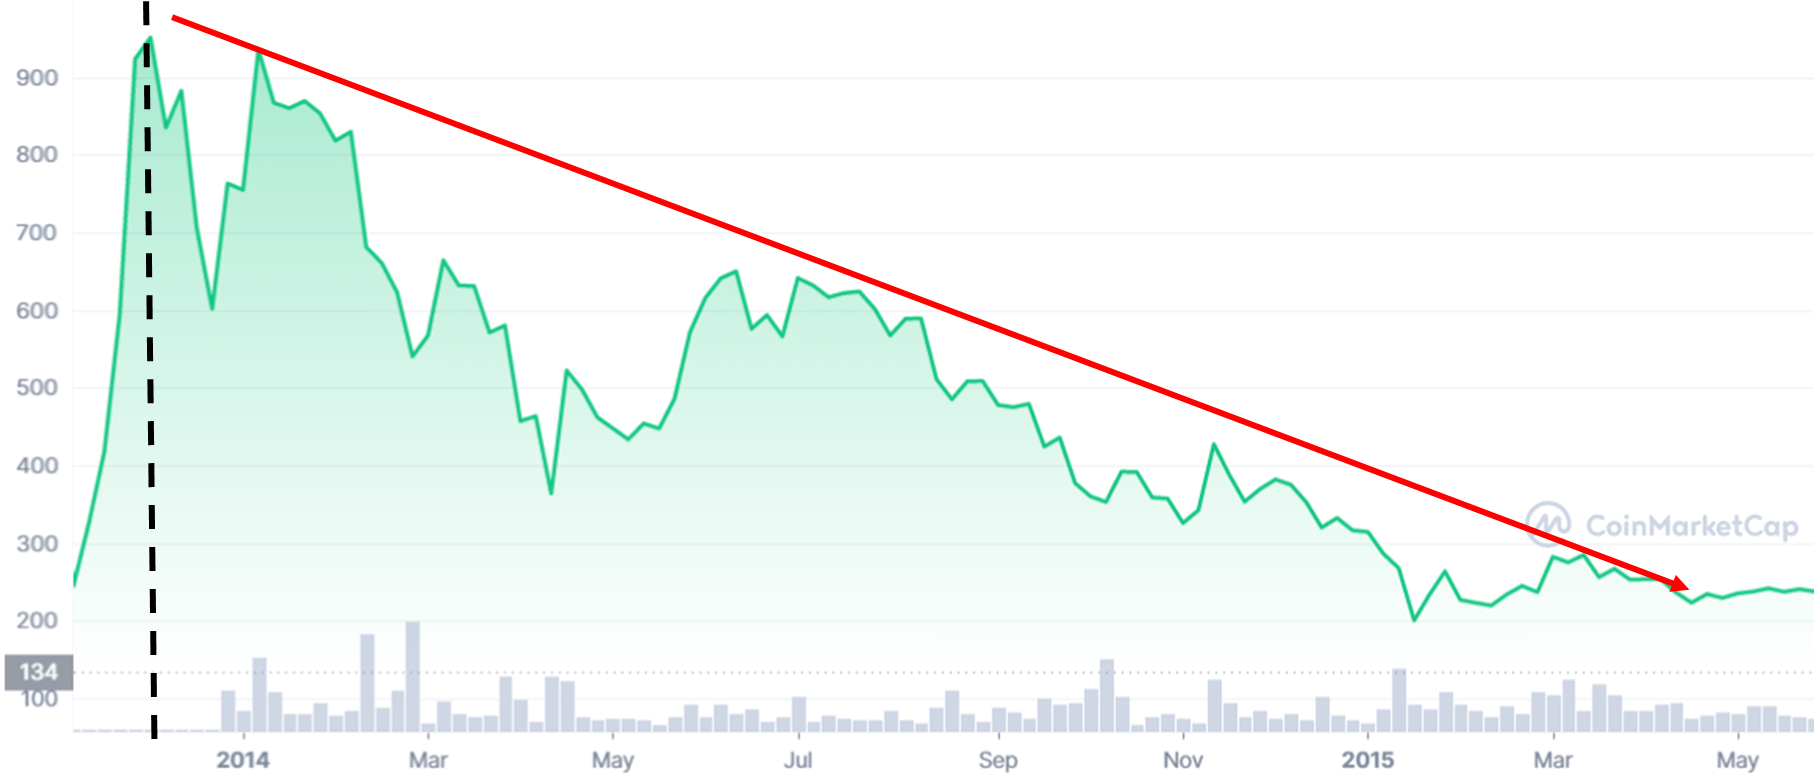
In February 2014, MT. Gox, the world's largest exchange at that time, stopped trading on its website and then filed for bankruptcy, which allowed the rebounding BTC to establish a unilateral decline in the bear market.
On August 24, 2015, BTC finally hit the bottom with a drop of 84%. The bear market lasted for 628 days, and the lowest market value of BTC hit $3.23 billion.
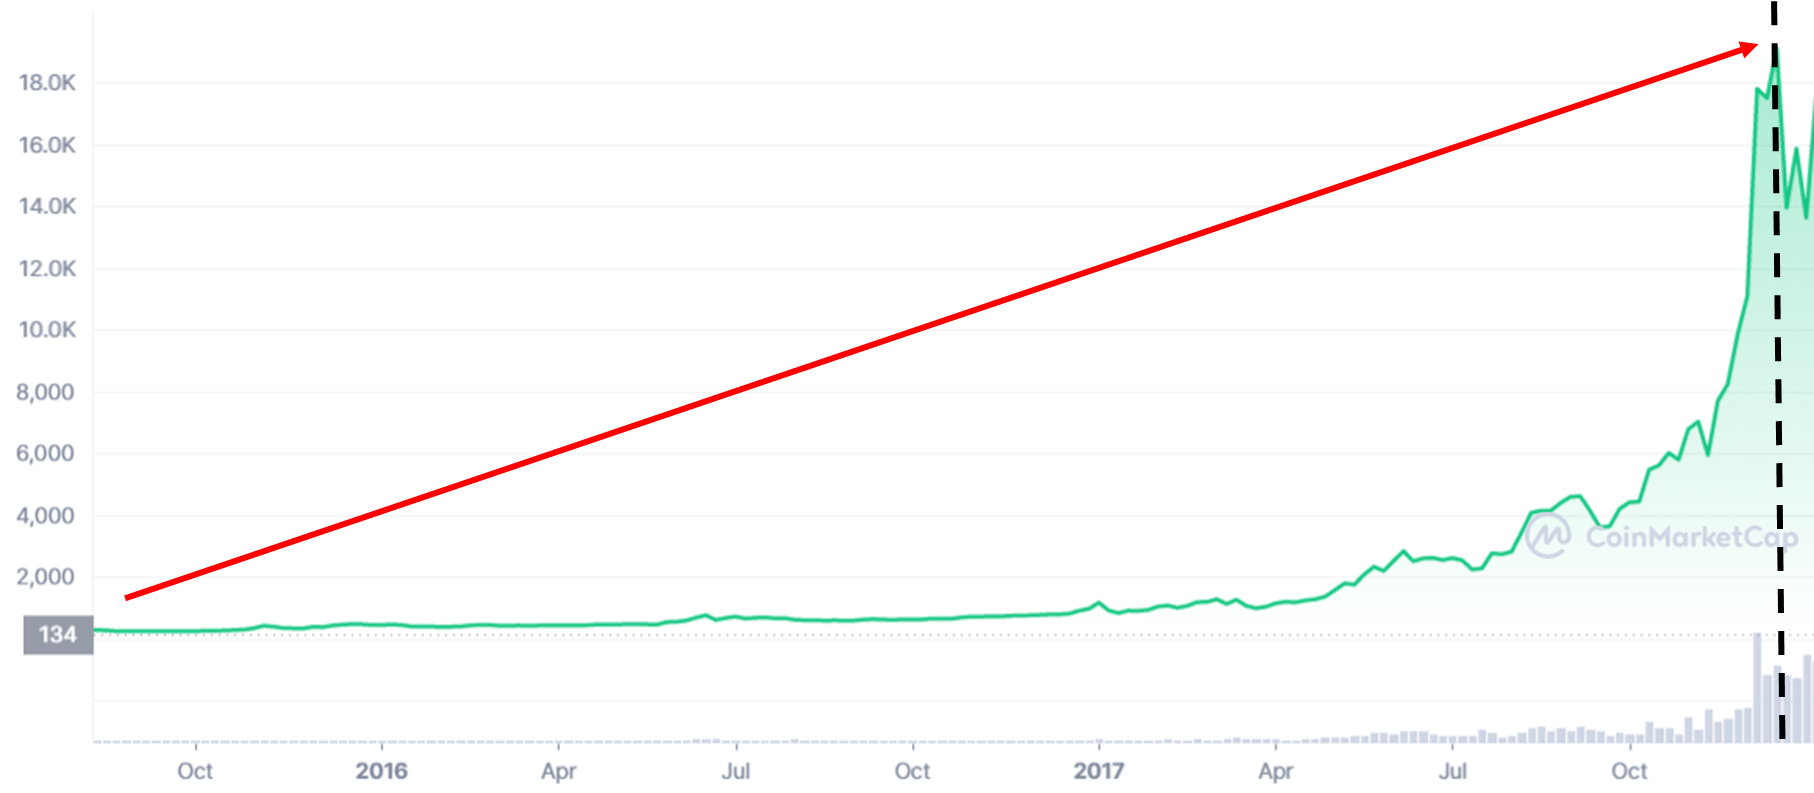
The market began to pick up in 2015, and Ethereum launched on July 30, 2015, provided infrastructure support for ICO.
On July 9, 2016, BTC once again attracted the second halving, and the market has more motivation to do more.
On July 20, 2016, the ETH community began to fork due to The DAO incident, but this failed to stop the encryption frenzy.
On August 1, 2017, a battle for capacity expansion split the Bitcoin community into two chains, Bitcoin (BTC) and Bitcoin Cash (BCH), and the price of BTC continued to rise.
On September 4, 2017, seven ministries and commissions including the People's Bank of China jointly issued the "Announcement on Preventing the Risks of Token Issuance and Financing", defining ICO as an illegal activity of "illegal public financing" and prohibiting cryptocurrency exchanges from providing services. It has triggered Chinese discussions to choose to go overseas. However, after the panic, the price of BTC still broke through 19,000 US dollars.
On December 17, 2017, the Chicago Mercantile Exchange (CME) launched Bitcoin futures, which marked the beginning of BTC entering the vision of traditional financial institutions.
This round of bull market has an overall increase of 9480%, which lasted 846 days, and the highest market value of BTC hit 326.19 billion US dollars. This round of bull market has made the myth of getting rich in Bitcoin deeply rooted in the hearts of the people, and the network effect of BTC has begun to show its prominence, which also paves the way for the entry of institutions in the next round of bull market.
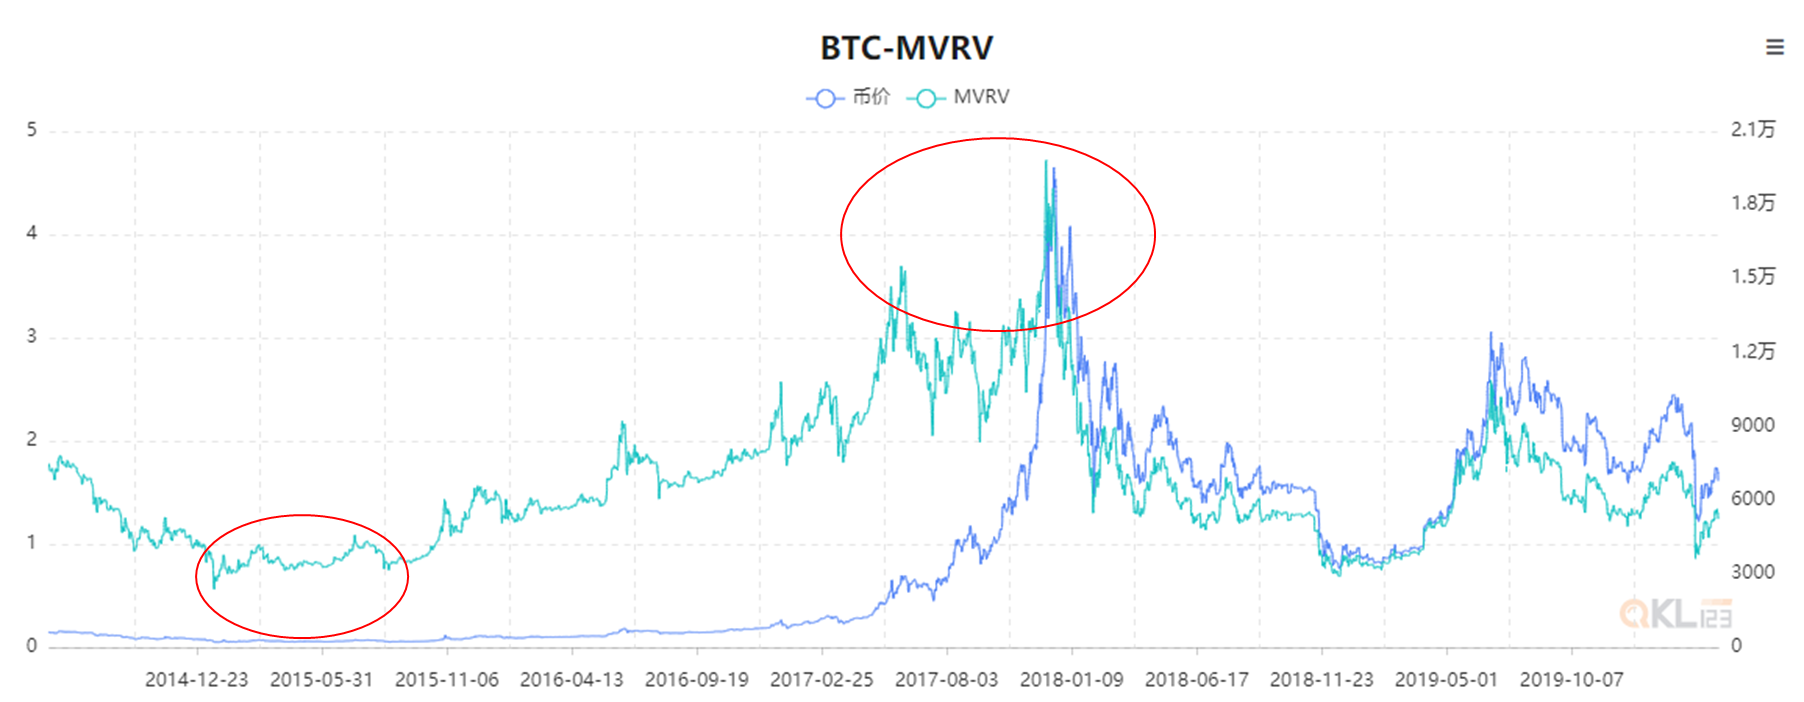
With the help of BTC's epic bull market in 2015-17, MVRV's predictive ability has just begun to emerge. Predicted the bottom and top in this round of market, showing the strength to become the compass of the currency circle.
3. The third cycle - the traditional market begins to affect the trend of BTC
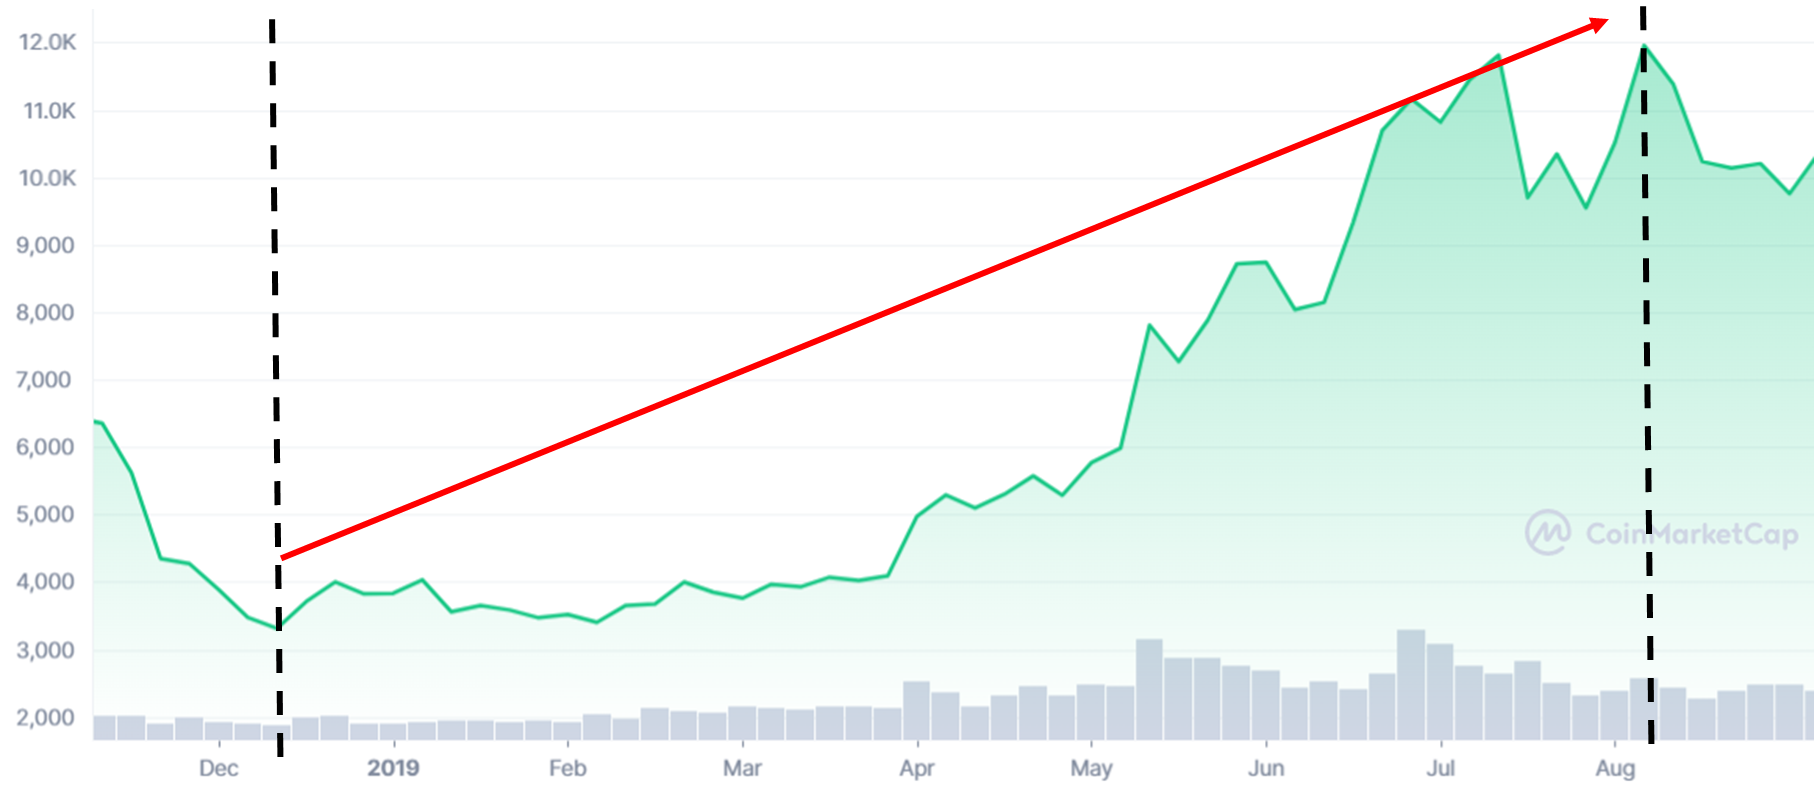
In the middle of 2019, the market reached its peak with an increase of 328%, which lasted for 193 days, and the highest market value of BTC was 220.59 billion US dollars. This rising cycle is also inseparable from the Federal Reserve. In 2019, the Fed adjusted its interest rate hike stance to cut interest rates and lowered the Federal Reserve rate three times in a row.
4. The 4th round of the cycle - a huge amount of liquidity has attracted the attention of traditional finance
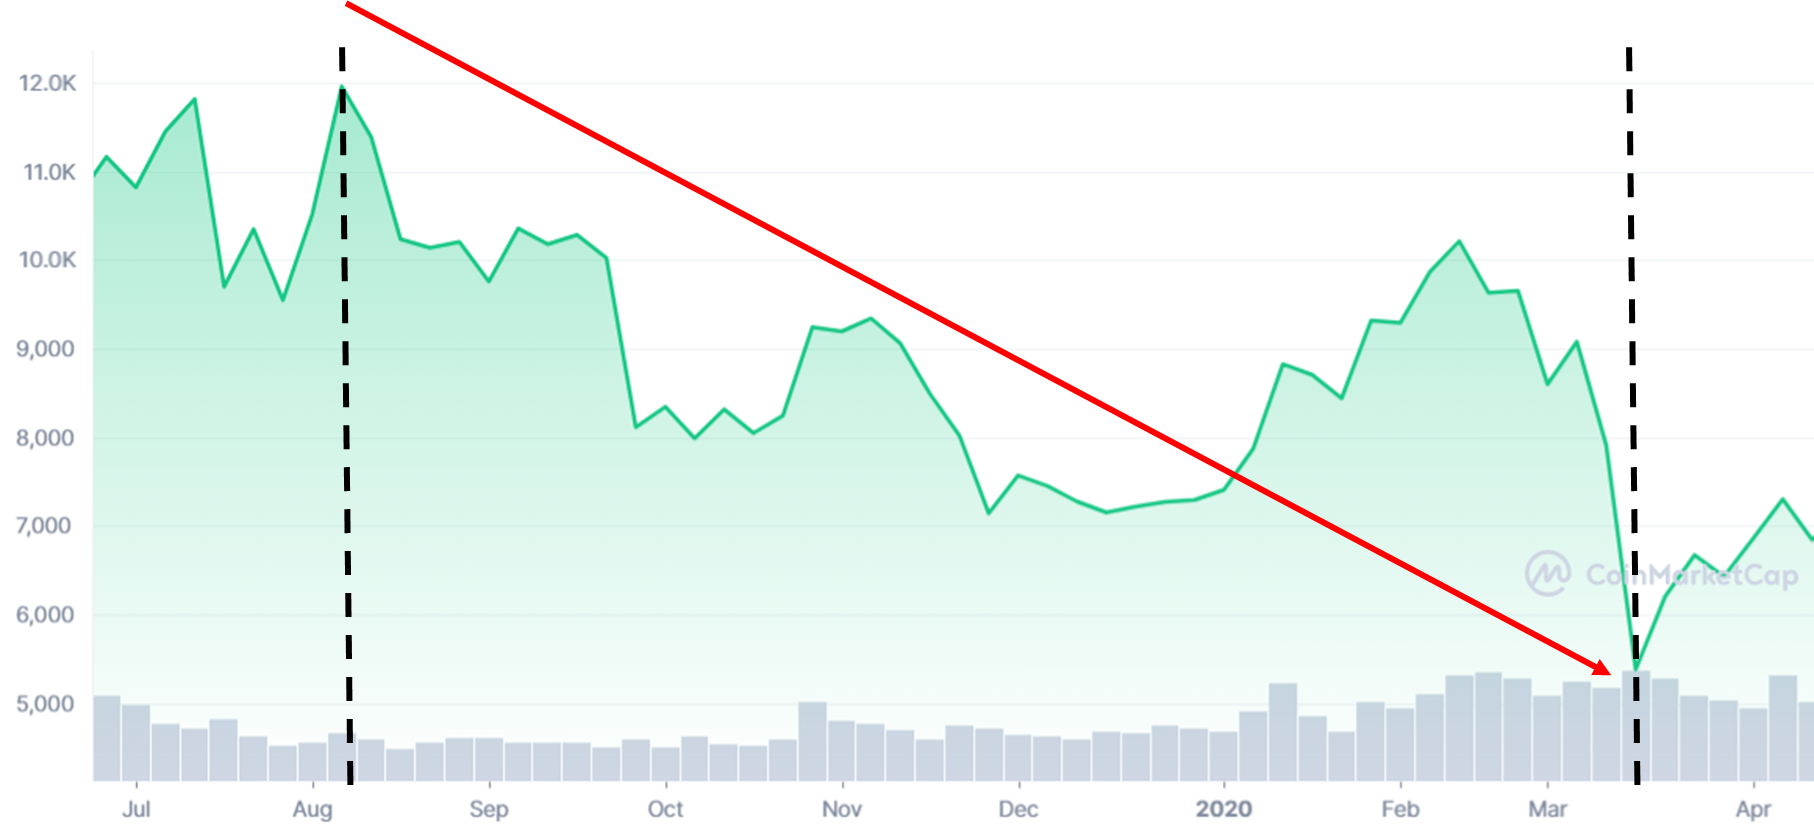
In January 2020, the United States began to report the first case of a new crown, and the epidemic reached its peak in March. The Federal Reserve directly lowered interest rates to zero and adopted quantitative easing methods to deal with the economic stall. This rate cut is unprecedented.
On March 13, 2020, BTC entered the bottom of the bear market and fell by 70%. This time lasted 261 days, and the minimum market value of BTC was 95.04 billion US dollars.
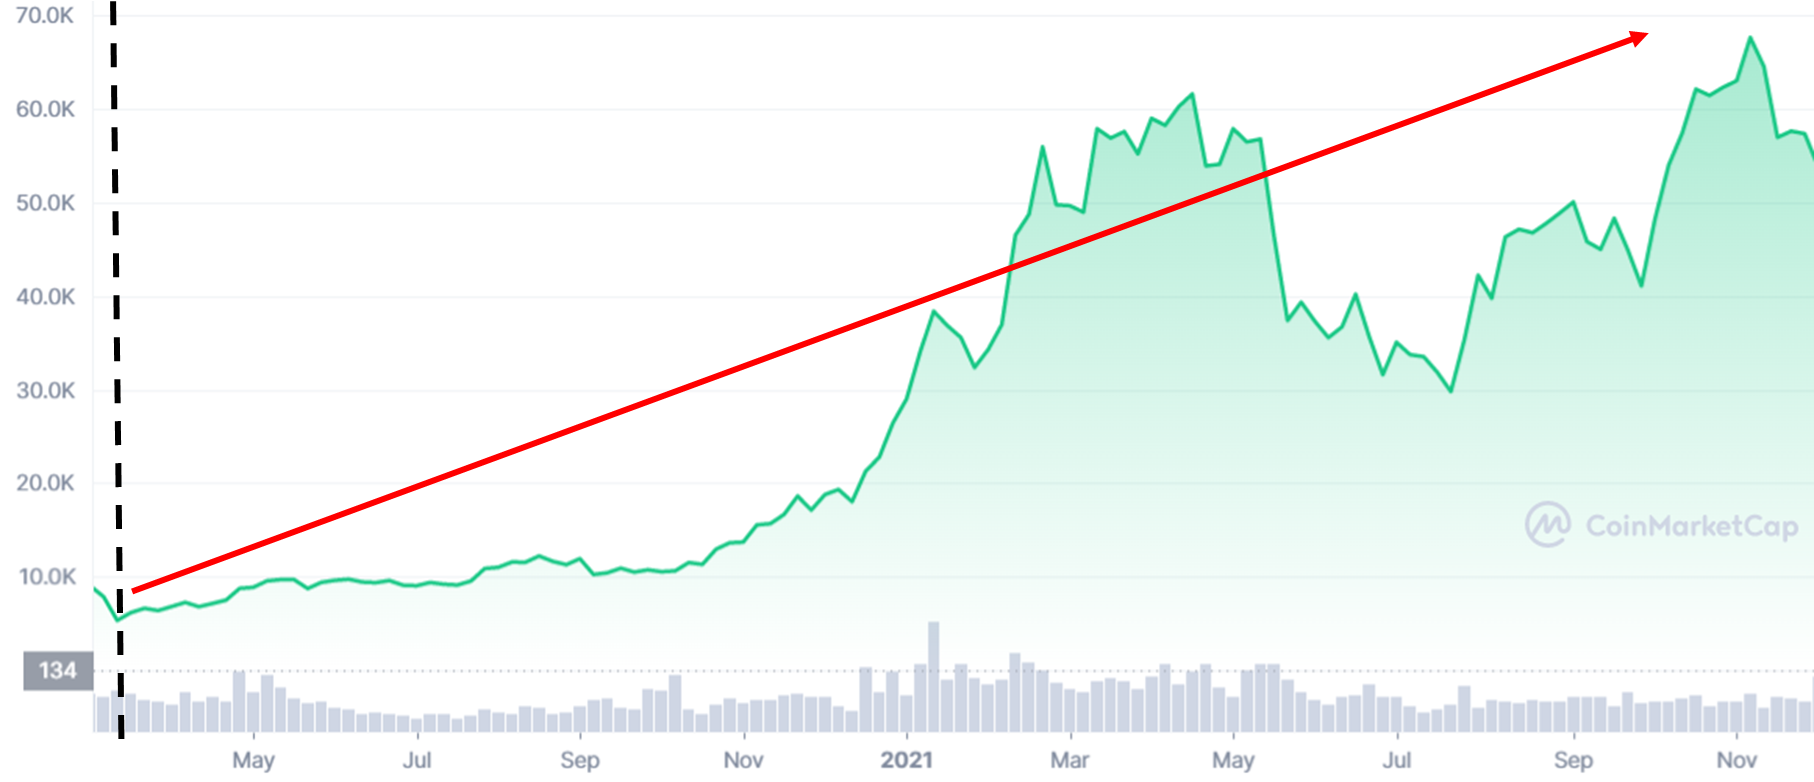
Catalyzed by the huge amount of U.S. dollars and zero interest rates, BTC began to attract the high interest of traditional capital and began large-scale allocation. BTC hits new highs.
In this round of stories, new stories of DeFi and NFT appeared to drive the Web3 narrative to the ground, and retail investors also ran into the market to participate in Yield farming.
Finally, on November 10, 2021, the BTC bull market reached its peak, and the highest market value of BTC hit $1,270 billion and then turned around.
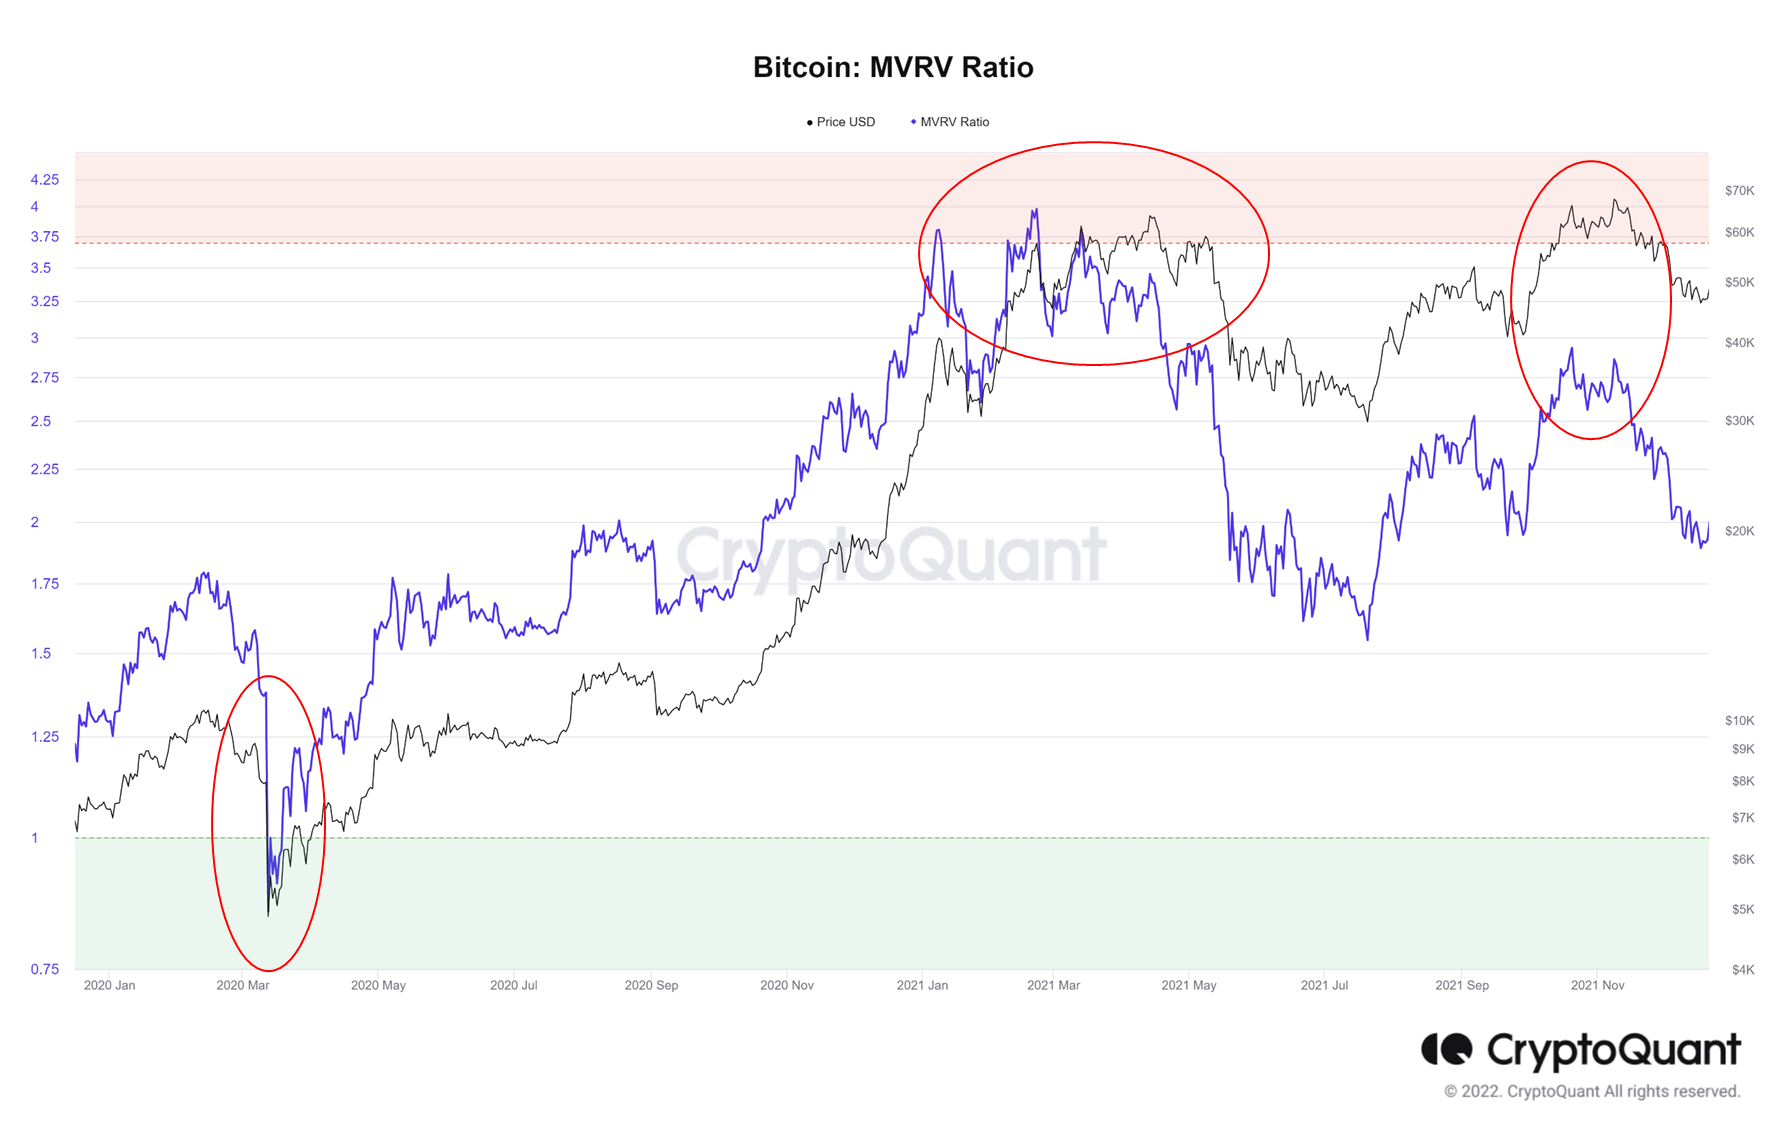
In the last cycle, due to the entry of traditional institutions, the price movement of BTC began to be analyzed marginally with several indicators. The MVRV indicator accurately predicts the rising and falling inflection points.
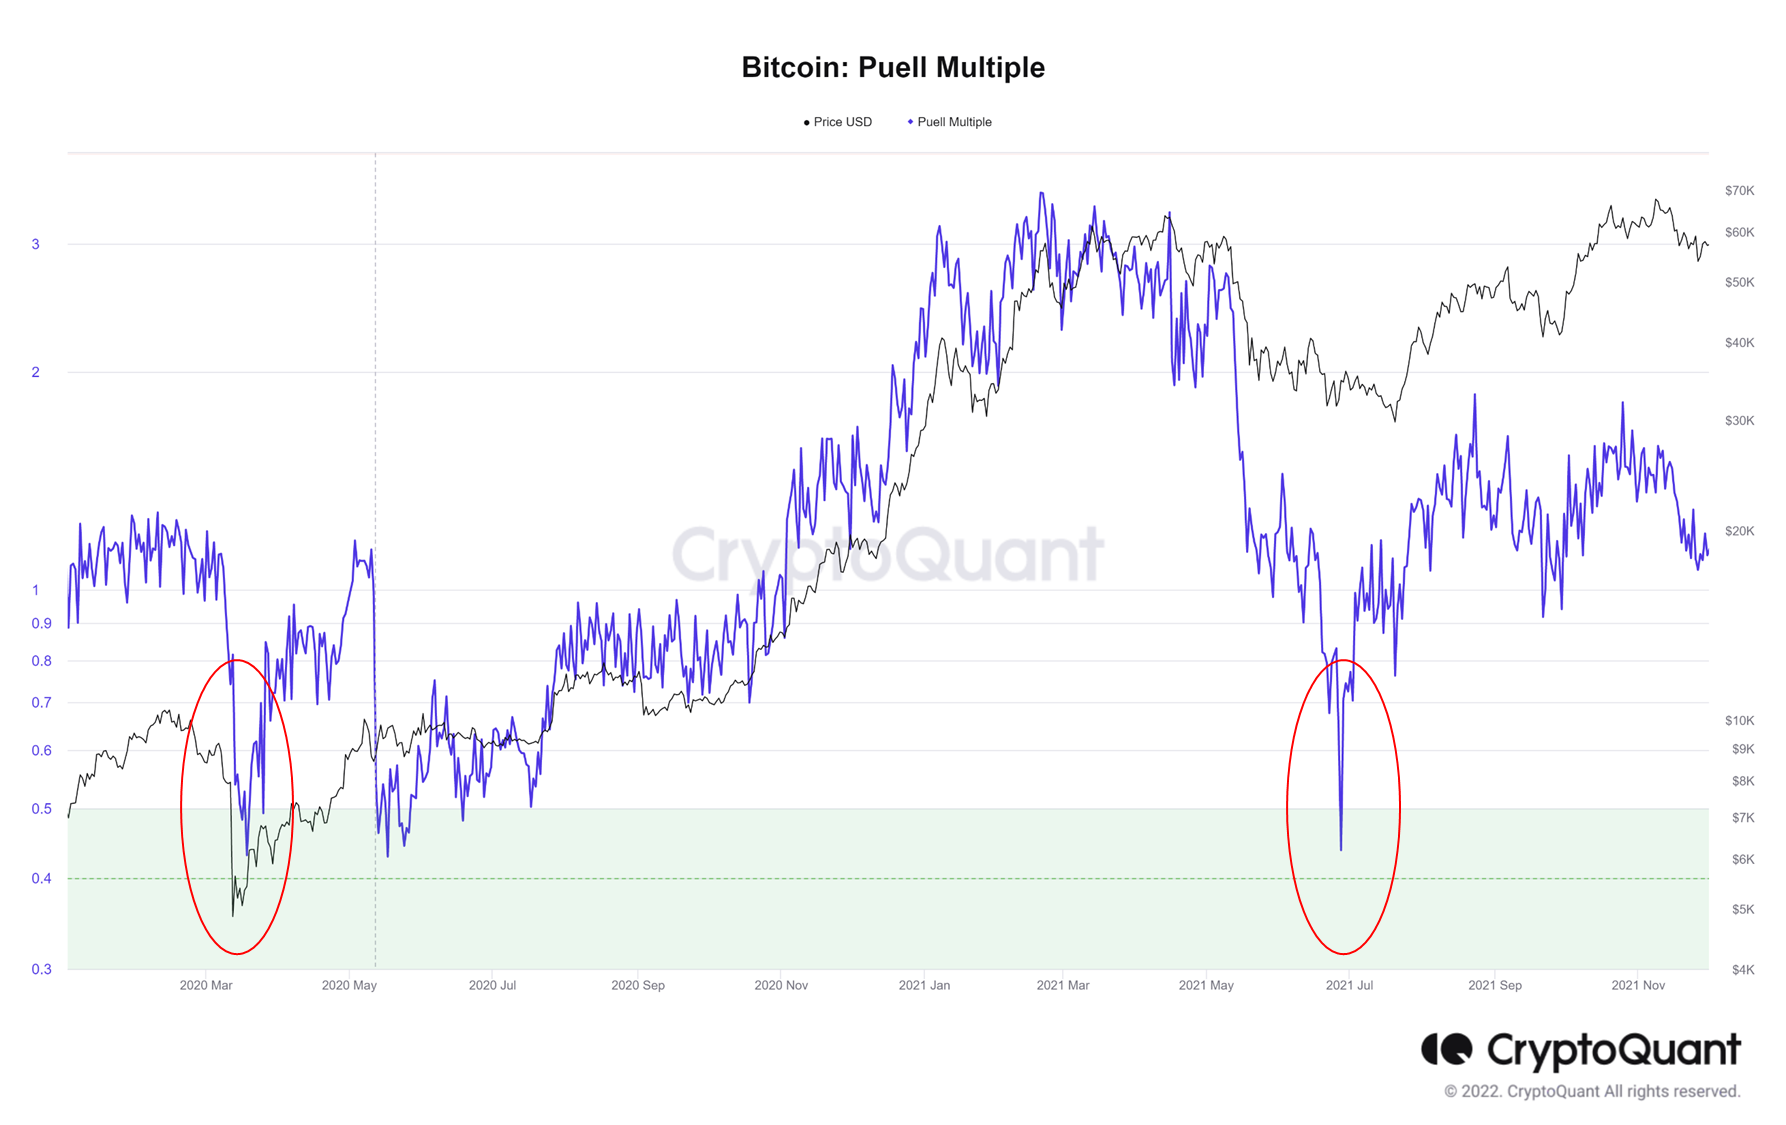
The Pull multiple also strongly explains the BTC reversal.
5. The current cycle - the dawn has appeared
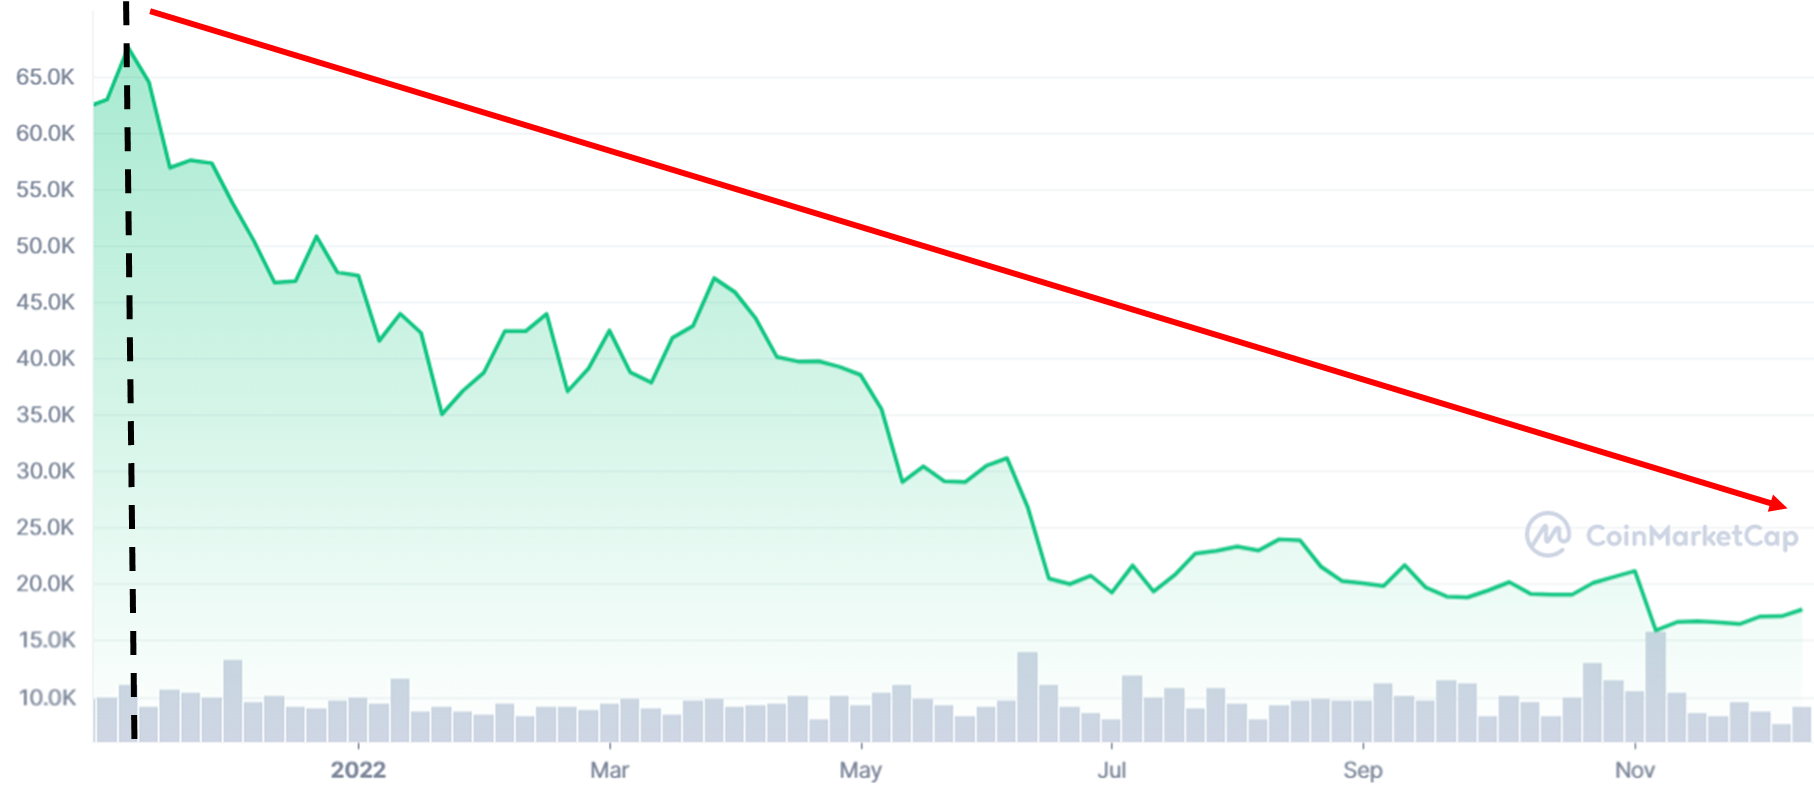
Since 2022, the deepest decline of BTC has reached 76%, and the market value has reached a minimum of 317.95 billion US dollars.
In terms of the decline rate, the decline in the BTC bear market is between 72% and 84%. The decline in this bear market has reached 76%, which is already in the bottom range.
From the perspective of the bear market cycle, not counting the early days, the bear market decline cycle of BTC is 261 days to 628 days. After the bull market peaked, it reached the bottom of the bear market in about 400 days on average. It will take some time to fully recover, and this bear market has passed 379 days, also close to the bottom in terms of time.
From the perspective of the liquidity level represented by the dollar monetary policy, it is expected that the U.S. economy will inevitably enter a recession in 2023, and the Fed’s transition from hawk to dove is a high-probability event. Against the background of the dollar’s slowdown in interest rate hikes, the encryption market will gain a Better funding environment.
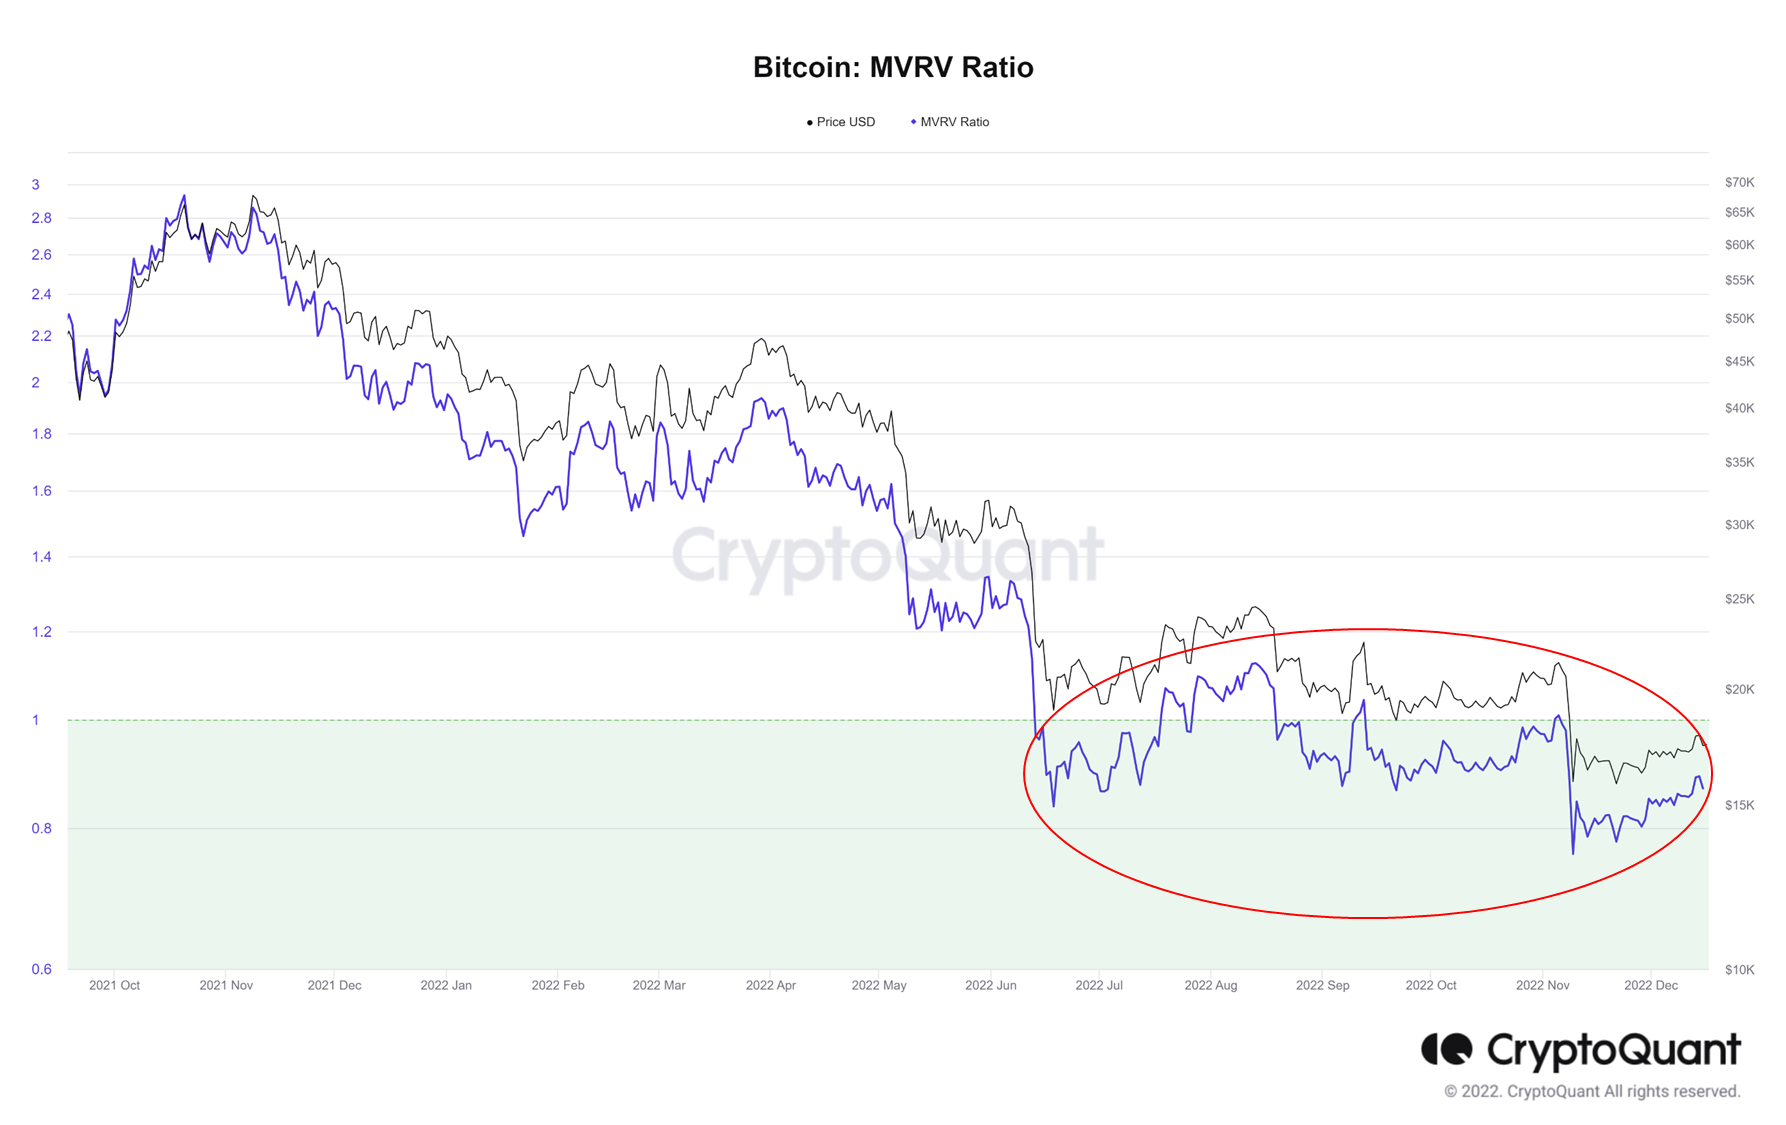
Judging from the fundamentals of supply and demand represented by the MVRV indicator, BTC has been determined to enter the bottom:
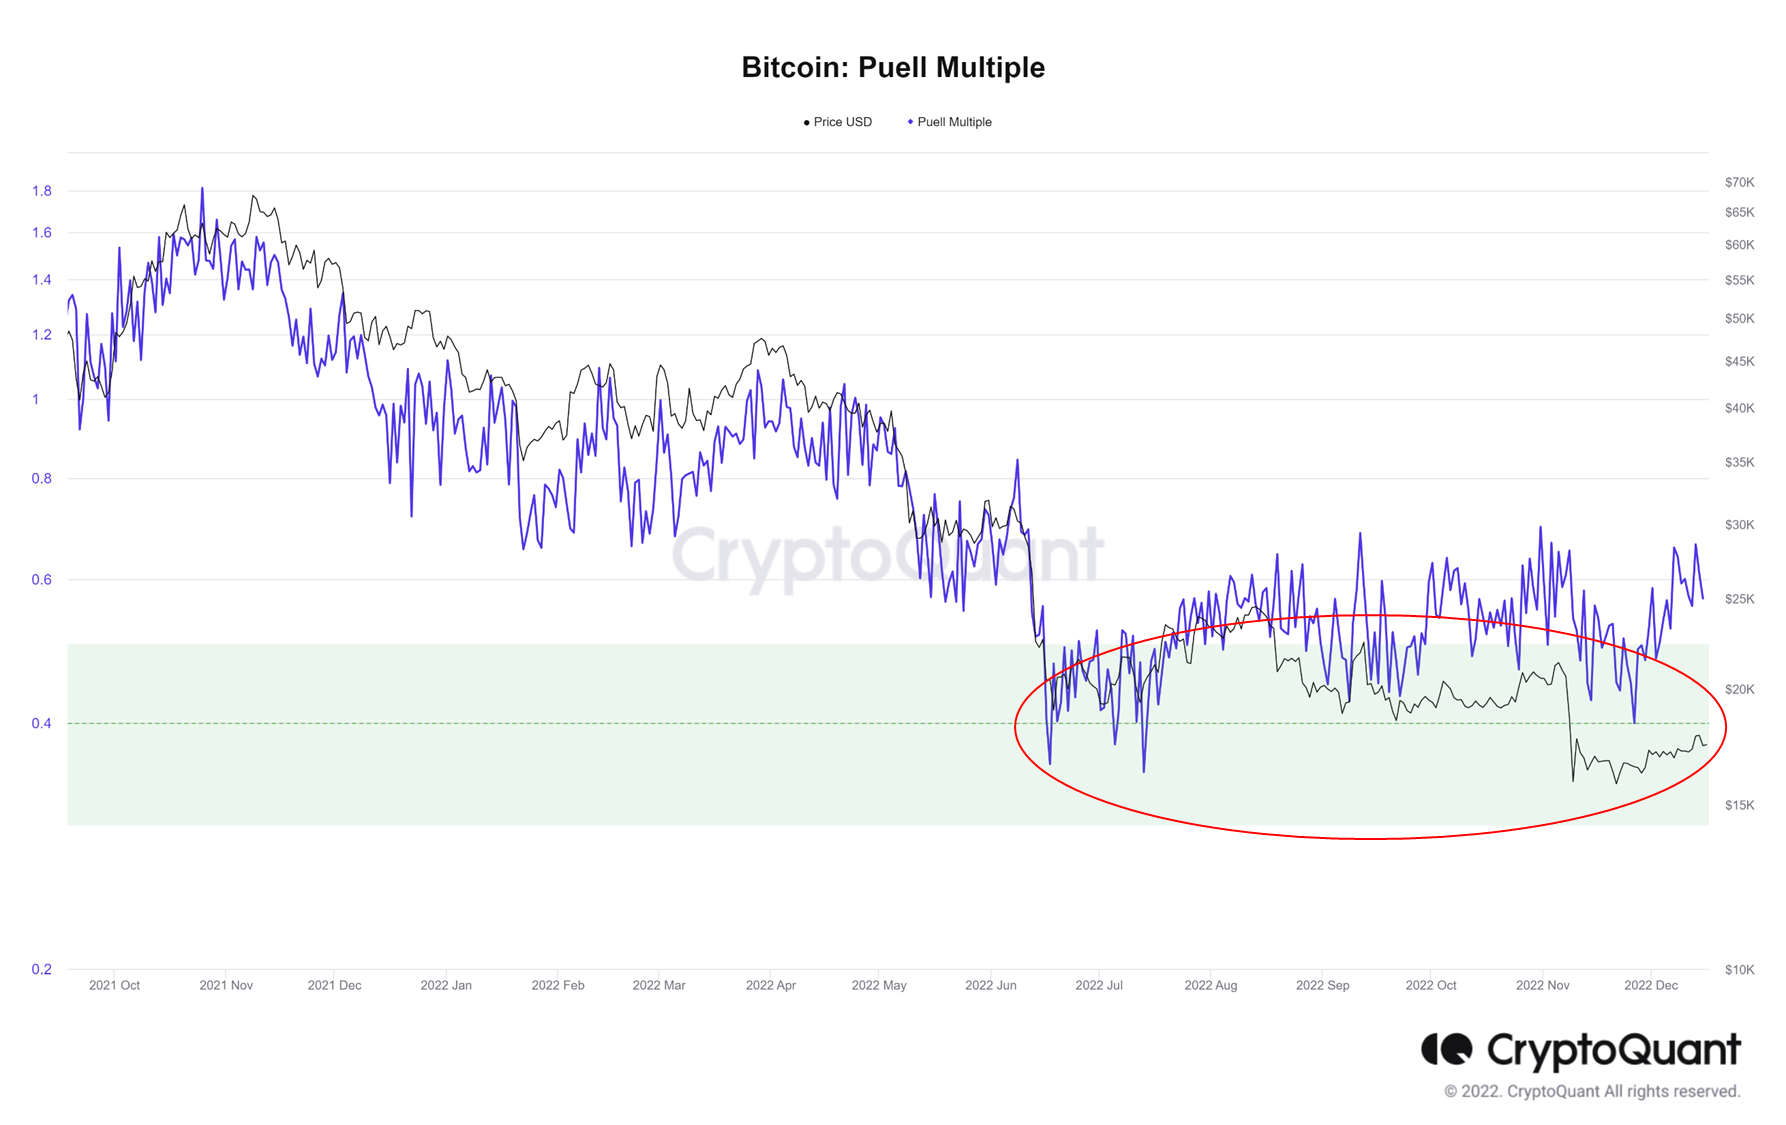
Judging from the Puell multiple, BTC also showed a trend of bottoming out and stabilizing:
Although the encryption winter of 2022 is cold, the dawn of 2023 has already appeared, and the encryption market will inevitably cross the black ditch and move toward the promised land.
Appendix 1: Market Research and Judgment Indicators
MVRV
MVRV is a relative indicator, which is the ratio of the circulating market value (Market Cap, MV) and the realized market value (Realized Cap, RV). It was first proposed by Murad Mahmudov & David Puell, and its expression is:
MVRV = MV / RV
Among them, Realized Cap is based on the UTXO model, and the calculation is the sum of the "corresponding value at the last move" of all coins on the chain. Compared with the circulation market value (existing circulation * market price), RV has the following advantages:
(1) Reduce the impact of the part that has been withdrawn from circulation (or the part that has been lost)
(2) Considering the market value of each currency on the chain when it flows
(3) Can indirectly reflect the cost of chips for long-term holders
In the actual data processing process, to avoid the impact of dust attacks on UTXO (similar to account balances), the calculation of RV indicators is more complicated, and the following points are specifically processed:
(1) For the currency that is moved when the UTXO balance increases, the value of the transferred currency is calculated based on the price at the time of movement
(2) For the coins that are moved when the UTXO balance decreases, the transfer will "activate" all the coins in the UTXO, and the value of all the coins in the UTXO is calculated by the corresponding market price when it has been moved
That is to say, the realized market value of the balance of this address is 24,000 USD according to the different attribution of the amount transferred in or transferred out. If no distinction is made between transfer-in and transfer-out, the corresponding realized market value is $64,000 (8*$8,000). In comparison, the $24,000 after distinguishing between transfers in and out is more reflective of the cost of holding coins at the address than $64,000.
Because RV can approximate the long-term cost of all Bitcoin holders in the market (in extreme cases, there will be a large deviation), it is usually lower than MV in the context of growing market demand for Bitcoin. Behind the "market value" of the difference between RV and MV, there may be suppliers in the short-term market (the selling pressure brings downside risks), or it may be the backer (or the last sufferer) in the long-term market. Therefore, the MVRV ratio indirectly reflects the imbalance between the supply and demand of Bitcoin in the secondary market, which in turn can reflect the degree to which the market price is undervalued or overvalued.
Puell multiple
The Puell Multiple is calculated by dividing the daily token issuance rate (in USD) by the 365-day moving average of this value. Daily issuance refers to new coins added to the ecosystem by miners who receive coins as block rewards. Miners usually pay for mining costs by selling coins to the market.
Analyzing the relationship between the Puell multiple and BTC price in history shows that when the index value is low, it indicates that the BTC bear market will have bottom characteristics, and the buying time will appear.
The lower value of the Puell multiple means that the suppression of circulation on prices has weakened, and BTC has entered the bottoming stage. Historically, the Puell multiple reached an area below the historical low of 0.40 in January 2015, November 2018, and May 2020, and the corresponding BTC price completed the bottom construction and entered a bull market.
The current Puell multiple of BTC will reach below 0.4 in July 2022, and the value continues to rebound, which also suggests similar bottom characteristics.
Judging from the current BTC price performance, the running time of the bottom area is longer, but in the process of long-term bottom confirmation, the opportunity to buy low should not be missed.
Appendix 2: Encryption Industry Events in 2022
Biden signs executive order on cryptocurrency regulation
On March 9, 2022, U.S. President Biden signed the "Executive Order on Ensuring Responsible Innovation of Digital Assets", the first-ever whole-of-government measure in the history of the United States to address risks and leverage digital assets and their underlying technologies. potential benefits. On September 16, the White House released the first draft regulatory framework for the cryptocurrency industry.
Terra crash
Terra's ecology will be extremely prosperous from the end of 2021 to the beginning of 2022. On May 7th, Terra’s UST fund pool in Curve was unanchored due to a large sell-off by giant whales. Two days later, UST lost its peg again, triggering a full-blown bank run. UST holders are eager to redeem tokens with LUNA, thereby increasing the supply of LUNA and devaluing tokens, which in turn causes more UST holders to redeem. Terra's algorithm pushed LUNA to issue many additional issuances, and LUNA & UST entered a death spiral, eventually leading to a collapse.
Celsius, and 3AC cause a strong shock in the encryption market
After the thunderstorm of Terra, Celsius suspended withdrawals, and then rumors about 3AC's bankruptcy began to circulate, and the liquidity crisis of the institution broke out completely.
U.S. Treasury sanctions Tornado cash
On August 8, 2022, the U.S. Treasury Department’s Office of Foreign Assets Control announced that the agreement was on its sanctions list. The Tornado cash ban is unprecedented, marking the first time a government agency has sanctioned open-source code rather than a specific entity, and investors have raised concerns about Ethereum's ability to resist censorship.
Fed continues to raise interest rates
In 2022, global inflation will be high, and the current inflation rate in the United States has reached its highest level since 1980. Former U.S. Treasury Secretary Lawrence Summers bluntly said that since the U.S. economy is still strong, the Fed may need to raise interest rates to 6% or higher.
STEPN promotes the development of blockchain games
At the beginning of April 2022, STEPN officially announced that its market value exceeded US$1 billion and it became a unicorn company. At its peak, STEPN had 1 million users and 4.72 million registered users and was able to earn as much as $122.5 million in profits in a single quarter.
Ethereum Completes "Merger"
On September 15, 2022, the merger of Ethereum was completed, marking the official transition of the consensus mechanism of the Ethereum mainnet from Proof of Work (PoW) to Proof of Stake (PoS).
FTX triggers the Lehman moment in the currency circle
The bombshell hit in early November when rumors of illiquidity at FTX’s sibling company, Alameda Research, could squeeze FTX. The incident sparked a bank run on the platform before an investigation found that most of the exchange's assets had disappeared. In FTX’s bankruptcy, 130 related companies were implicated, and there were more than one million potential creditors. Temasek Holdings, SoftBank Vision Fund, Ontario Teachers’ Pension Fund, Steadview Capital, and other well-known venture capitals were all involved.