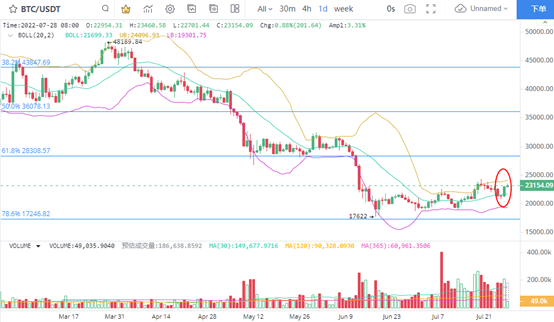
1. BTC maintains high-volume operation
BTC continued its technical rebound performance in the daily K-line chart, and the price rebounded significantly in the middle rail position of the brin line, which means that the short-term shock continues. As the trading volume remains high, the turnover rate of BTC is high, and the price activity is better when the overall trading frequency is high.
On the news side, BTC continued to rebound with US stocks after the US Federal Reserve's interest rate hike boots landed. When the market cheers for a short time, we also need to pay attention to the impact of selling pressure.
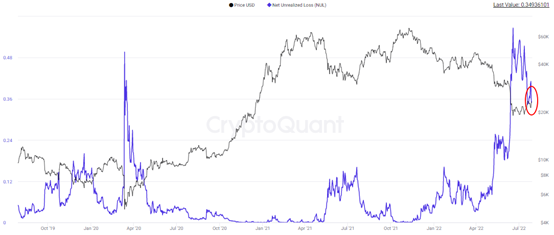
2. The unrealized loss of BTC decreased significantly
The unrealized loss of BTC has decreased significantly recently, making BTC closer and closer to the bottom. From the performance of nul index, the unrealized loss of BTC fell from a high of 0.485 to 0.349 on July 27. Compared with the performance of nul in March 2020, the current unrealized loss of BTC is still high. Based on this, it is judged that although BTC maintains strong fluctuations, it has not really entered the rebound trend. During this period, price fluctuations will be relatively frequent until the selling pressure is fully released.
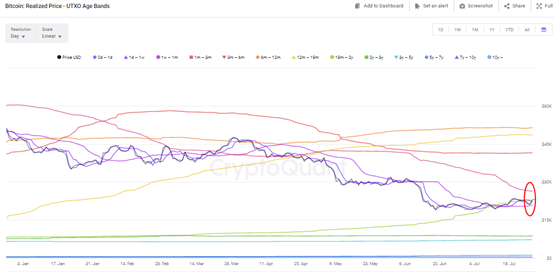
3. BTC cost concentration increased
With the extension of the adjustment time below the low price zone of $25000, BTC's one to three-month investor cost price fell back to $26324. Based on this, it is judged that BTC is still rebounding, but is constantly approaching the pressure level. The short-term cost price of one day to one week fell to $22356. Therefore, the typical pressure level can refer to $22356, and if it can break through smoothly, it will see $26324 upward. The cost price of BTC's important fastening plate is still above $41500. According to this judgment, the short-term selling pressure of BTC is not large, but it does not have the basis for substantial strengthening. At the transaction level, investors need to pay attention to low profit opportunities, but pay attention to selling pressure.
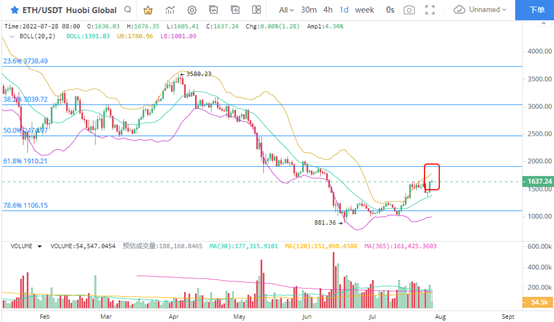
4. Eth reconfirmed the rebound expectation
In the daily K-line of eth, while the trading volume maintained a large-scale state, ETH reconfirmed the target point of this rebound of $1910. As an important pressure level of range fluctuation, US $1910 is the 61.8% dividing line of Fibonacci. Judging from the current volume and price performance, ETH has recently confirmed for the first time that the medium rail support of the brin line is effective. There are more opportunities for prices to remain strong next, but there is more room for prices to rise, and the risk of chasing up is relatively high.
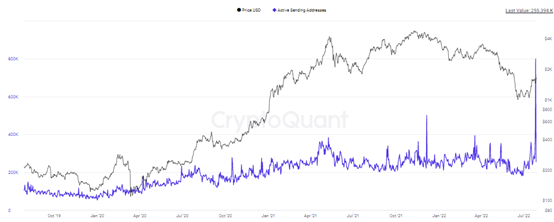
5. The number of active addresses of eth senders rebounded
On July 26, the number of active addresses of eth reached a peak of 1.178 million, which means that the trading heat shows signs of rapid warming. Among them, the number of active addresses of the sending address changes greatly, while the number of active addresses of the receiving address changes limited. The number of active addresses of sending addresses soared by 114%. Based on this, it is very clear to judge the trend of main active trading, but more investors are passive recipients of eth. Therefore, the main force or a large number of changes in the short term, reducing the opportunity for a substantial increase in prices. The number of active trading addresses increased, and attention was paid to the performance of eth at the pressure level of $1600 and $1910.