Shortly after last week's report concluded, Bitcoin once fell to around $60,000. Many friends sent me private messages expressing concern about Bitcoin's future trend. For investors who had positioned near $80,000 or earlier, the pressure from paper losses is undeniable—I completely understand this sentiment. We have all, to varying degrees, experienced similar moments in different cycles: anxiety, helplessness, and even the choice to give up.
But it is precisely in such phases that emotions can become a greater source of risk than direction. Rather than being led by short-term fluctuations, it's better to stabilize your mindset and re-examine your positions and rhythm. Because next, the market does not rule out the possibility of a阶段性反弹 (staged rebound), and such fluctuations themselves often provide investors with a window for active adjustment: By gradually reducing risk exposure, or through more flexible and rapid波段操作 (swing trading), you can gradually average down costs, alleviate pressure, and face upcoming uncertainties with greater composure.
I hope my article can provide some new perspectives when you feel confused and lost:

Trading Weekly Report Core Summary:
• Bitcoin's internal structure division and推演 (deduction) of the下跌 C-wave initiated on January 14th. (Detailed explanation in Figure 1)
• Strategy Execution (Short-term) Effectiveness Verification: Last week's trading strictly followed the既定短线策略 (established short-term strategy), completing two short-term operations (1x leverage) and successfully achieving a cumulative return of approximately 10.72%.
• Strategy Execution (Mid-term) Effectiveness Verification: Last week followed the既定中线策略 (established mid-term strategy), continuing to hold the short position established at $89,000 (1x leverage). As of last week's close, the profit was approximately 20.97%, with a maximum profit during the period of about 32.58%.
• Core View (Short-term) Verification: Last week, under the pattern of weekly and daily bearish共振 (resonance), the price successively broke through multiple support levels, finally finding support near $60,000. The market movement aligned with our previous expectations for the C-wave adjustment.
The following will provide a detailed review of the market prediction, strategy execution, and specific trading process.
I. Analysis of Bitcoin's Adjustment Structure and Deduction of Future C-wave Movement Structure
Bitcoin Daily K-line Chart:
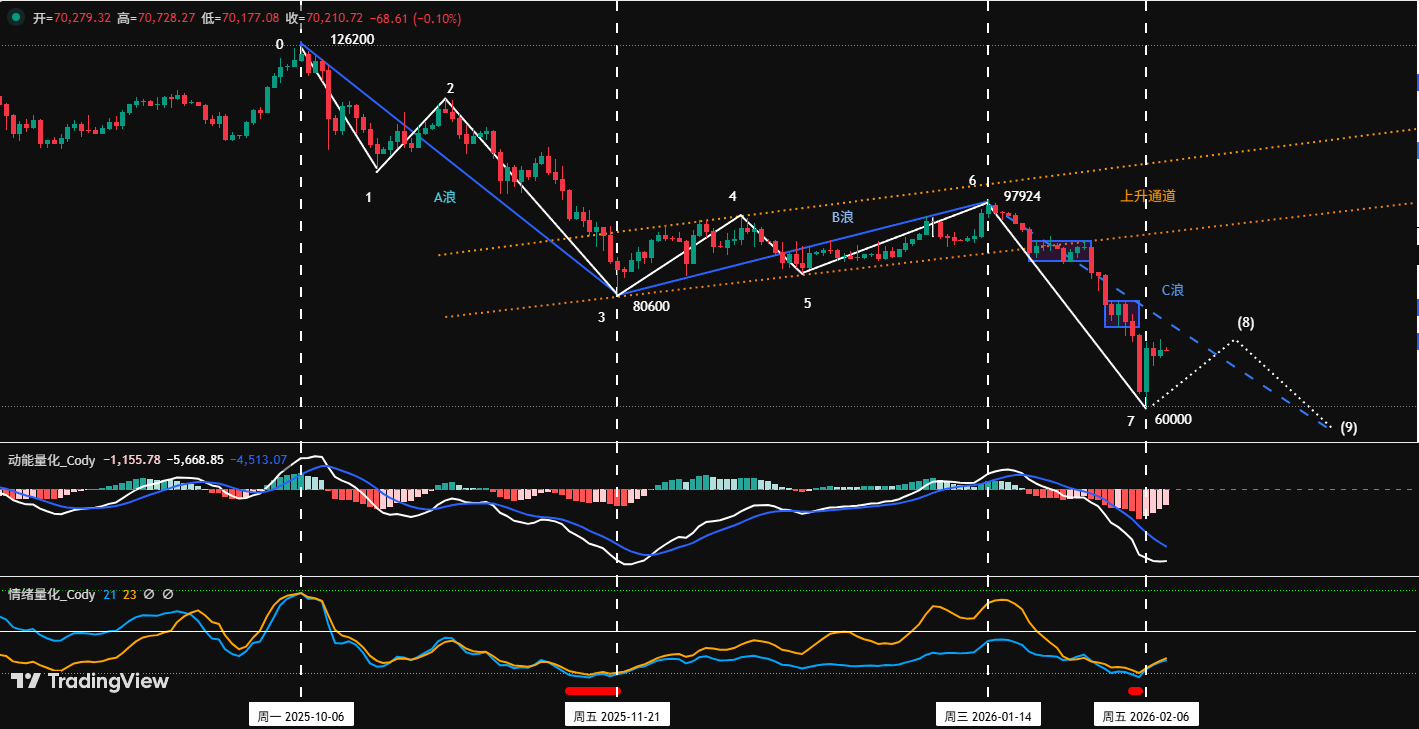
Figure 1
1. Main Structure Analysis:
Currently, the current adjustment starting from the high of $126,200 in October 2025 presents an A-B-C three-wave structure:
• A-wave (Driving Decline Wave): $126,200 (2025-10-06) to $80,600 (2025-11-21), lasting 46 days, maximum decline of 36%.
• B-wave (Rebound Correction Wave): $80,600 (2025-11-21) to $97,924 (2026-01-14), lasting 54 days, maximum increase of 21.5%.
• C-wave (Main Decline Wave): $97,924 (January 14) to present, lasting 25 days, maximum decline of 38.7%.
2. Sub-structure Analysis: Fine剖析 (Analysis) of Impulse and Corrective Waves
1. The internal A-wave can be decomposed into a 3-segment structure, namely segment 0-1, segment 1-2, segment 2-3:
• Segment 0-1: $126,200 (2025-10-06) to $103,528 (2025-10-17), lasting 11 days.
• Segment 1-2: $103,528 (2025-10-17) to $116,400 (2025-10-27), lasting 10 days.
• Segment 2-3: $116,400 (2025-10-27) to $80,600 (2025-11-21), lasting 25 days. (Note: Corrected apparent date inconsistency in original)
2. The internal B-wave can be decomposed into a 3-segment structure, namely segment 3-4, segment 4-5, segment 5-6:
• Segment 3-4: $80,600 (2025-11-21) to $94,589 (2025-12-09), lasting 18 days.
• Segment 4-5: $94,589 (2025-12-09) to $84,450 (2025-12-18), lasting 9 days.
• Segment 5-6: $84,450 (2025-12-18) to $97,924 (2026-01-14), lasting 17 days.
3. Deduction of the internal movement structure of the C-wave, divided into the following three forms:
First Movement Structure Deduction (High Probability): C-wave internal structure presents as 3 segments
• Segment 6-7 (First Round Driving Decline), target completed: $97,924 (2026-01-14) to $60,000 (2026-02-06), lasting 23 days, maximum decline 38.7%. (Judging by adjustment time and decline, $60,000 has a high probability of being the low point of the first segment within the C-wave)
• Segment 7-8 (Expected Rebound): Dotted line part in the figure, the rebound segment that is about to or has already started. The rebound height is unlikely to exceed $97,924 (the B-wave peak). Key resistance areas to watch are the $72,000-74,500 zone and the higher $80,000-80,600 zone.
• Segment 8-9 (Final Decline Segment): Dotted line part in the figure, will initiate the final drop. Its theoretical target range can be projected by measuring the A-wave amplitude. The $60,000 level will be broken in the future, and the price will test lower technical support levels.
Second Movement Structure Deduction (Low Probability): C-wave internal structure presents as 5 segments or more complex structure
This scenario is based on the completion of the first 3-segment structure, but the market still lacks clear bottom reversal signals, requiring judgment based on the adjustment intensity and movement structure type at that time. It implies a significantly extended adjustment time, potentially evolving into complex structures like a "falling wedge" or "multiple three-waves." This path is usually triggered by持续恶化 (deteriorating) macro conditions or market liquidity drying up. Its probability is relatively small in the current environment but cannot be completely ruled out.
Third Movement Structure Deduction (Very Low Probability): V-shaped reversal, adjustment ended, reversal begins
• Segment 6-7 (First Round Driving Decline), target completed: $97,924 (2026-01-14) to $60,000 (2026-02-06).
• Segment 7-8 (V-shaped Reversal): Dotted line part in the figure. The rebound is exceptionally strong, not only effectively breaking above the previous high of $97,924 but also sustaining above it, accompanied by significant positive news in the financial markets. If this occurs, it means the entire A-B-C three-wave adjustment starting from $126,200 may have ended in a "simplified form" at $60,000. Although the probability is extremely low, its trigger condition (strong break above $97,924) is clear and discernible, serving as a key observation signal for trend reversal.
In summary, the above three movements are merely deductions based on market behavior logic, not inevitable paths. Regardless of how the market evolves, always remember the principle: "The market is always right."
II. Review of Last Week's Bitcoin Operation Strategy and Key Levels: (02.02~02.08)
1. Short-term Operation Strategy Review: As shown in (Figure 2)
We strictly followed the trading signals issued by our self-constructed Spread Trading Model and Momentum Quantification Model, combined with market movement predictions, and completed two short-term operations, achieving a cumulative profit of 10.72%.
Specific transaction details and review are as follows:
1. Short-term Trading Results Display: (Leverage *1)
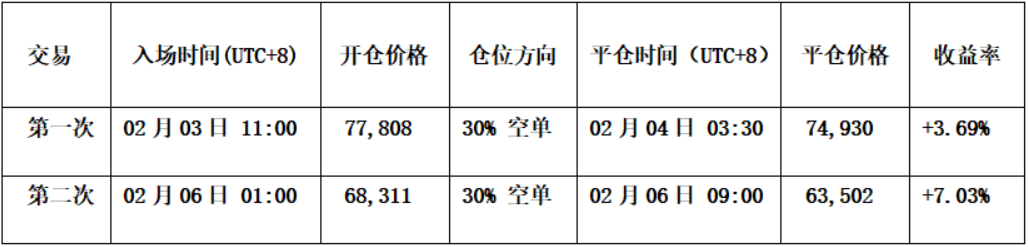
Figure 2
2. Short-term Trading Review:
• First Trade (Profit 3.69%):
• Entry: Rejection at the $80,000 pressure level,叠加 (superimposed) with two model short-selling共振 (resonance) signals. Established a 30% short position at $77,808.
• Risk Control: Initial stop-loss for the short position at $81,000.
• Closing: Fell near the $74,500 support level,叠加 (superimposed) with the spread model bottom signal (red dot) and K-line组合 (combination) bottom signal. Closed all positions at $74,930.
• Second Trade (Profit 7.03%):
• Entry: Rejection at the $69,000 pressure level,叠加 (superimposed) with two model short-selling共振 (resonance) signals. Established a 30% short position at $68,311.
• Risk Control: Initial stop-loss for the short position at $71,000.
• Closing: Fell near the $63,000 support level,叠加 (superimposed) with two model bottom共振 (resonance) signals. Closed all positions at $63,502.
Bitcoin 30-minute K-line Chart: (Momentum Quantification Model + Spread Trading Model)
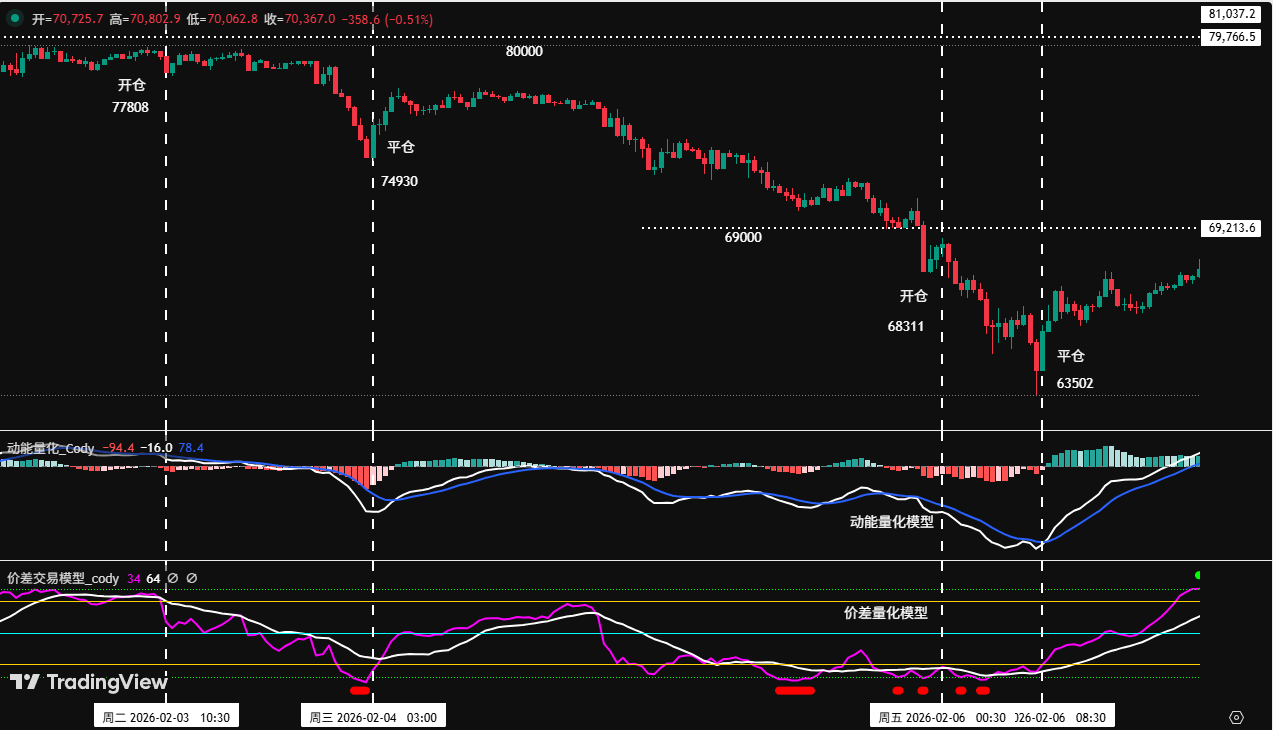
Figure 3
2. Mid-term Operation Strategy Review:
Mid-term Strategy: Continued holding the 60% short position established near $89,000 as planned.
3. Last Week's Core Level Review:
Resistance level watched the $80,000~$80,600 area;
First support level watched the $72,000-74,500 zone, second support level watched the $69,000-72,500 zone. (Note: Corrected apparent typo $72,500 vs likely intended $62,500? Context suggests $62,500 from later section, but translated as written)
III. Technical Indicator Analysis of Bitcoin's This Week's Movement: (02.09~02.15)
Combining market operation, the author conducts an in-depth analysis of Bitcoin's movement structure from multiple models and dimensions based on a self-constructed trading system.
1. As shown in (Figure 4), analysis from the weekly chart:
Bitcoin Weekly K-line Chart: (Momentum Quantification Model + Sentiment Quantification Model)
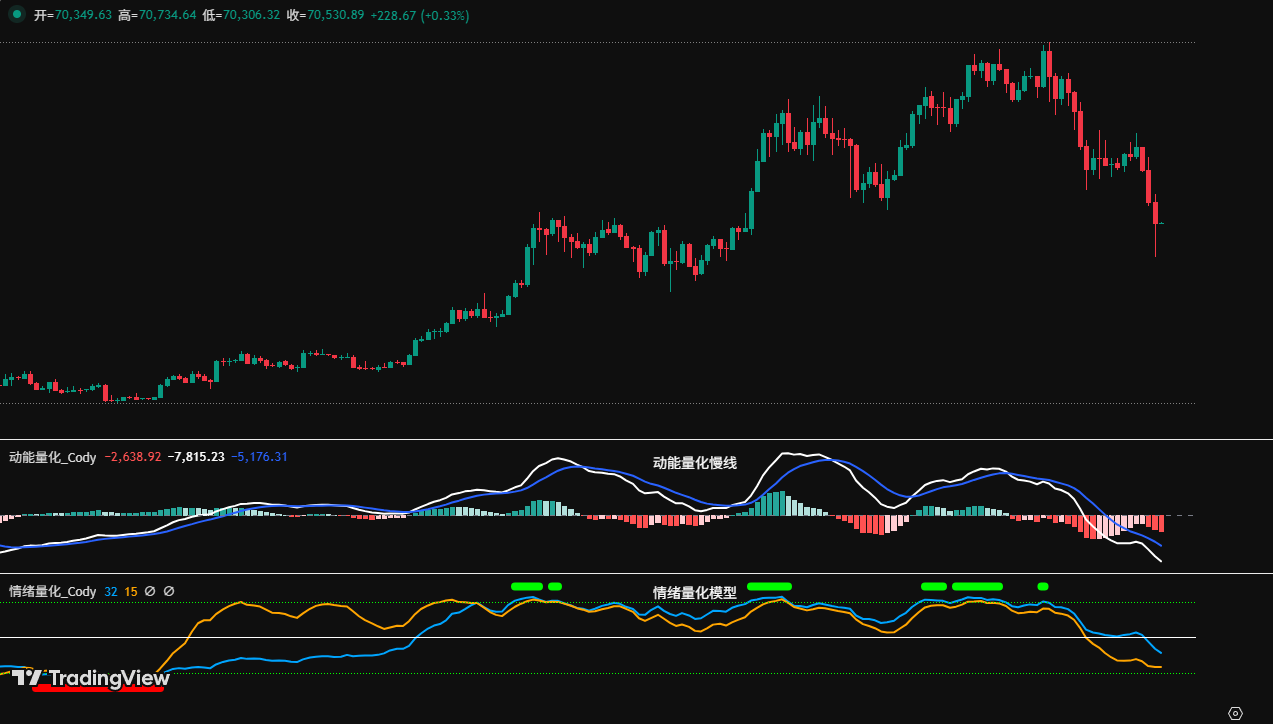
Figure 4
• Momentum Quantification Model: Technical indicators show that last week's selling momentum further released. The two momentum lines declined synchronously, and the negative energy柱 (column) gradually放大 (expanded), showing an accelerating adjustment state.
Momentum Quantification Model Indicates: Price Decline Index: High
• Sentiment Quantification Model: Blue sentiment line value 38, intensity zero; Yellow sentiment line value 11, intensity zero; Peak value is 0.
Sentiment Quantification Model Indicates: Price Bottom Support Index: Neutral
• Digital Monitoring Model: No (top/bottom) digital signals detected.
Digital Monitoring Model Indicates: Bottom signal not appeared; Weekly K-line closed as a long-lower-shadow big阴线 (bearish candle), decline about 8.63%.
The above data indicates: Bitcoin weekly trend is bearish, but short-term selling momentum shows signs of weakening.
2. As shown in (Figure 5), analysis from the daily chart:
Bitcoin Daily K-line Chart: (Momentum Quantification Model + Sentiment Quantification Model)
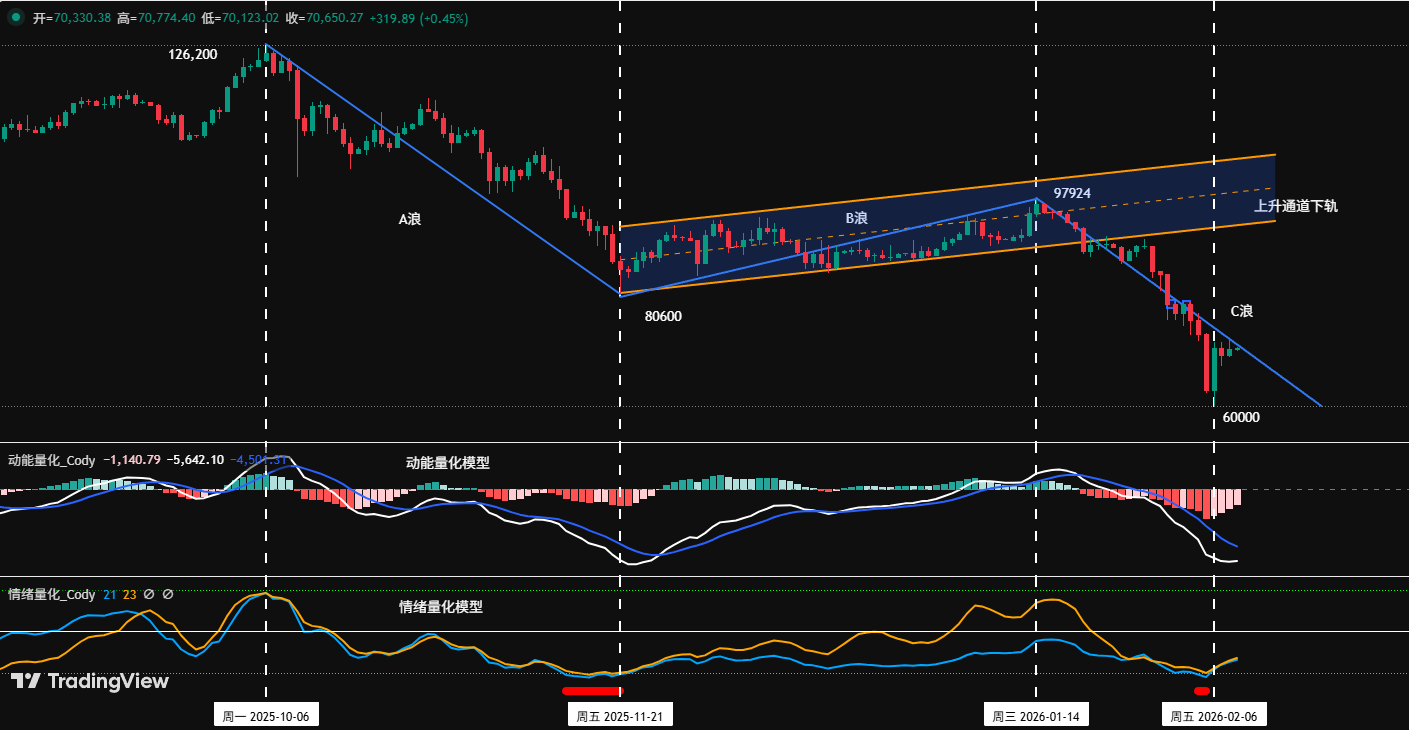
Figure 5
• Momentum Quantification Model: Last week overall presented an "accelerated decline -触底反弹 (touched bottom and rebounded)" pattern. After Sunday's close, the white momentum line's decline slowed, and the negative energy column gradually萎缩 (contracted) for 3 consecutive days.
Momentum Quantification Model Indicates: Daily level bearish trend, bulls beginning to resist.
• Sentiment Quantification Model: After last Sunday's close, the sentiment model triggered a bottom预警信号 (early warning signal) (red dot), after which the two sentiment lines began to turn upward.
Sentiment Quantification Model Indicates: Support strength is gradually increasing.
The above data suggests: The daily level remains bearish, but a short-term bottom预警信号 (early warning signal) was triggered, and a short-term rebound has begun.
IV. This Week's Market Prediction: (02.09~02.15)
1. This Week's Core View: Observe whether last week's low of $60,000 is broken. Pay attention to the strength of the oversold rebound starting from this point. (If the price breaks below $60,000, then the细分 (subdivided) C-wave segment 6-7 adjustment is still ongoing, and the rebound triggered from point 7 has not yet started.)
2. Core Resistance Levels:
• First Resistance Area: $72,000-74,500 area (near last April's low)
• Second Resistance Area: $80,000-80,600 area (near the B-wave starting point)
3. Core Support Levels:
• First Support Level: $60,000-62,500 area (near the recent adjustment low)
• Second Support Level: Near $57,400 (near the 210-week moving average)
• Important Support Level: Near $52,500 (near the symmetrical point of 1x A-wave decline amplitude)
V. This Week's Operation Strategy (Excluding Impact of Sudden News): (02.09~02.15)
1. Mid-term Strategy: Maintain 60% short position. If the rebound effectively breaks above $74,500, reduce the position to 40%.
2. Short-term Strategy: Utilize 30% of capital, set stop-loss points, and look for "spread" opportunities based on support and resistance levels. (Use 30-minute/60-minute as operation cycle).
3. Operationally, to dynamically respond to market changes combined with real-time model signals, we have formulated A/B two sets of short-term operation plans:
• Plan A: If the price rebounds and encounters resistance in the $74,500~$75,200 area:
• Entry: When the rebound encounters resistance in this area triggering a signal, combined with a model top signal, establish a 15% short position.
• Risk Control: Initial stop-loss for the short position set about 1.5% above the entry price (i.e., 1.015 * entry price).
• Closing: When falling near important support levels and combined with model signals, gradually close positions to take profits.
• Plan B: If the price rebounds and encounters resistance in the $80,000~$80,600 area:
• Entry: When the rebound encounters resistance in this area, combined with a model top signal, establish a 30% short position.
• Risk Control: Initial stop-loss for the short position set about 1.5% above the entry price (i.e., 1.015 * entry price).
• Closing: When下跌 (falling) to support levels and combined with model signals, gradually close positions to take profits.
VI. Special Notes:
1. When opening a position: Immediately set the initial stop-loss level.
2. When profit reaches 1%: Move the stop-loss to the entry cost price (breakeven point), ensuring capital safety.
3. When profit reaches 2%: Move the stop-loss to the position of 1% profit.
4. Continuous Tracking: Thereafter, for every additional 1% profit the price makes, move the stop-loss同步 (synchronously) by 1%, dynamically protecting and locking in profits.


