Bitcoin Sell-Side Risk Ratio Falls To Lowest Since Oct ’23: What It Means

bitcoinistPublished on 2026-01-14Last updated on 2026-01-14

Abstract

Bitcoin's Sell-Side Risk Ratio has recently plummeted to its lowest level since October 2023, indicating subdued investor conviction behind selling at current price levels. This on-chain metric, which measures the ratio of realized profits and losses against Bitcoin's Realized Cap, had spiked during November's price crash but has since declined sharply. The drop suggests reduced market activity and lower volatility. Additionally, retail investor demand remains weak, with a key metric tracking small transactions staying negative despite recent price gains. At the time of writing, Bitcoin is trading around $94,300, up over 3% in 24 hours.

On-chain data shows the Bitcoin Sell-Side Risk Ratio has plummeted recently. Here’s what this could suggest for the cryptocurrency.

Bitcoin Sell-Side Risk Ratio Has Fallen To Multi-Year Lows

In a new post on X, Glassnode analyst Chris Beamish has talked about the latest trend in the Bitcoin Sell-Side Risk Ratio, an on-chain indicator that keeps track of the ratio between the sum of all profits and losses realized on the network and the cryptocurrency’s Realized Cap.

The Realized Cap here refers to a capitalization model that calculates BTC’s total value by assuming that the value of each coin in circulation is equal to the price at which it was last transacted on the blockchain.

The last transfer price of any token is likely to represent its cost basis, so the Realized Cap measures the sum of the cost bases of the total BTC supply. In other words, it represents the total amount of capital that the investors have put into the cryptocurrency.

As such, the Sell-Side Risk Ratio tells us about how the amount of profit and loss that Bitcoin investors are realizing compares against the total capital stored in the asset.

Now, here is the chart for the indicator shared by Beamish that shows how its value has changed over the last few years:

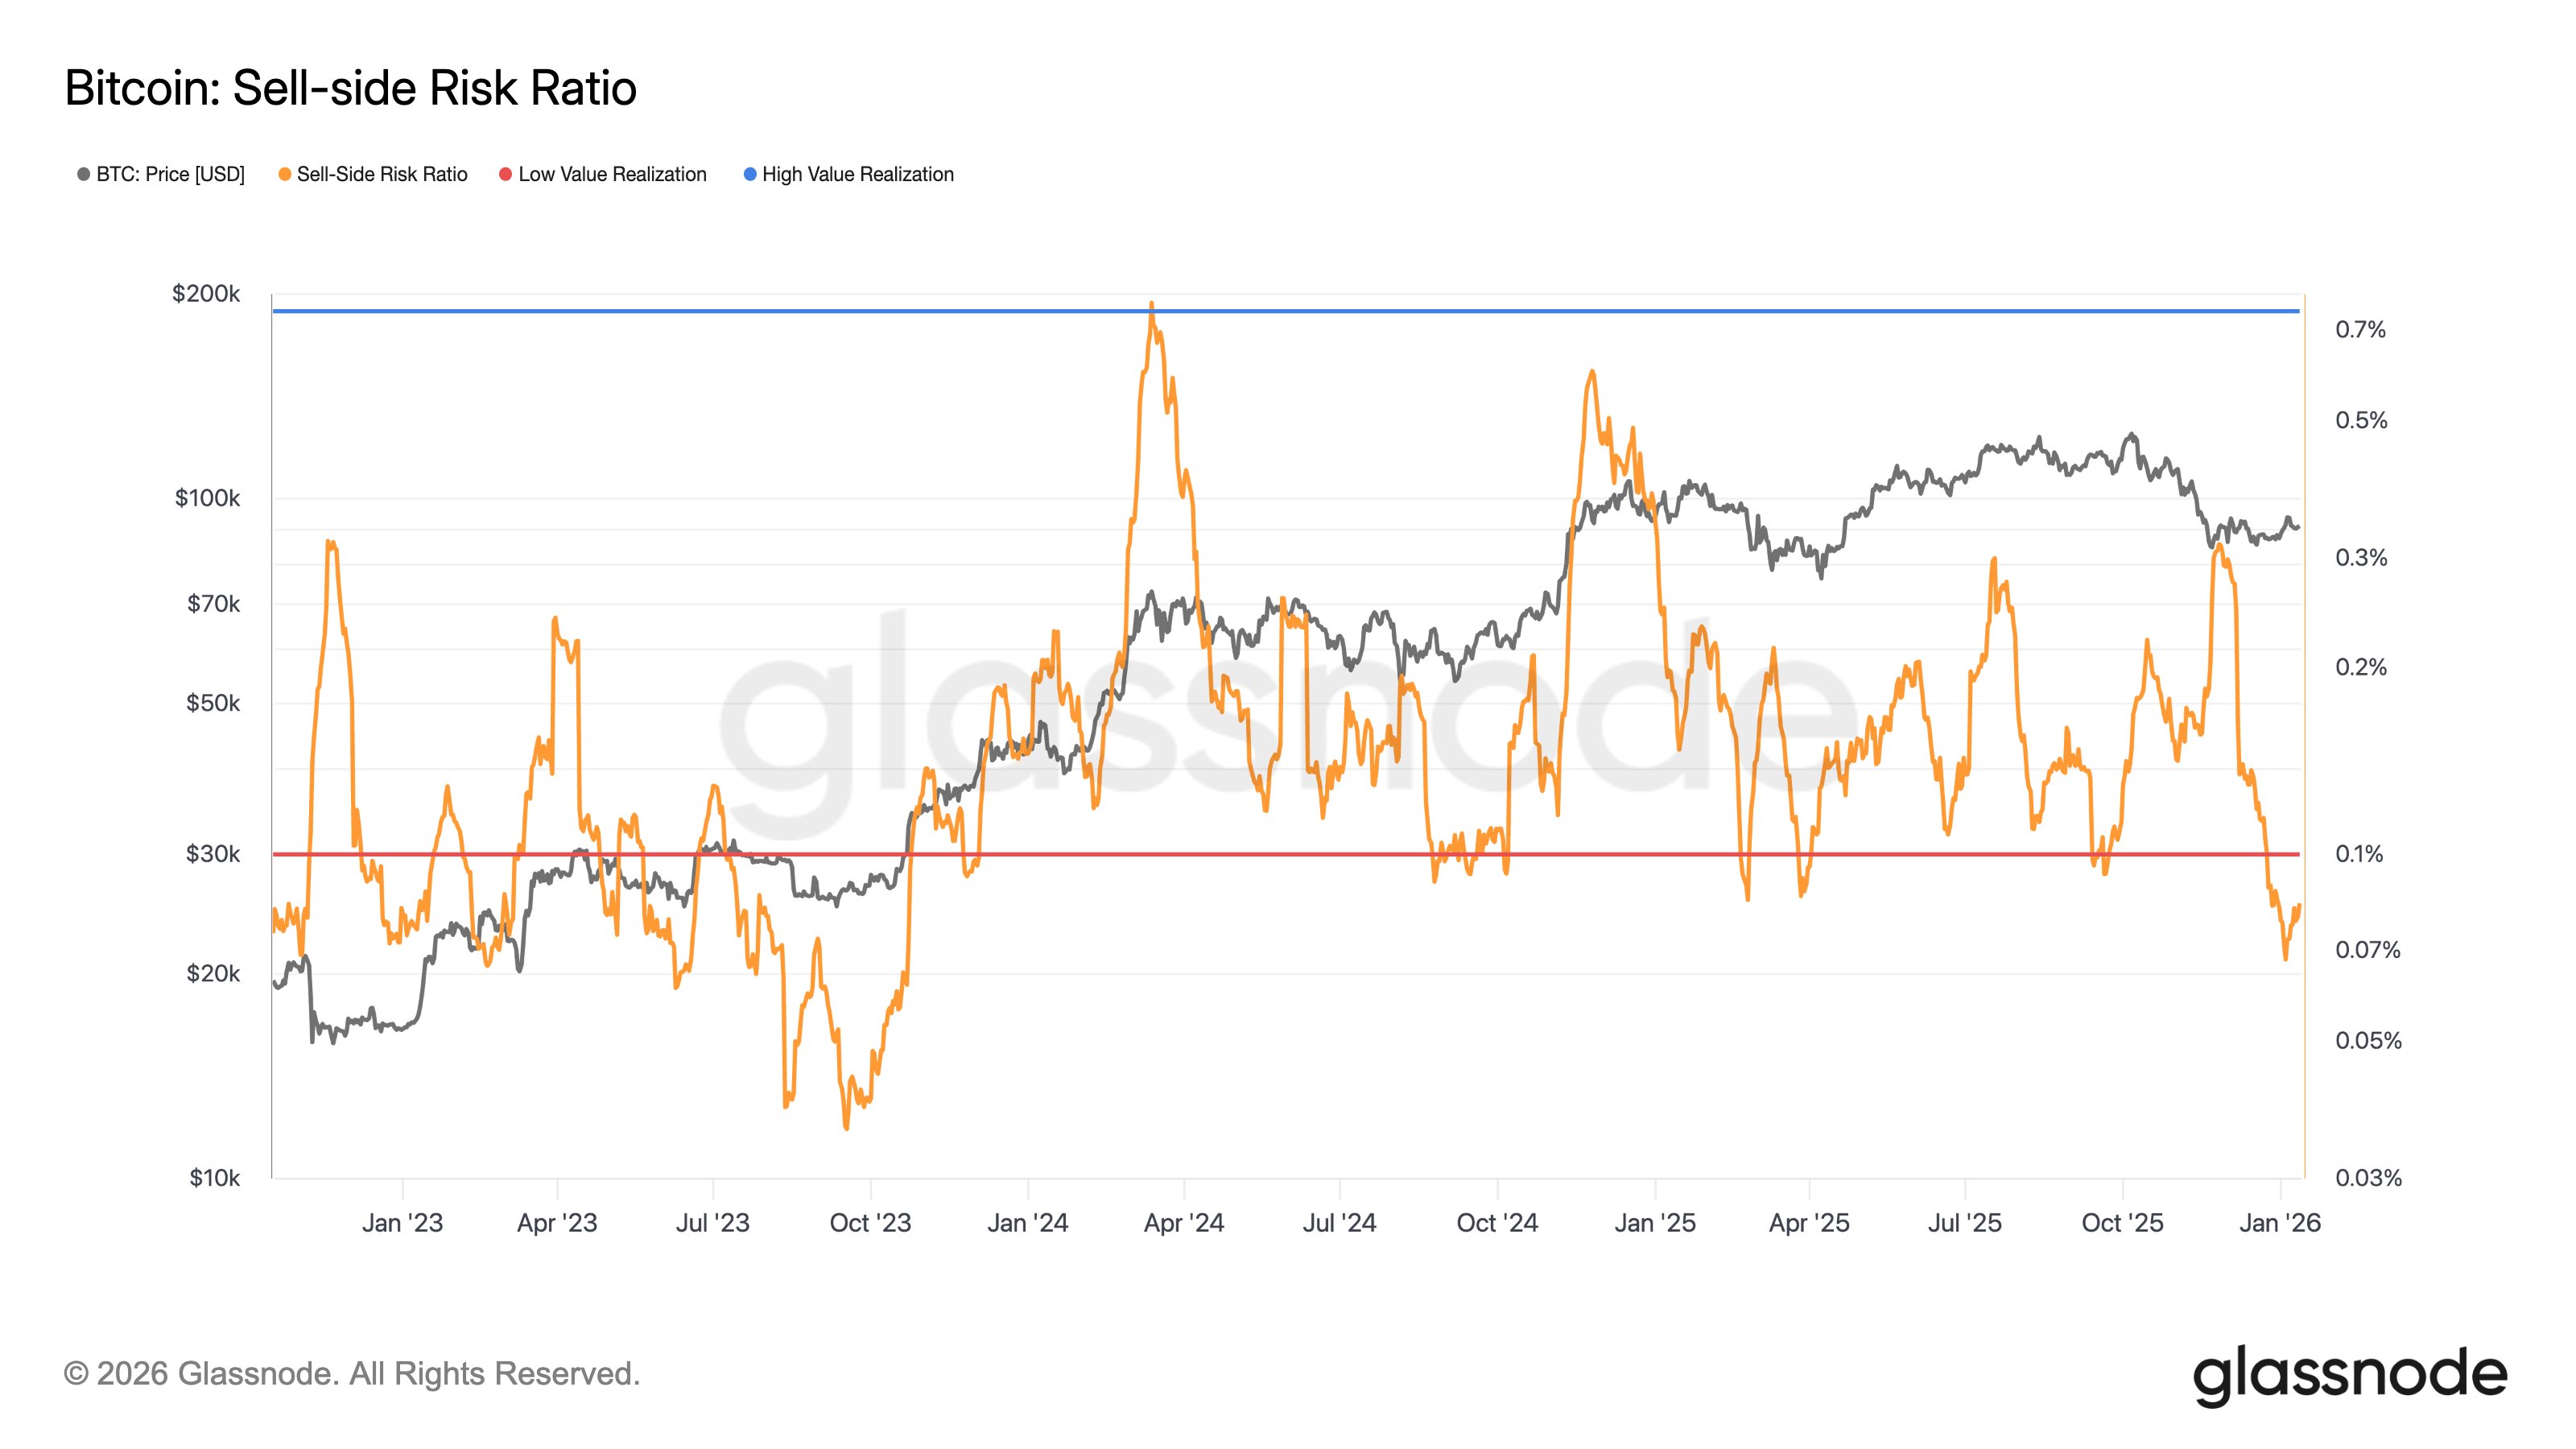
The value of the metric seems to have plummeted in recent weeks | Source: @ChrisBeamish_ on X

As displayed in the above graph, the Bitcoin Sell-Side Risk Ratio shot up to a notable value with the price crash in November. This suggests that investors took a large amount of profit and loss alongside the volatility.

Since this high, the indicator’s value has seen a steep drop and has returned to the lowest level since October 2023. The analyst has noted that this points to “subdued conviction behind distribution at current price levels.”

Typically, market volatility tends to be low when these conditions form, so it only remains to be seen how the price of the cryptocurrency will develop in the near future.

In some other news, demand from the Bitcoin retail investors has been missing recently, as CryptoQuant author IT Tech has pointed out in an X post. The indicator cited by IT Tech is the 30-day change in the Retail Investor Demand, measuring the percentage change in the volume associated with the small hands (transactions valued at less than $10,000).

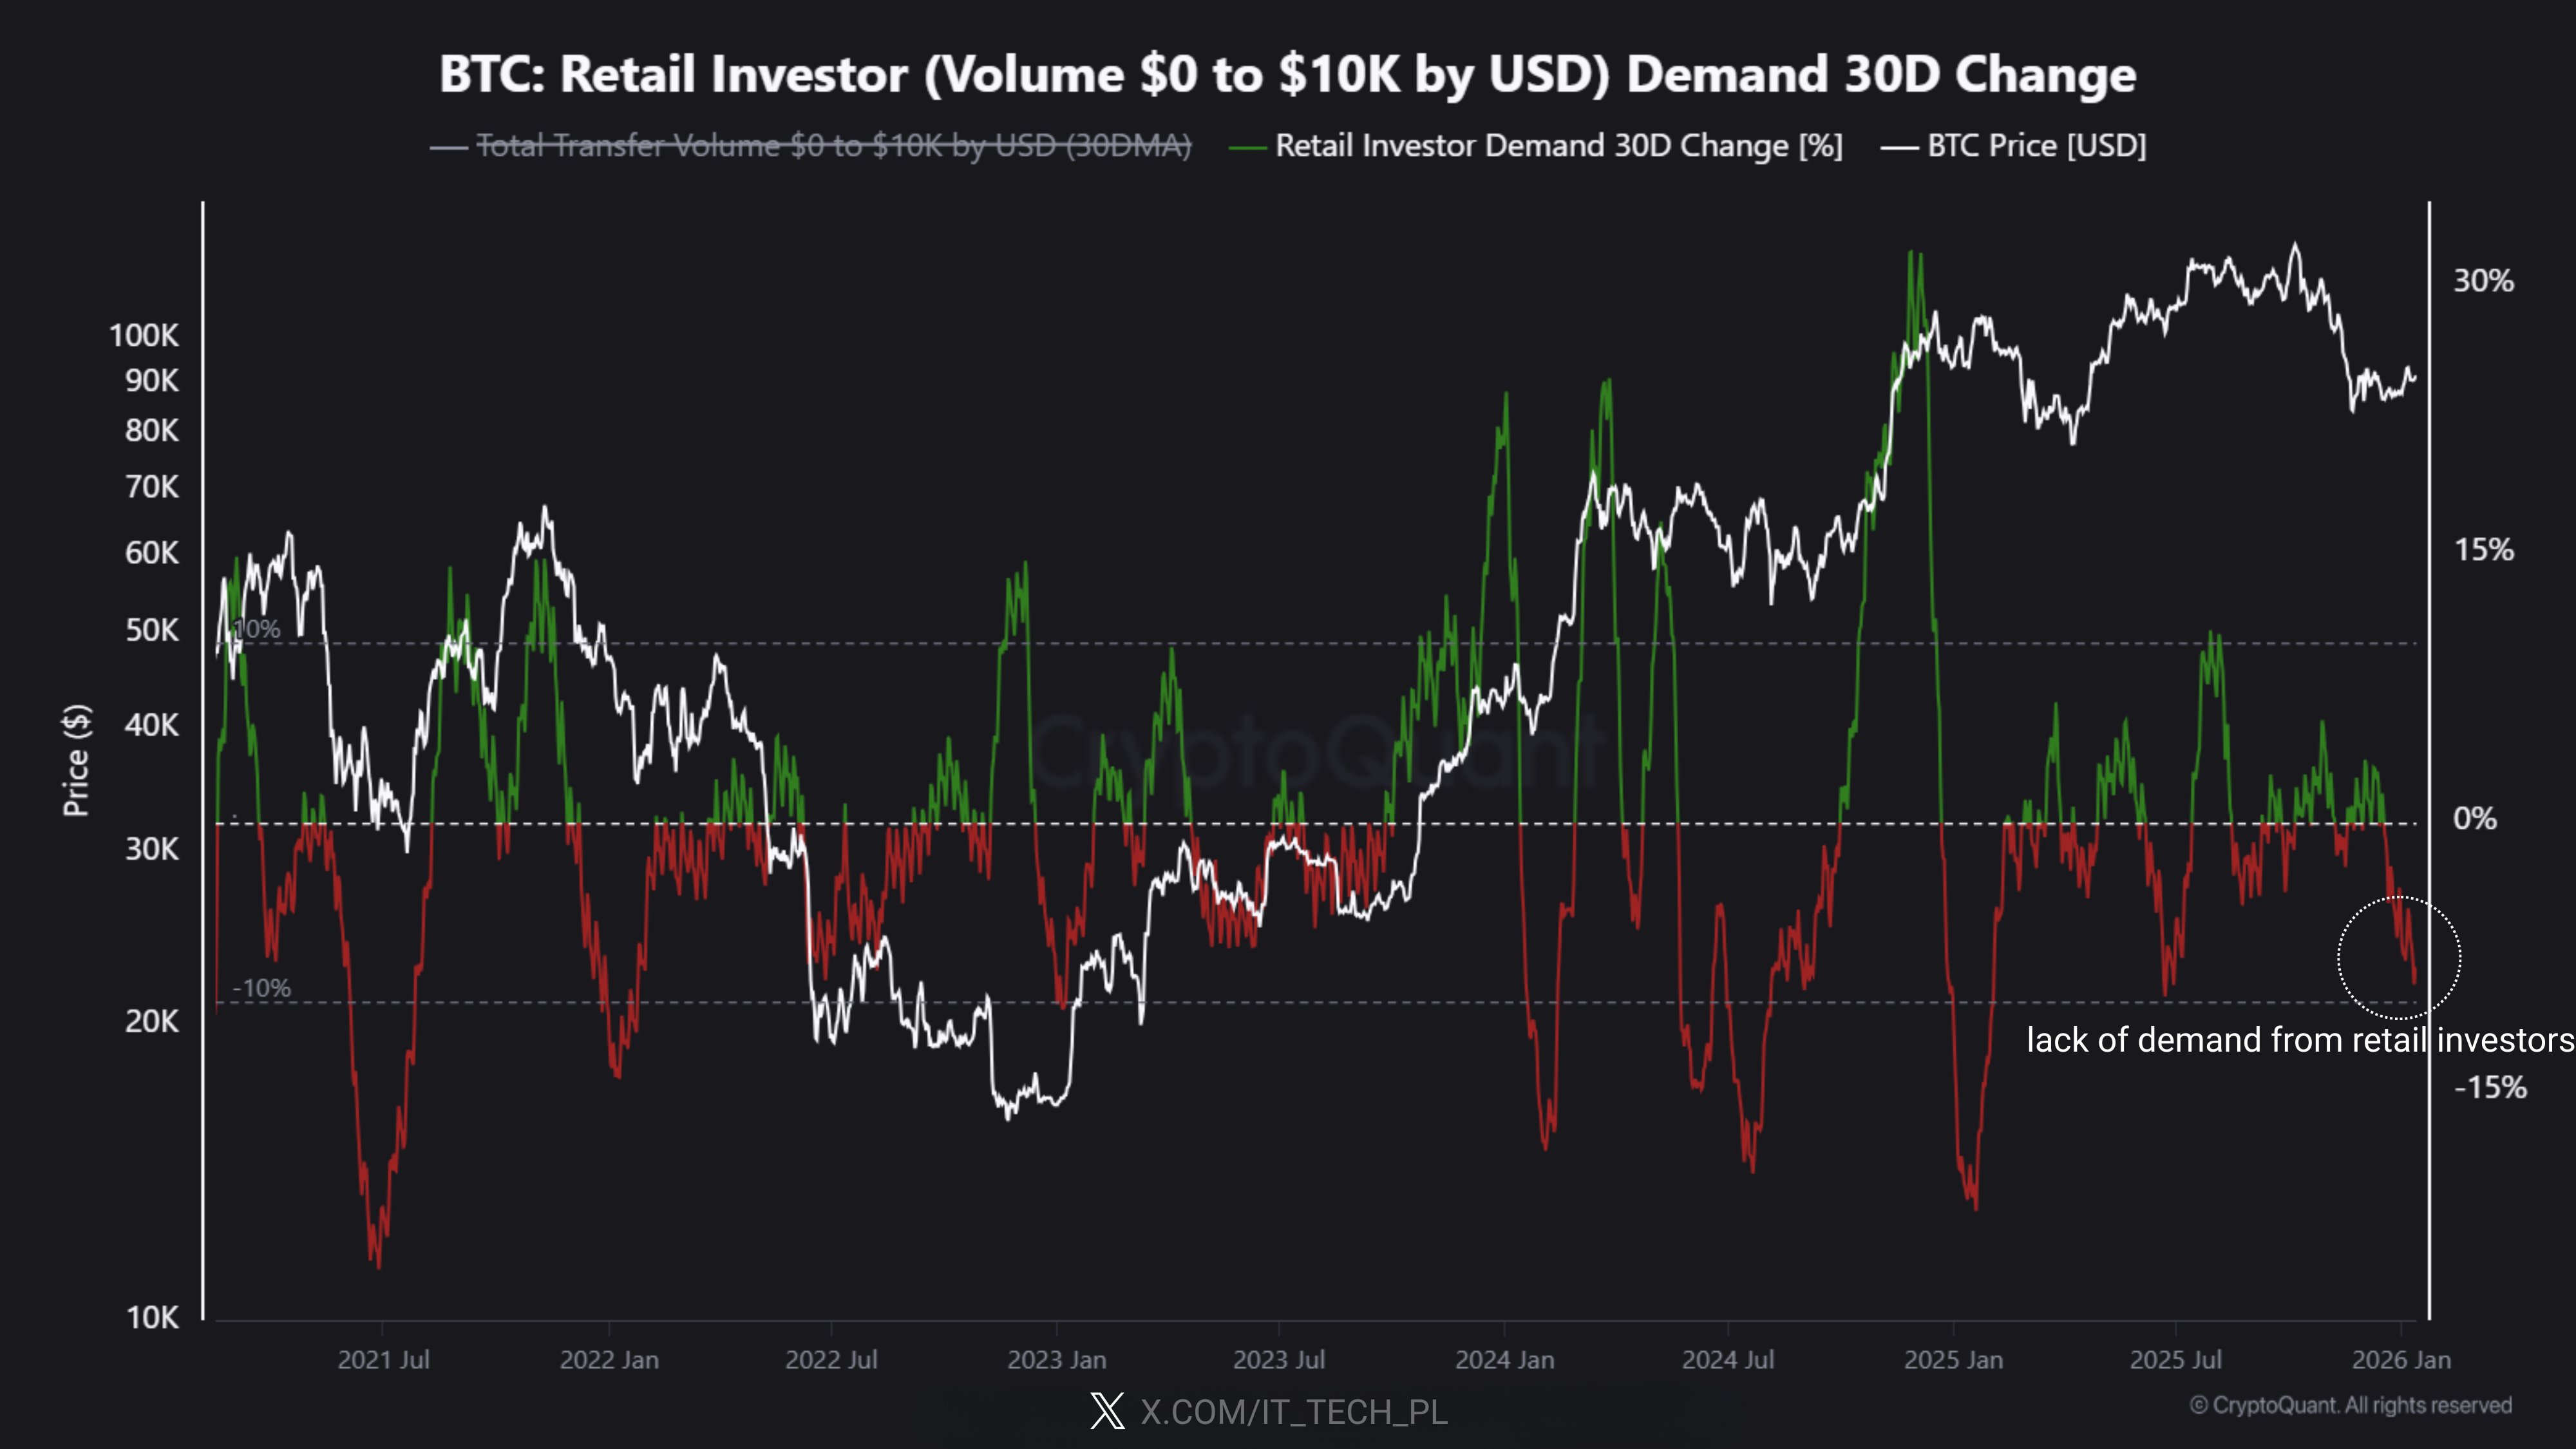
Looks like the value of the indicator has been negative recently | Source: @IT_Tech_PL on X

As is visible in the chart, the 30-day change in the Bitcoin Retail Investor Demand has been declining inside the negative zone recently, implying that the activity of the retail entities has been going down. The indicator’s trend hasn’t changed even after the recent recovery surge.

BTC Price

At the time of writing, Bitcoin is trading around $94,300, up more than 3% over the last 24 hours.

The trend in the price of the coin over the last month | Source: BTCUSDT on TradingView

Related Questions

QWhat is the Bitcoin Sell-Side Risk Ratio and what does it measure?

AThe Bitcoin Sell-Side Risk Ratio is an on-chain indicator that tracks the ratio between the sum of all profits and losses realized on the network and Bitcoin's Realized Cap. It measures how the amount of profit and loss that Bitcoin investors are realizing compares against the total capital stored in the asset.

QWhat does the recent drop in Bitcoin Sell-Side Risk Ratio to October 2023 lows indicate?

AThe recent drop in the Bitcoin Sell-Side Risk Ratio to the lowest level since October 2023 indicates 'subdued conviction behind distribution at current price levels,' suggesting reduced selling pressure and typically low market volatility during such conditions.

QWhat is Bitcoin's Realized Cap and how is it calculated?

ABitcoin's Realized Cap is a capitalization model that calculates BTC's total value by assuming that the value of each coin in circulation is equal to the price at which it was last transacted on the blockchain. It represents the sum of the cost bases of the total BTC supply, measuring the total amount of capital investors have put into the cryptocurrency.

QWhat does the trend in Bitcoin Retail Investor Demand indicate according to the article?

AAccording to the article, the 30-day change in Bitcoin Retail Investor Demand has been declining in the negative zone recently, indicating that retail investor activity (transactions valued at less than $10,000) has been decreasing, and this trend hasn't changed even after the recent price surge.

QWhat was Bitcoin's price at the time of writing and how much had it increased?

AAt the time of writing, Bitcoin was trading around $94,300, up more than 3% over the last 24 hours.

Related Reads

U.S. Stock Market Trend: Nasdaq Plunges 3.5% Intraday Before a Remarkable Recovery, All Eyes on CPI Tomorrow

"US Stock Market Trends: Nasdaq Plunges 3.5% Before Dramatic Recovery, Eyes on Tomorrow's CPI" On Tuesday, US markets experienced a wild swing. The Nasdaq initially surged nearly 0.7% before plummeting to a 3.5% intraday loss following a post by Donald Trump on Truth Social. He stated that Iran had shot down a US Apache helicopter in the Strait of Hormuz and that the US "must...respond." The index, however, staged a remarkable recovery in the final two hours, closing down only 0.97%, as subsequent remarks from Trump and Vice President Vance suggested a potential Iran deal within days. The S&P 500 fell 0.26%, while the Dow Jones gained 0.17%, supported by its non-tech components. This incident marked the first loss of a US military asset since tensions with Iran escalated in late February. Despite the event, crude oil prices fell sharply (WTI -3.93%) due to expectations of a near-term deal, OPEC+ plans to increase output, and fears that strong jobs data could lead to Fed rate hikes. Market attention is now laser-focused on the May CPI data release Wednesday morning. This report is seen as critical evidence for whether hot job growth is fueling inflation and will heavily influence expectations for the Federal Reserve's upcoming meeting. A hotter-than-expected reading could trigger further sell-offs, particularly in tech, while a cooler print could spark a significant rebound. The article notes a clear sector rotation, with money flowing out of tech (Nasdaq down over 5% in a week) into defensive sectors like healthcare and consumer staples. Other assets like gold and Bitcoin also remain under pressure. The overarching sentiment is one of "war fatigue," with markets desperately awaiting concrete results from the prolonged Iran negotiations rather than reacting to each new headline.

marsbit10m ago

U.S. Stock Market Trend: Nasdaq Plunges 3.5% Intraday Before a Remarkable Recovery, All Eyes on CPI Tomorrow

marsbit10m ago

Second Only to GPUs and Memory: MLCCs Are Becoming the Next Billion-Dollar Windfall for AI Computing Power

After GPU and memory, MLCC (Multi-Layer Ceramic Capacitors) is emerging as the next critical component in AI compute, potentially a multi-billion-dollar market. The article highlights a significant, industry-wide price increase for MLCCs, driven not by inventory cycles but by a fundamental, structural demand surge from AI and automotive sectors. AI servers require exponentially more MLCCs than traditional servers—from 2,000 to over 350,000 units per high-end AI rack—primarily to stabilize power for increasingly powerful, low-voltage GPUs. A key AI server's MLCC cost can reach thousands of dollars, making it the third-largest cost component after GPUs and memory. This demand is compounded by the automotive shift to EVs and advanced ADAS. Supply, however, struggles to keep up. Manufacturing high-end MLCCs involves extreme precision and faces six major barriers: proprietary technology, long customer certification cycles (12-18 months for AI), high capital intensity, patent thickets, specialized talent, and massive scale. Industry capacity grows at only ~10% annually, creating a persistent supply-demand gap projected to last until 2030. Three companies dominate this high-end market. **Murata** (40% global share) is the stable leader. **Samsung Electro-Mechanics** offers the highest growth elasticity with aggressive expansion. **Taiyo Yuden** is the purest MLCC play. While their current P/E ratios appear high, they are expected to compress rapidly as earnings surge, powered by significant pricing power and operational leverage. Key risks include a potential slowdown in AI capex, high valuations, competition from Chinese manufacturers in lower tiers, yen appreciation, and consumer electronics weakness. The article concludes that MLCCs are transforming from a commoditized component into a strategic, capacity-constrained asset essential for the AI-powered future.

marsbit40m ago

Second Only to GPUs and Memory: MLCCs Are Becoming the Next Billion-Dollar Windfall for AI Computing Power

marsbit40m ago

The First to Bring an AI OS to 1.4 Billion People Might Actually Be WeChat?

WeChat has introduced a significant AI update, allowing mini-program developers to integrate their services with WeChat AI. Developers can choose an "automatic mode," where WeChat AI autonomously analyzes and operates mini-programs without additional coding, or a "development mode" for creating customized skills. This move effectively transforms WeChat's vast ecosystem—including millions of mini-programs, WeChat Pay, and official accounts—into an execution layer for AI. The technical documentation reveals that WeChat's approach aligns with industry standards like MCP (Model Context Protocol) and incorporates practical lessons from AI-agent development. Key design principles include a clear "attention weight" system for API calls and a "fact + action" response structure to ensure reliable operations. Unlike Apple's Siri, which struggles with third-party app integration, WeChat's centralized control over mini-program code provides a "God's-eye view," enabling seamless AI orchestration across services. This development revives the concept of "WeChat OS," where the app could function as a natural-language-operated platform for daily tasks—from booking flights to ordering food—all within a chat interface. While challenges remain in areas like payment security and user trust, WeChat's existing service network and massive user base position it uniquely to advance AI agents from conversation to actionable assistance, potentially making complex tasks feel effortless for its 1.432 billion monthly active users.

marsbit1h ago

The First to Bring an AI OS to 1.4 Billion People Might Actually Be WeChat?

marsbit1h ago

Trading

Spot
Futures

Hot Articles

What is $BITCOIN

DIGITAL GOLD ($BITCOIN): A Comprehensive Analysis Introduction to DIGITAL GOLD ($BITCOIN) DIGITAL GOLD ($BITCOIN) is a blockchain-based project operating on the Solana network, which aims to combine the characteristics of traditional precious metals with the innovation of decentralized technologies. While it shares a name with Bitcoin, often referred to as “digital gold” due to its perception as a store of value, DIGITAL GOLD is a separate token designed to create a unique ecosystem within the Web3 landscape. Its goal is to position itself as a viable alternative digital asset, although specifics regarding its applications and functionalities are still developing. What is DIGITAL GOLD ($BITCOIN)? DIGITAL GOLD ($BITCOIN) is a cryptocurrency token explicitly designed for use on the Solana blockchain. In contrast to Bitcoin, which provides a widely recognized value storage role, this token appears to focus on broader applications and characteristics. Notable aspects include: Blockchain Infrastructure: The token is built on the Solana blockchain, known for its capacity to handle high-speed and low-cost transactions. Supply Dynamics: DIGITAL GOLD has a maximum supply capped at 100 quadrillion tokens (100P $BITCOIN), although details regarding its circulating supply are currently undisclosed. Utility: While precise functionalities are not explicitly outlined, there are indications that the token could be utilized for various applications, potentially involving decentralized applications (dApps) or asset tokenization strategies. Who is the Creator of DIGITAL GOLD ($BITCOIN)? At present, the identity of the creators and development team behind DIGITAL GOLD ($BITCOIN) remains unknown. This situation is typical among many innovative projects within the blockchain space, particularly those aligning with decentralized finance and meme coin phenomena. While such anonymity may foster a community-driven culture, it intensifies concerns about governance and accountability. Who are the Investors of DIGITAL GOLD ($BITCOIN)? The available information indicates that DIGITAL GOLD ($BITCOIN) does not have any known institutional backers or prominent venture capital investments. The project seems to operate on a peer-to-peer model focused on community support and adoption rather than traditional funding routes. Its activity and liquidity are primarily situated on decentralized exchanges (DEXs), such as PumpSwap, rather than established centralized trading platforms, further highlighting its grassroots approach. How DIGITAL GOLD ($BITCOIN) Works The operational mechanics of DIGITAL GOLD ($BITCOIN) can be elaborated on based on its blockchain design and network attributes: Consensus Mechanism: By leveraging Solana’s unique proof-of-history (PoH) combined with a proof-of-stake (PoS) model, the project ensures efficient transaction validation contributing to the network's high performance. Tokenomics: While specific deflationary mechanisms have not been extensively detailed, the vast maximum token supply implies that it may cater to microtransactions or niche use cases that are still to be defined. Interoperability: There exists the potential for integration with Solana’s broader ecosystem, including various decentralized finance (DeFi) platforms. However, the details regarding specific integrations remain unspecified. Timeline of Key Events Here is a timeline that highlights significant milestones concerning DIGITAL GOLD ($BITCOIN): 2023: The initial deployment of the token occurs on the Solana blockchain, marked by its contract address. 2024: DIGITAL GOLD gains visibility as it becomes available for trading on decentralized exchanges like PumpSwap, allowing users to trade it against SOL. 2025: The project witnesses sporadic trading activity and potential interest in community-led engagements, although no noteworthy partnerships or technical advancements have been documented as of yet. Critical Analysis Strengths Scalability: The underlying Solana infrastructure supports high transaction volumes, which could enhance the utility of $BITCOIN in various transaction scenarios. Accessibility: The potential low trading price per token could attract retail investors, facilitating wider participation due to fractional ownership opportunities. Risks Lack of Transparency: The absence of publicly known backers, developers, or an audit process may yield skepticism regarding the project's sustainability and trustworthiness. Market Volatility: The trading activity is heavily reliant on speculative behavior, which can result in significant price volatility and uncertainty for investors. Conclusion DIGITAL GOLD ($BITCOIN) emerges as an intriguing yet ambiguous project within the rapidly evolving Solana ecosystem. While it attempts to leverage the “digital gold” narrative, its departure from Bitcoin's established role as a store of value underscores the need for a clearer differentiation of its intended utility and governance structure. Future acceptance and adoption will likely depend on addressing the current opacity and defining its operational and economic strategies more explicitly. Note: This report encompasses synthesised information available as of October 2023, and developments may have transpired beyond the research period.

363 Total ViewsPublished 2025.05.13Updated 2025.05.13

What is $BITCOIN

Discussions

Welcome to the HTX Community. Here, you can stay informed about the latest platform developments and gain access to professional market insights. Users' opinions on the price of BTC (BTC) are presented below.

活动图片