A new technical reading shows that Dogecoin’s price structure is not as weak as the surface-level price action might imply. In a recent post on X, crypto analyst Javon Marks pointed to a hidden bullish divergence forming on Dogecoin’s chart. The idea comes at a time when DOGE has been creating interesting low structures since the beginning of the year and momentum indicators are at multi-year lows across the altcoin market.
A Divergence Hidden in Plain Sight
While Dogecoin’s price has been carving lows since early 2026, its momentum oscillator has been registering lower lows over the same period. This split behavior, which was noted by crypto analyst Javon Marks, where price and momentum move in opposing directions, is the definition of hidden bullish divergence.
The chart is showing that even though momentum readings look weaker on paper, Dogecoin itself has not broken down in the same way. That disconnect can suggest that sellers are losing control beneath the surface. The 8-day candlestick price chart below shows that DOGE has been holding above a broad support zone around the $0.09 region for the past five or six weeks, maintaining a sequence of higher lows.
Below that price action are the oscillator and RSI panels, which are both showing descending lows, marked out as a bearish-looking momentum trend that has not translated into a matching collapse in price. That mismatch is what gives the divergence its bullish interpretation, and the outlook in this case is a bullish run to yearly highs.
The RSI has declined into the high 30s to low 40s range, a region shaded in pink on the chart, which aligns with levels seen during the accumulation phase of 2023 and early 2024 before Dogecoin’s major rally
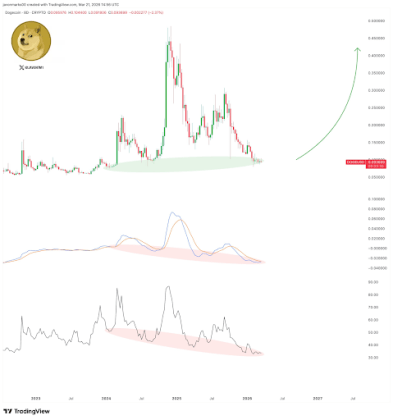
Dogecoin Price Chart. Source: @JavonTM1 On X
Room For A Move Above $0.44
The chart above also shows why the current area around $0.09 matters so much. Dogecoin has spent recent months bleeding from its late-2024 and early-2025 highs, but that descent has now slowed into a tight cluster of candles near the same support shelf at $0.09.
The Dogecoin price is no longer falling in the same way seen during the first two months of 2026 but is now stabilizing. As long as Dogecoin continues to defend that $0.09 range and avoids losing its higher-low structure, the case for a continuation move will still be alive.
The most ambitious part of the analysis is the upside projection. According to Marks, the continuation implied by this hidden bullish divergence could send Dogecoin on a rally of more than 350%. Projecting this percentage gain would see the Dogecoin price breaking above $0.44.