Solana flashes buy signal, but key resistance levels keep recovery in check

ambcrypto發佈於 2026-07-15更新於 2026-07-15

文章摘要

Crypto trading volumes have been declining since July 2024, hitting their lowest two-year average, indicating weak demand and low market confidence. This thin liquidity can lead to sharp price moves. Against this backdrop, analyst Ali Martinez notes that Solana (SOL) has flashed a bullish buy signal on the 3-day chart using the SuperTrend indicator, with key levels to watch at $96 and $121. Furthermore, long-term holder data shows consistent accumulation throughout 2026. However, SOL's broader price structure remains bearish, having broken previous swing lows. Key resistance levels from Fibonacci analysis are at $83.79 and $90.22, with the $116 realized price level posing a major overhead supply hurdle. Recent large on-chain token movements, such as a $15.14 million transfer from Alameda Research, have also contributed to selling pressure and liquidations. In summary, while recent signals and holder activity offer a bullish near-term case, significant resistance levels and weak market-wide capital flows continue to challenge a sustained SOL recovery.

The trading volumes of the top crypto assets have been dwindling since July 2024, wrote the analytics platform Santiment in a post on X.
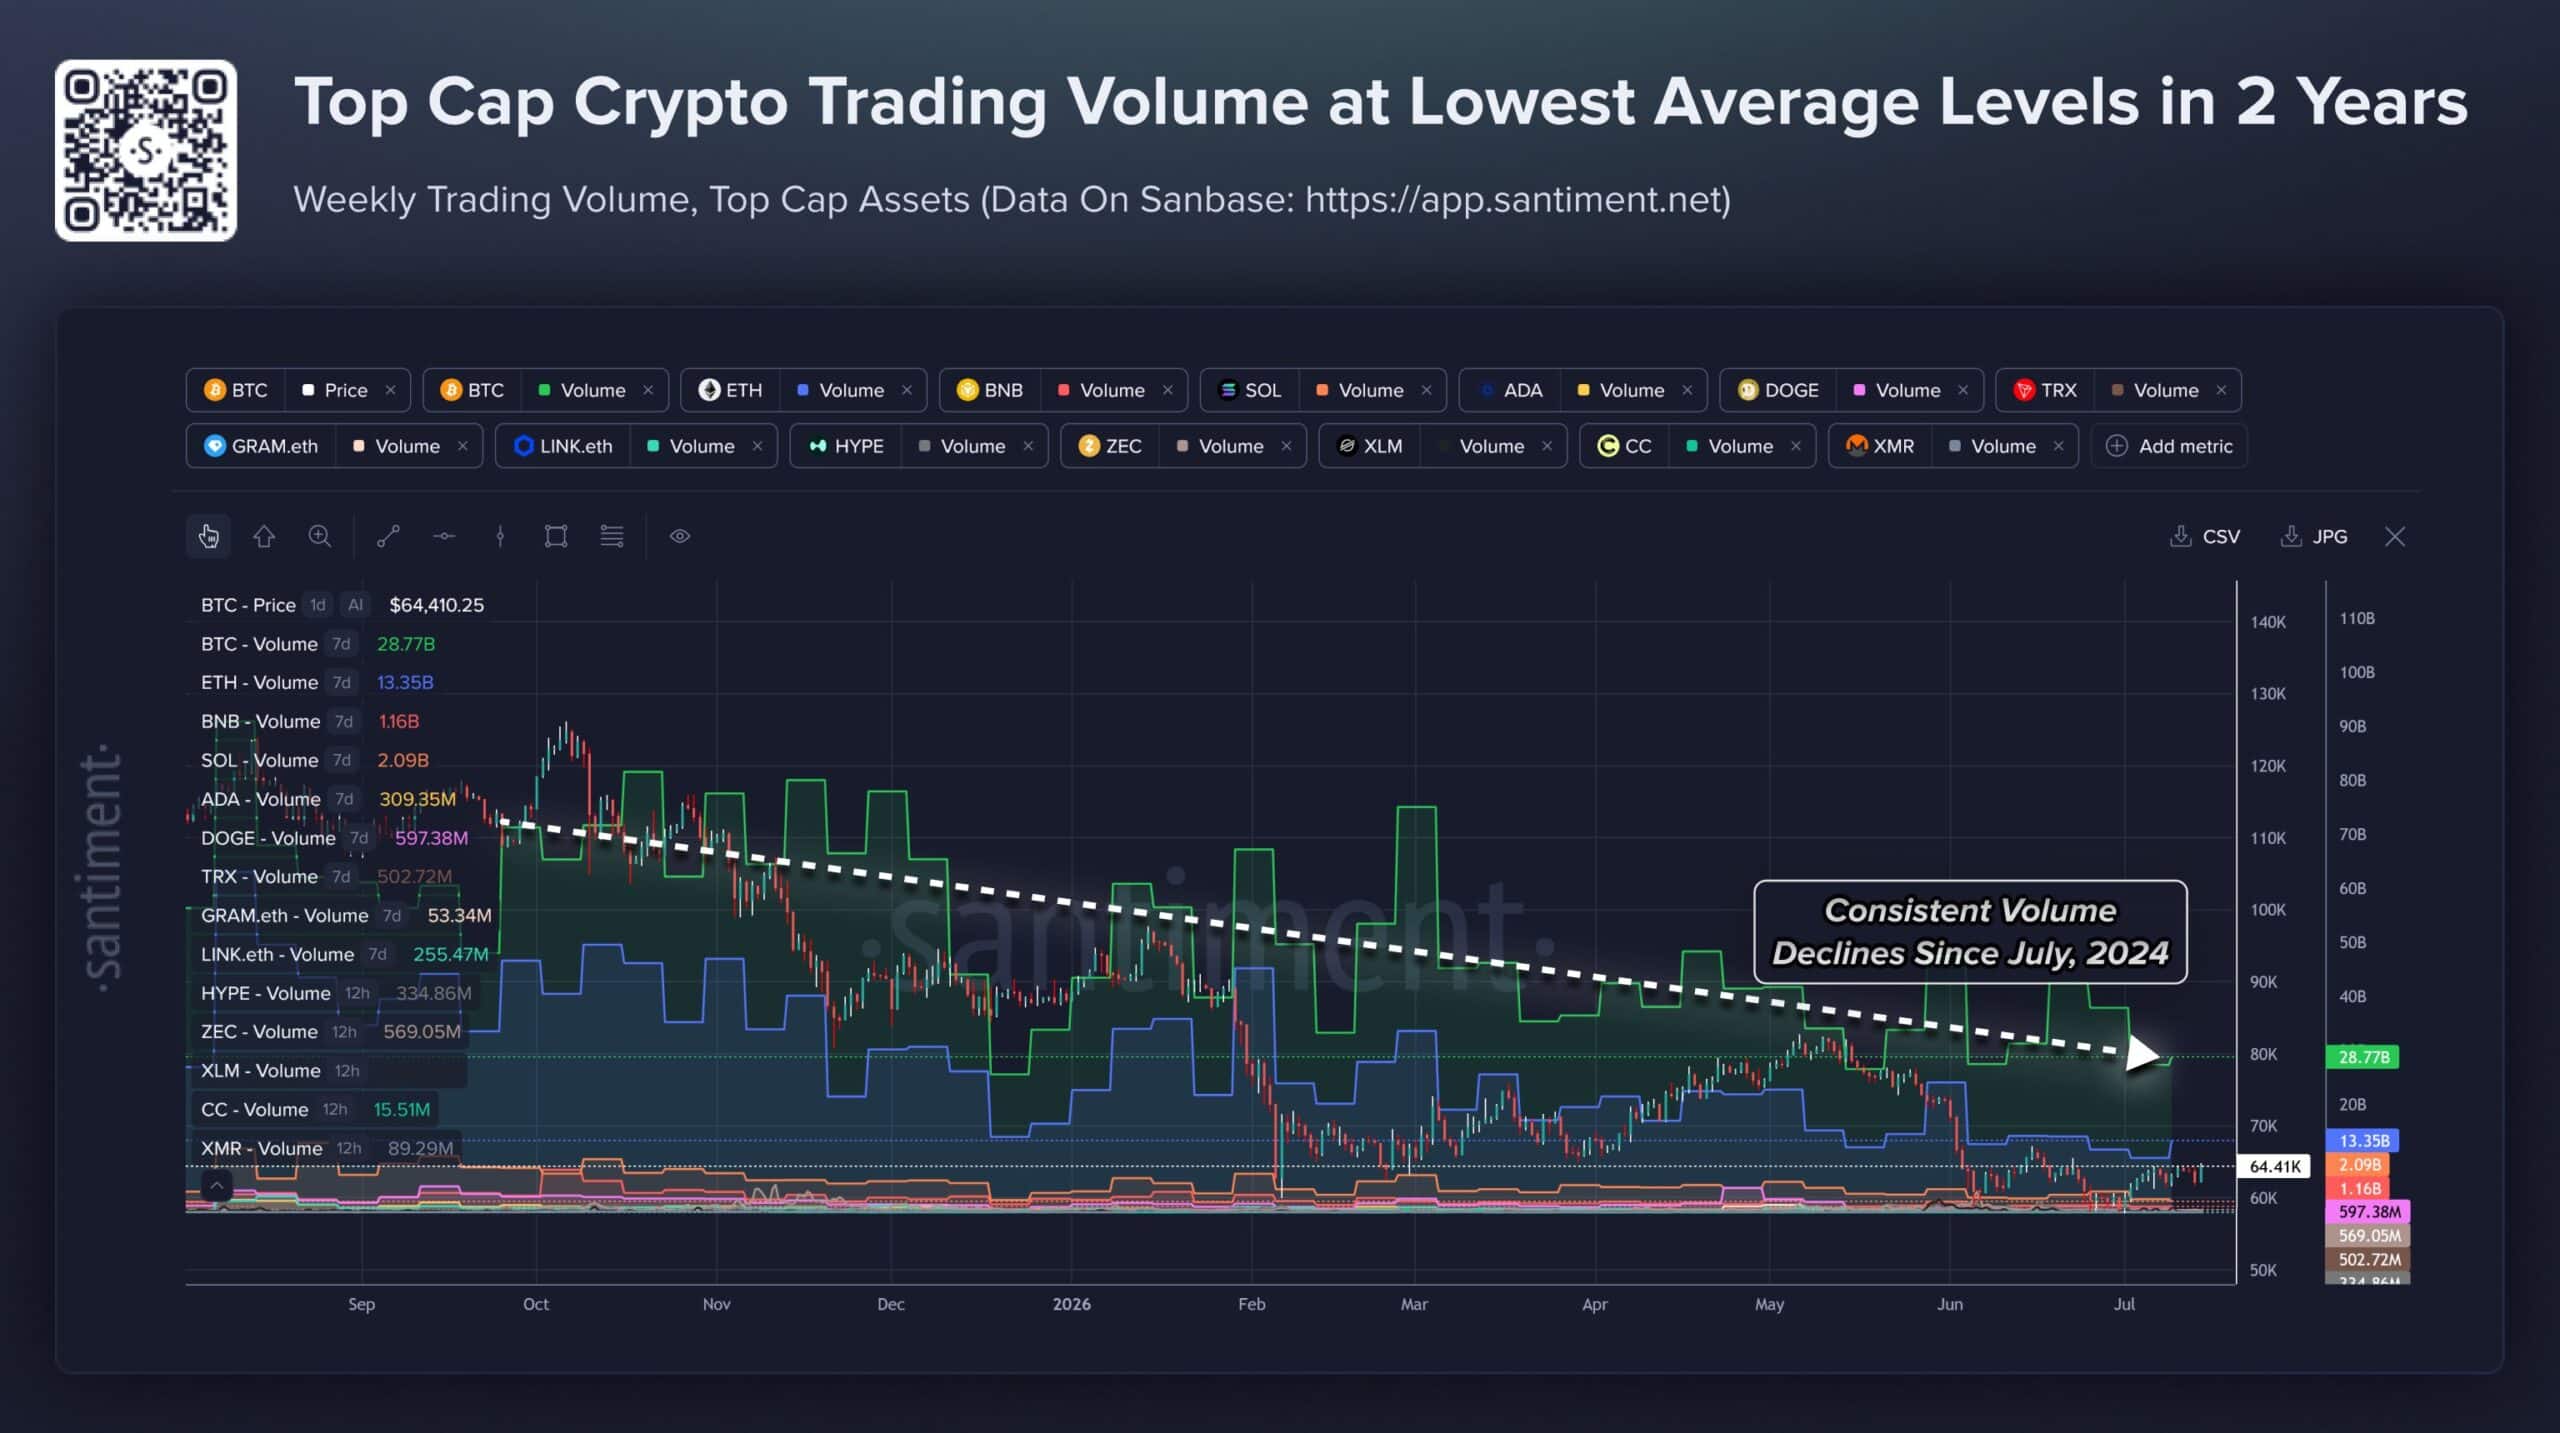
Source: Santiment on X

The trading activity was at its weakest average level in two years. It reflected weak demand and lower market confidence. Market participants are not rotating capital as aggressively, and each sell-off prompts more capital to flee.

Heavy macro pressure, Bitcoin [BTC] spot ETF outflows, and bearish price action since October 2025 for the leading crypto helped explain the dwindling volumes.

Thin liquidity means that reduced demand would mean rallies can be more easily faded. Yet, if seller exhaustion has reached cyclical extremes, a subsequent recovery could be quick, and even modest buying pressure could move prices quickly.

The Solana buying opportunity
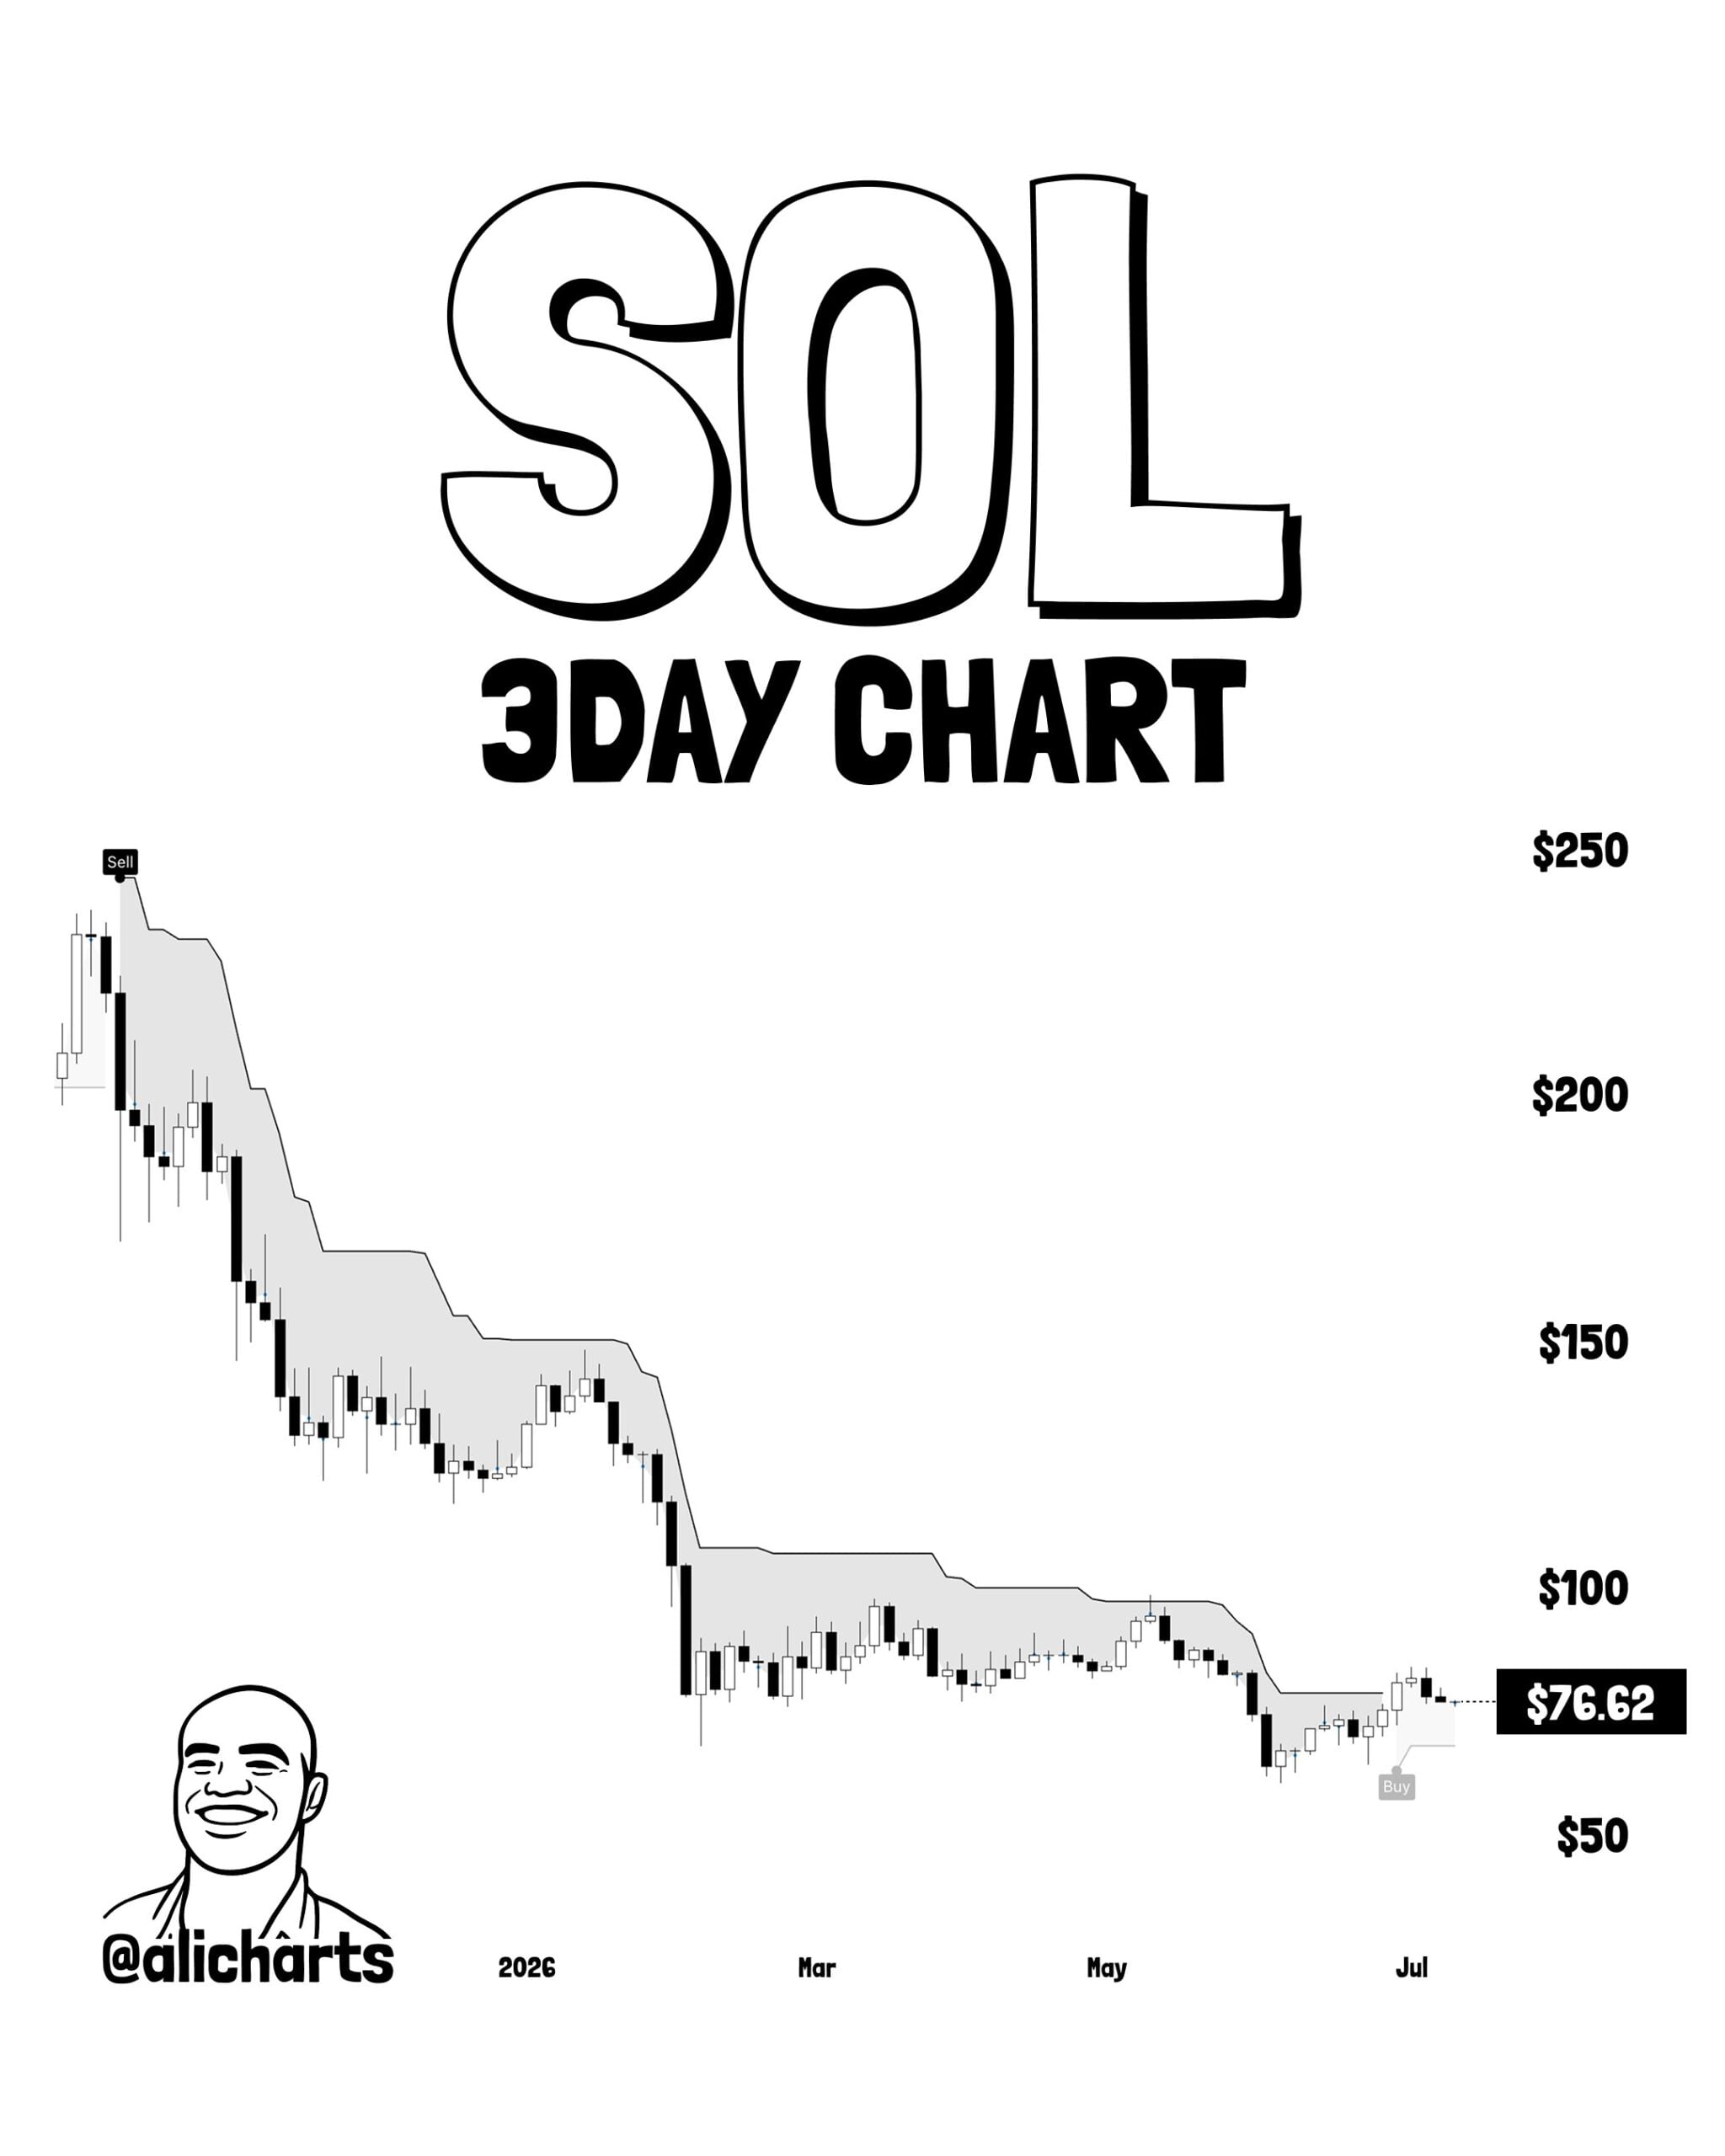
Source: Ali Charts on X

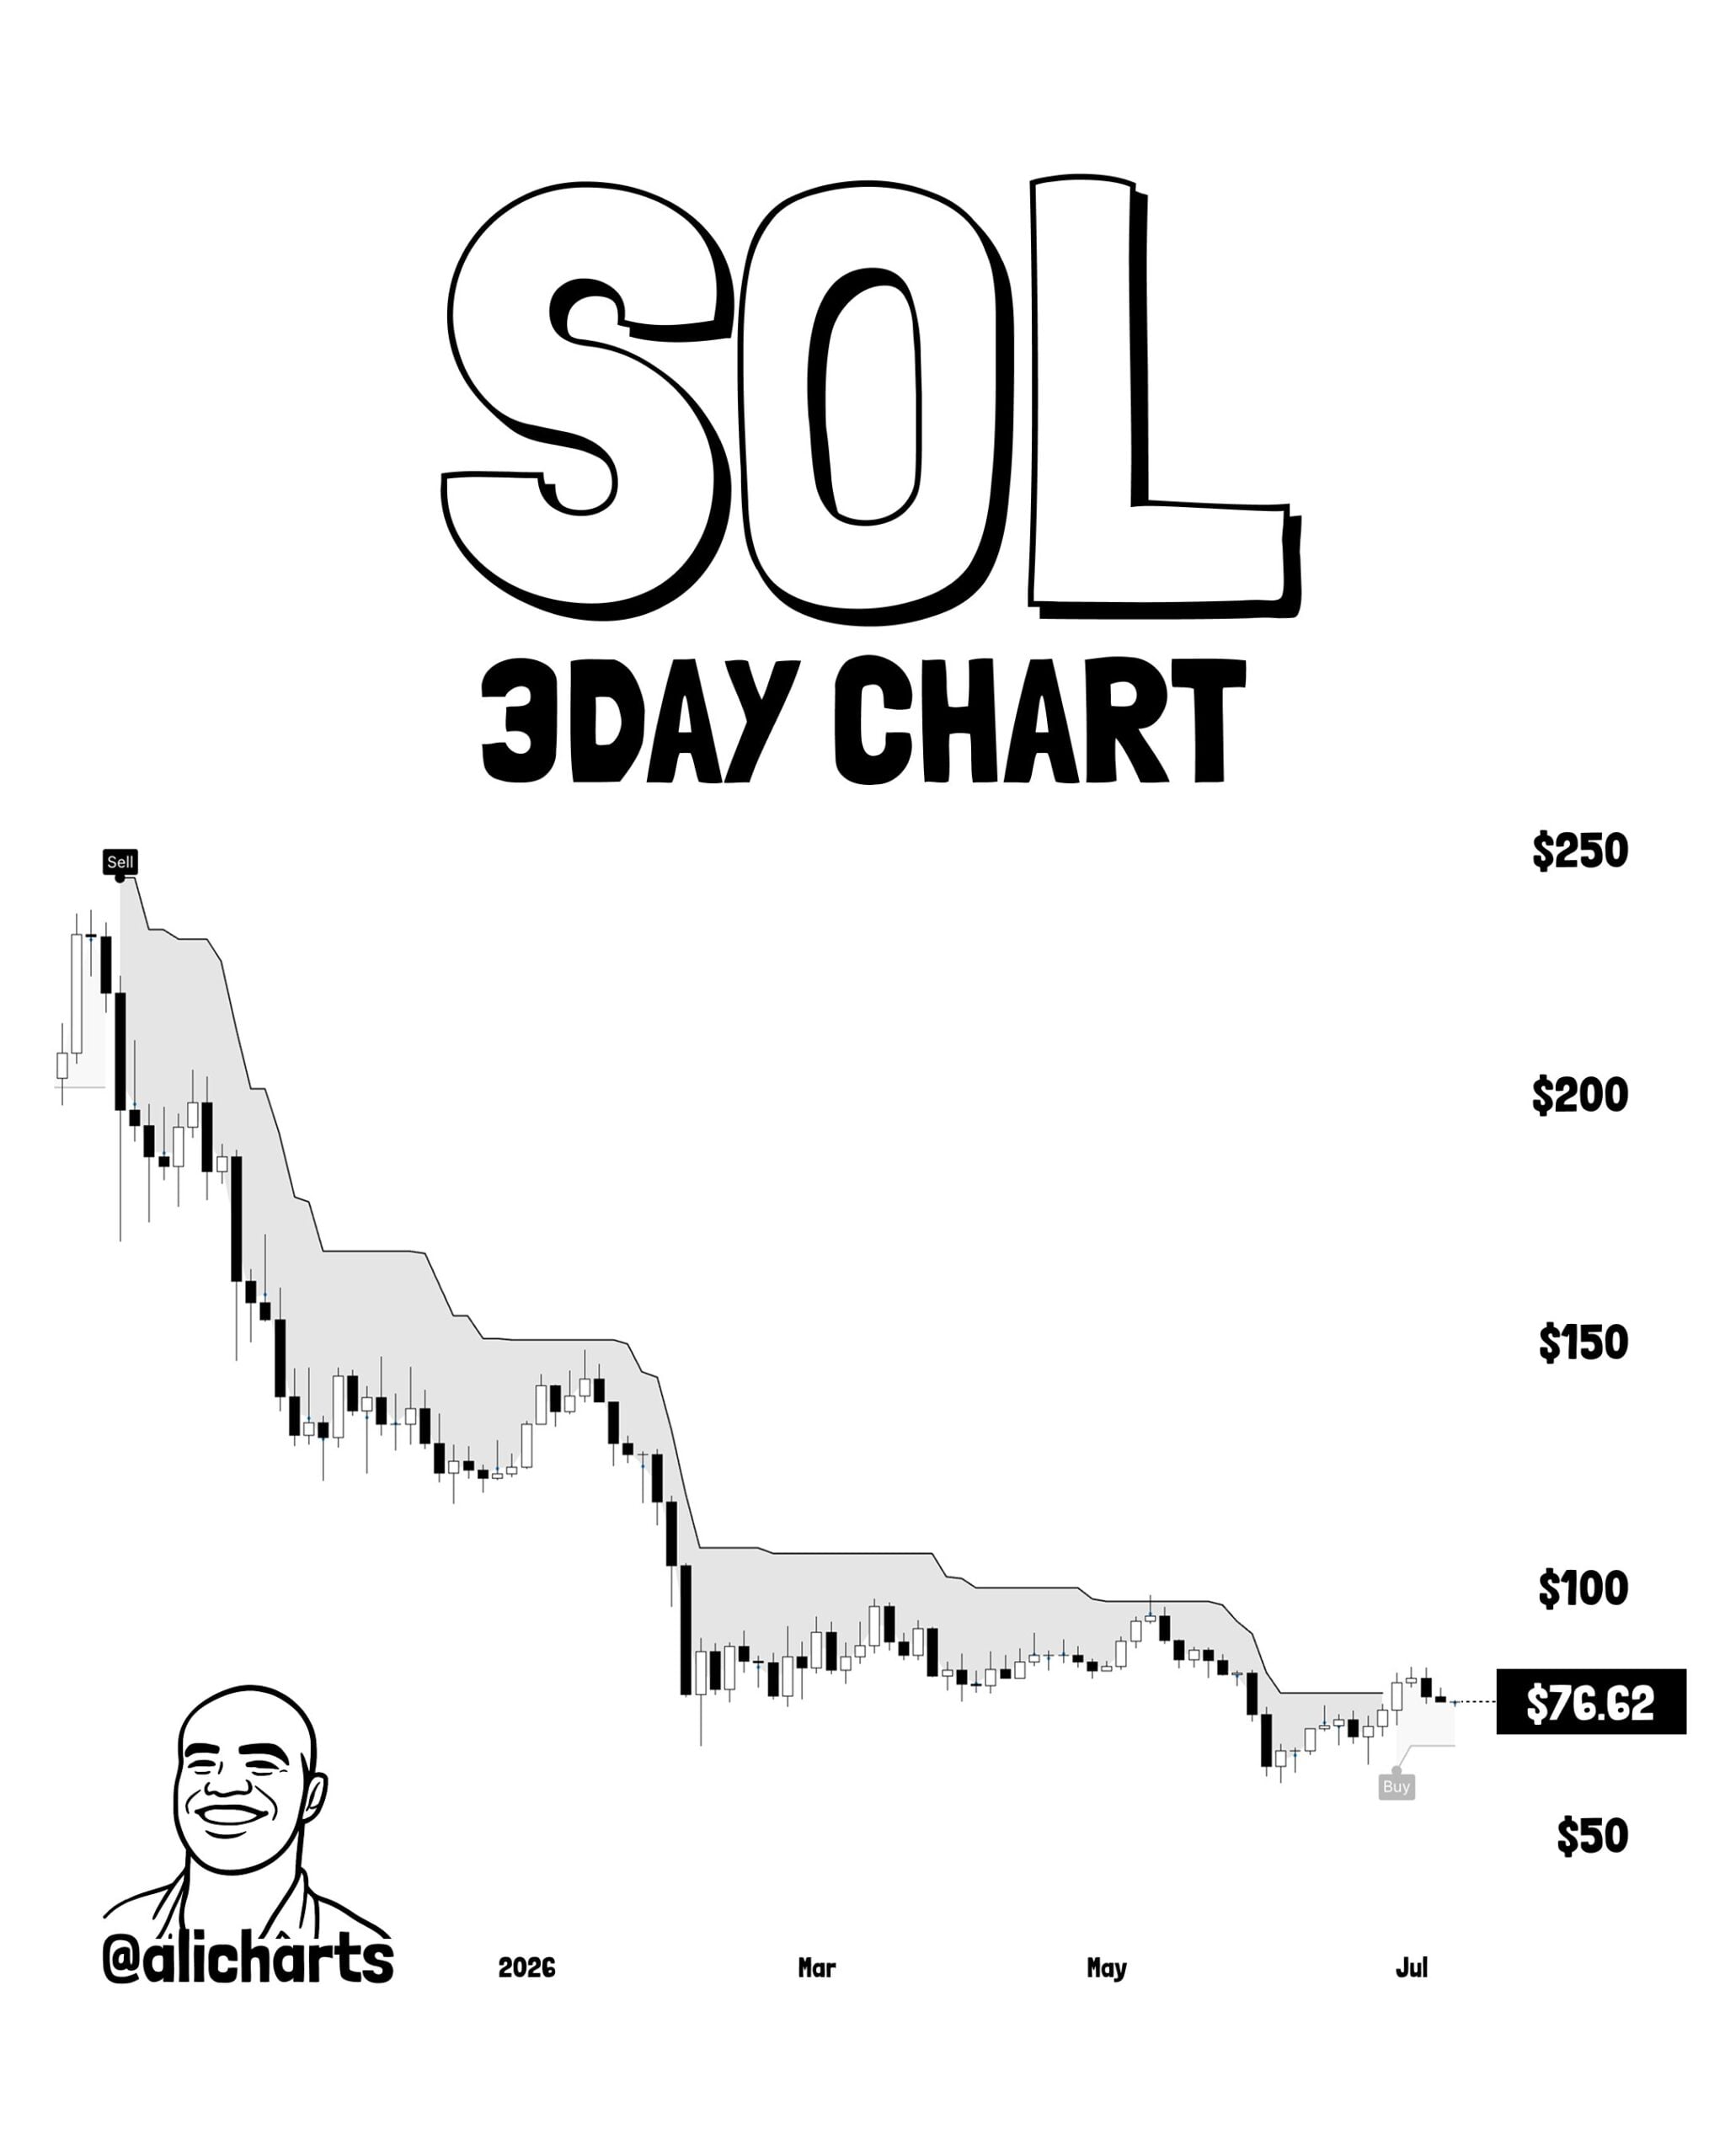
Against this backdrop of reduced volume, Solana [SOL] has turned bullish, according to crypto analyst Ali Martinez. The popular technical analyst used the SuperTrend tool on the 3-day timeframe to show that the ATR trailing stop has flipped bullishly.

This is a buy signal, and the $96 and $121 levels were the next levels to watch out for.

The Hodler Net Position Change metric on Glassnode has been positive throughout 2026. The metric tracks the monthly position change among long-term investors, and positive trends show hodlers were actively adding to their holdings.

SOL still trading within a bearish trend
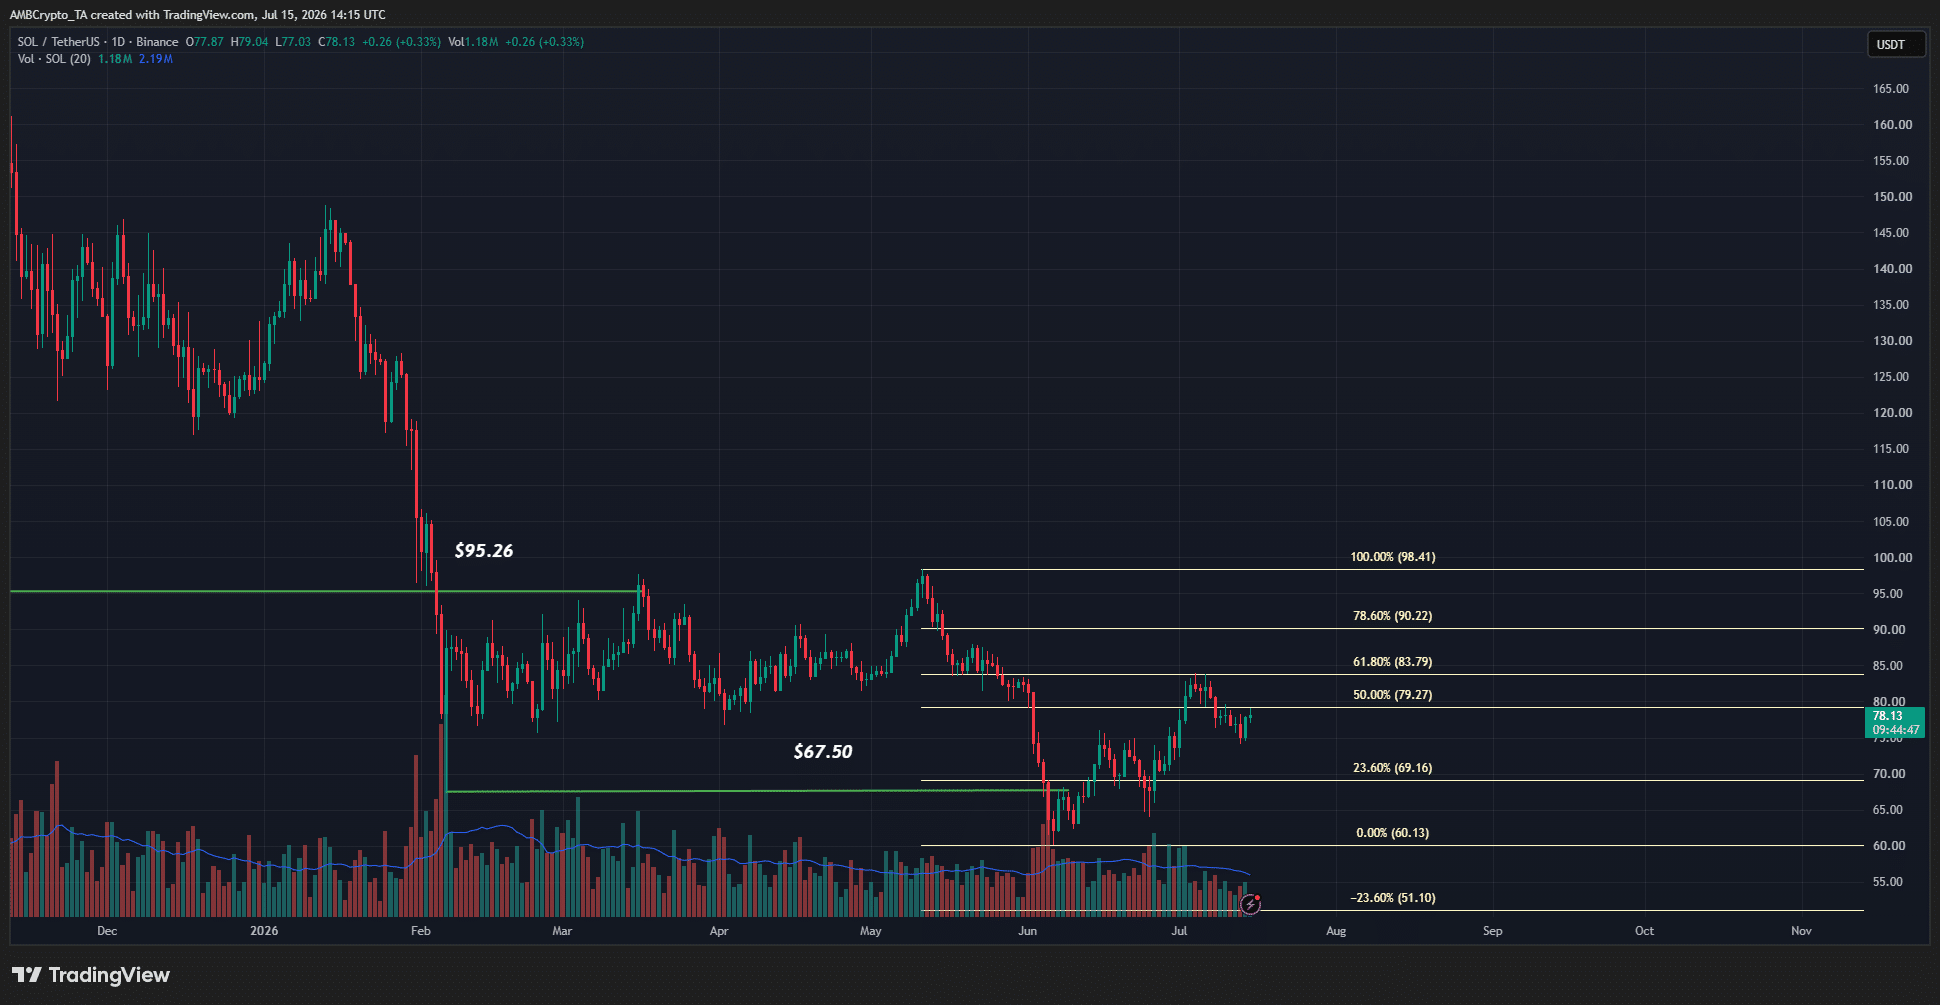
Source: SOL/USDT on TradingView

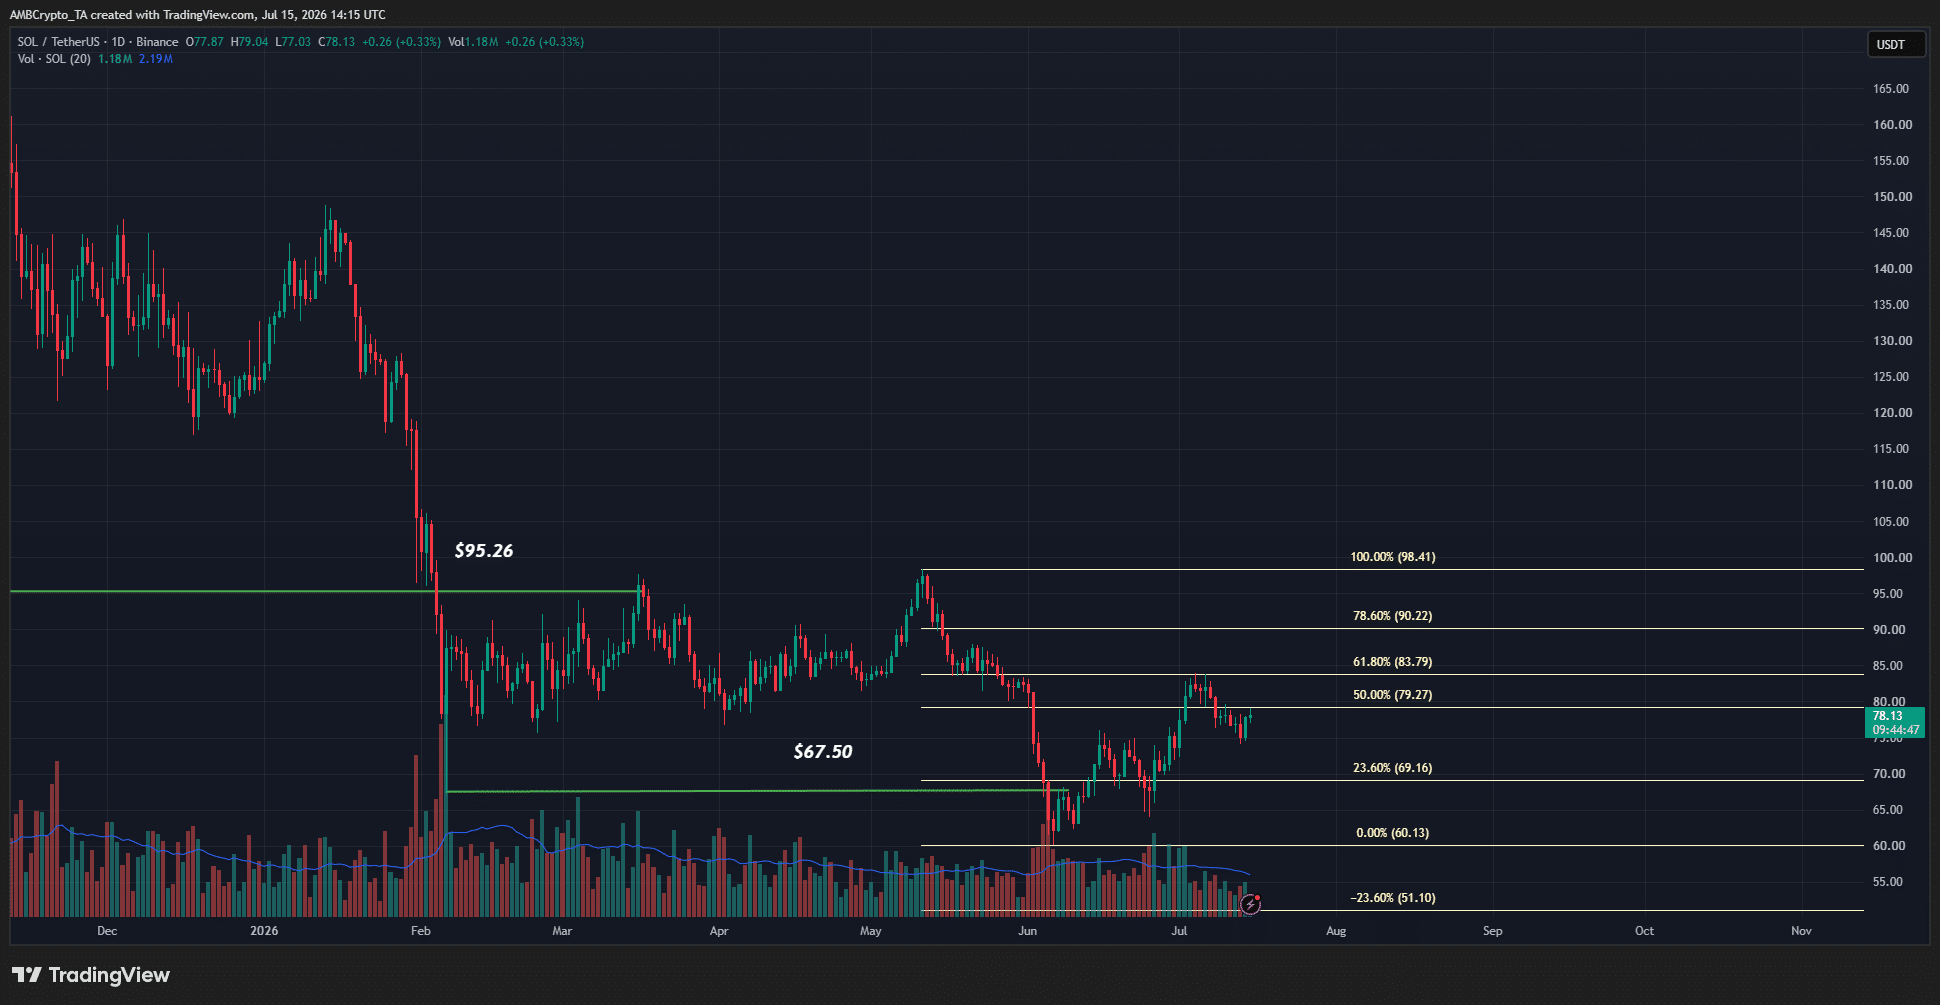
The swing lows at $95.26 and $67.50 were broken earlier this year, keeping the bearish Solana swing structure in place. Based on the drop from $98.41 to $60.13, Fibonacci retracement levels were plotted.

The $83.79 and $90.22 were the key resistance levels to watch out for. Another one was the $116 level, which was the realized price of Solana. Since the market price was well below this level, it showed that the aggregate holder base was facing unrealized losses.

This can prompt a sell-off on subsequent price bounces, making recovery harder until the wider market recovers and attracts greater capital inflows.

Recent selling pressure has also been reinforced by large token movements. A $15.14 million onchain SOL token move from Alameda Research was spotted recently, and the subsequent short-term price move resulted in just over $10 million in long liquidations.


Final Summary

  • The Solana buy signal in recent days and hodler accumulation trends throughout 2026 gave the altcoin a bullish tint.
  • Yet, the price charts and overhead supply zones meant a meaningful recovery would be difficult and requires greater capital inflows.


熱門幣種推薦

相關問答

QAccording to Ali Martinez, what time frame and indicator were used to identify the bullish buy signal for Solana?

AAccording to crypto analyst Ali Martinez, he used the SuperTrend tool on the 3-day timeframe to identify that the ATR trailing stop had flipped bullishly, signaling a buy signal for Solana.

QWhat are the two key price levels mentioned as next to watch for Solana based on the bullish signal?

ABased on the bullish buy signal, the two key price levels to watch for Solana are $96 and $121.

QWhat does the Hodler Net Position Change metric being positive throughout 2026 indicate about Solana investors?

AThe Hodler Net Position Change metric being positive throughout 2026 indicates that long-term Solana investors (hodlers) were actively adding to their holdings and accumulating throughout that period.

QWhich Fibonacci retracement levels are highlighted as key resistance levels for Solana's price recovery?

AThe Fibonacci retracement levels highlighted as key resistance levels for Solana's price recovery are $83.79, $90.22, and the $116 level (which corresponds to Solana's realized price).

QWhat on-chain event from Alameda Research was mentioned as reinforcing recent selling pressure on Solana?

AA $15.14 million on-chain Solana token move from Alameda Research was mentioned as reinforcing recent selling pressure, which contributed to over $10 million in long liquidations following a short-term price move.

你可能也喜歡

交易

現貨

熱門文章

如何購買CHECK

歡迎來到HTX.com!在這裡,購買Checkmate (CHECK)變得簡單而便捷。跟隨我們的逐步指南,放心開始您的加密貨幣之旅。第一步:創建您的HTX帳戶使用您的 Email、手機號碼在HTX註冊一個免費帳戶。體驗無憂的註冊過程並解鎖所有平台功能。立即註冊第二步:前往買幣頁面,選擇您的支付方式信用卡/金融卡購買:使用您的Visa或Mastercard即時購買Checkmate (CHECK)。餘額購買:使用您HTX帳戶餘額中的資金進行無縫交易。第三方購買:探索諸如Google Pay或Apple Pay等流行支付方式以增加便利性。C2C購買:在HTX平台上直接與其他用戶交易。HTX 場外交易 (OTC) 購買:為大量交易者提供個性化服務和競爭性匯率。第三步:存儲您的Checkmate (CHECK)購買Checkmate (CHECK)後,將其存儲在您的HTX帳戶中。您也可以透過區塊鏈轉帳將其發送到其他地址或者用於交易其他加密貨幣。第四步:交易Checkmate (CHECK)在HTX的現貨市場輕鬆交易Checkmate (CHECK)。前往您的帳戶,選擇交易對,執行交易,並即時監控。HTX為初學者和經驗豐富的交易者提供了友好的用戶體驗。

839 人學過發佈於 2026.01.19更新於 2026.06.02

如何購買CHECK

相關討論

歡迎來到 HTX 社群。在這裡,您可以了解最新的平台發展動態並獲得專業的市場意見。 以下是用戶對 CHECK (CHECK)幣價的意見。

活动图片